
In today’s digital era, the shift to the cloud and complex microservices architectures makes understanding the flow of requests across various services essential for maintaining system reliability and performance. Distributed tracing provides visibility, allowing you to track and analyze requests across system components. Such insights are invaluable for discovering unknown unknowns, diagnosing issues, and ensuring efficient operations. However, as systems grow more complex, the volume of data can be overwhelming, making it difficult to identify trends, pinpoint issues, and isolate root causes.
We’re excited to announce the first version of our new Distributed Tracing app, a part of the new Dynatrace user experience that leverages the full power of the Dynatrace platform. With the Distributed Tracing app, you can flexibly slice and dice raw trace data to understand what went wrong and why. Find what you’re looking for faster with:
- Enhanced charting and data visualization: Easily filter, group, search, and visualize trace data to gain deeper insights into your system’s behavior.
- Automatic data capture and display: More data, including span attributes, is available for out-of-the-box analysis, with no additional configuration necessary.
- Seamless OpenTelemetry integration: Make the most of your trace data with native support of OpenTelemetry traces. For more details, see our recent blog post explaining how new Dynatrace capabilities help modern app teams analyze OpenTelemetry traces and log data at scale.
Whether you’re troubleshooting a specific issue or looking to improve overall system performance, Distributed tracing equips you with the tools you need to make informed decisions and maintain a high standard of application performance.
To understand the benefits of the Distributed Tracing app, let’s take a look at a typical scenario.
Use Distributed Tracing to improve application performance and troubleshoot faster
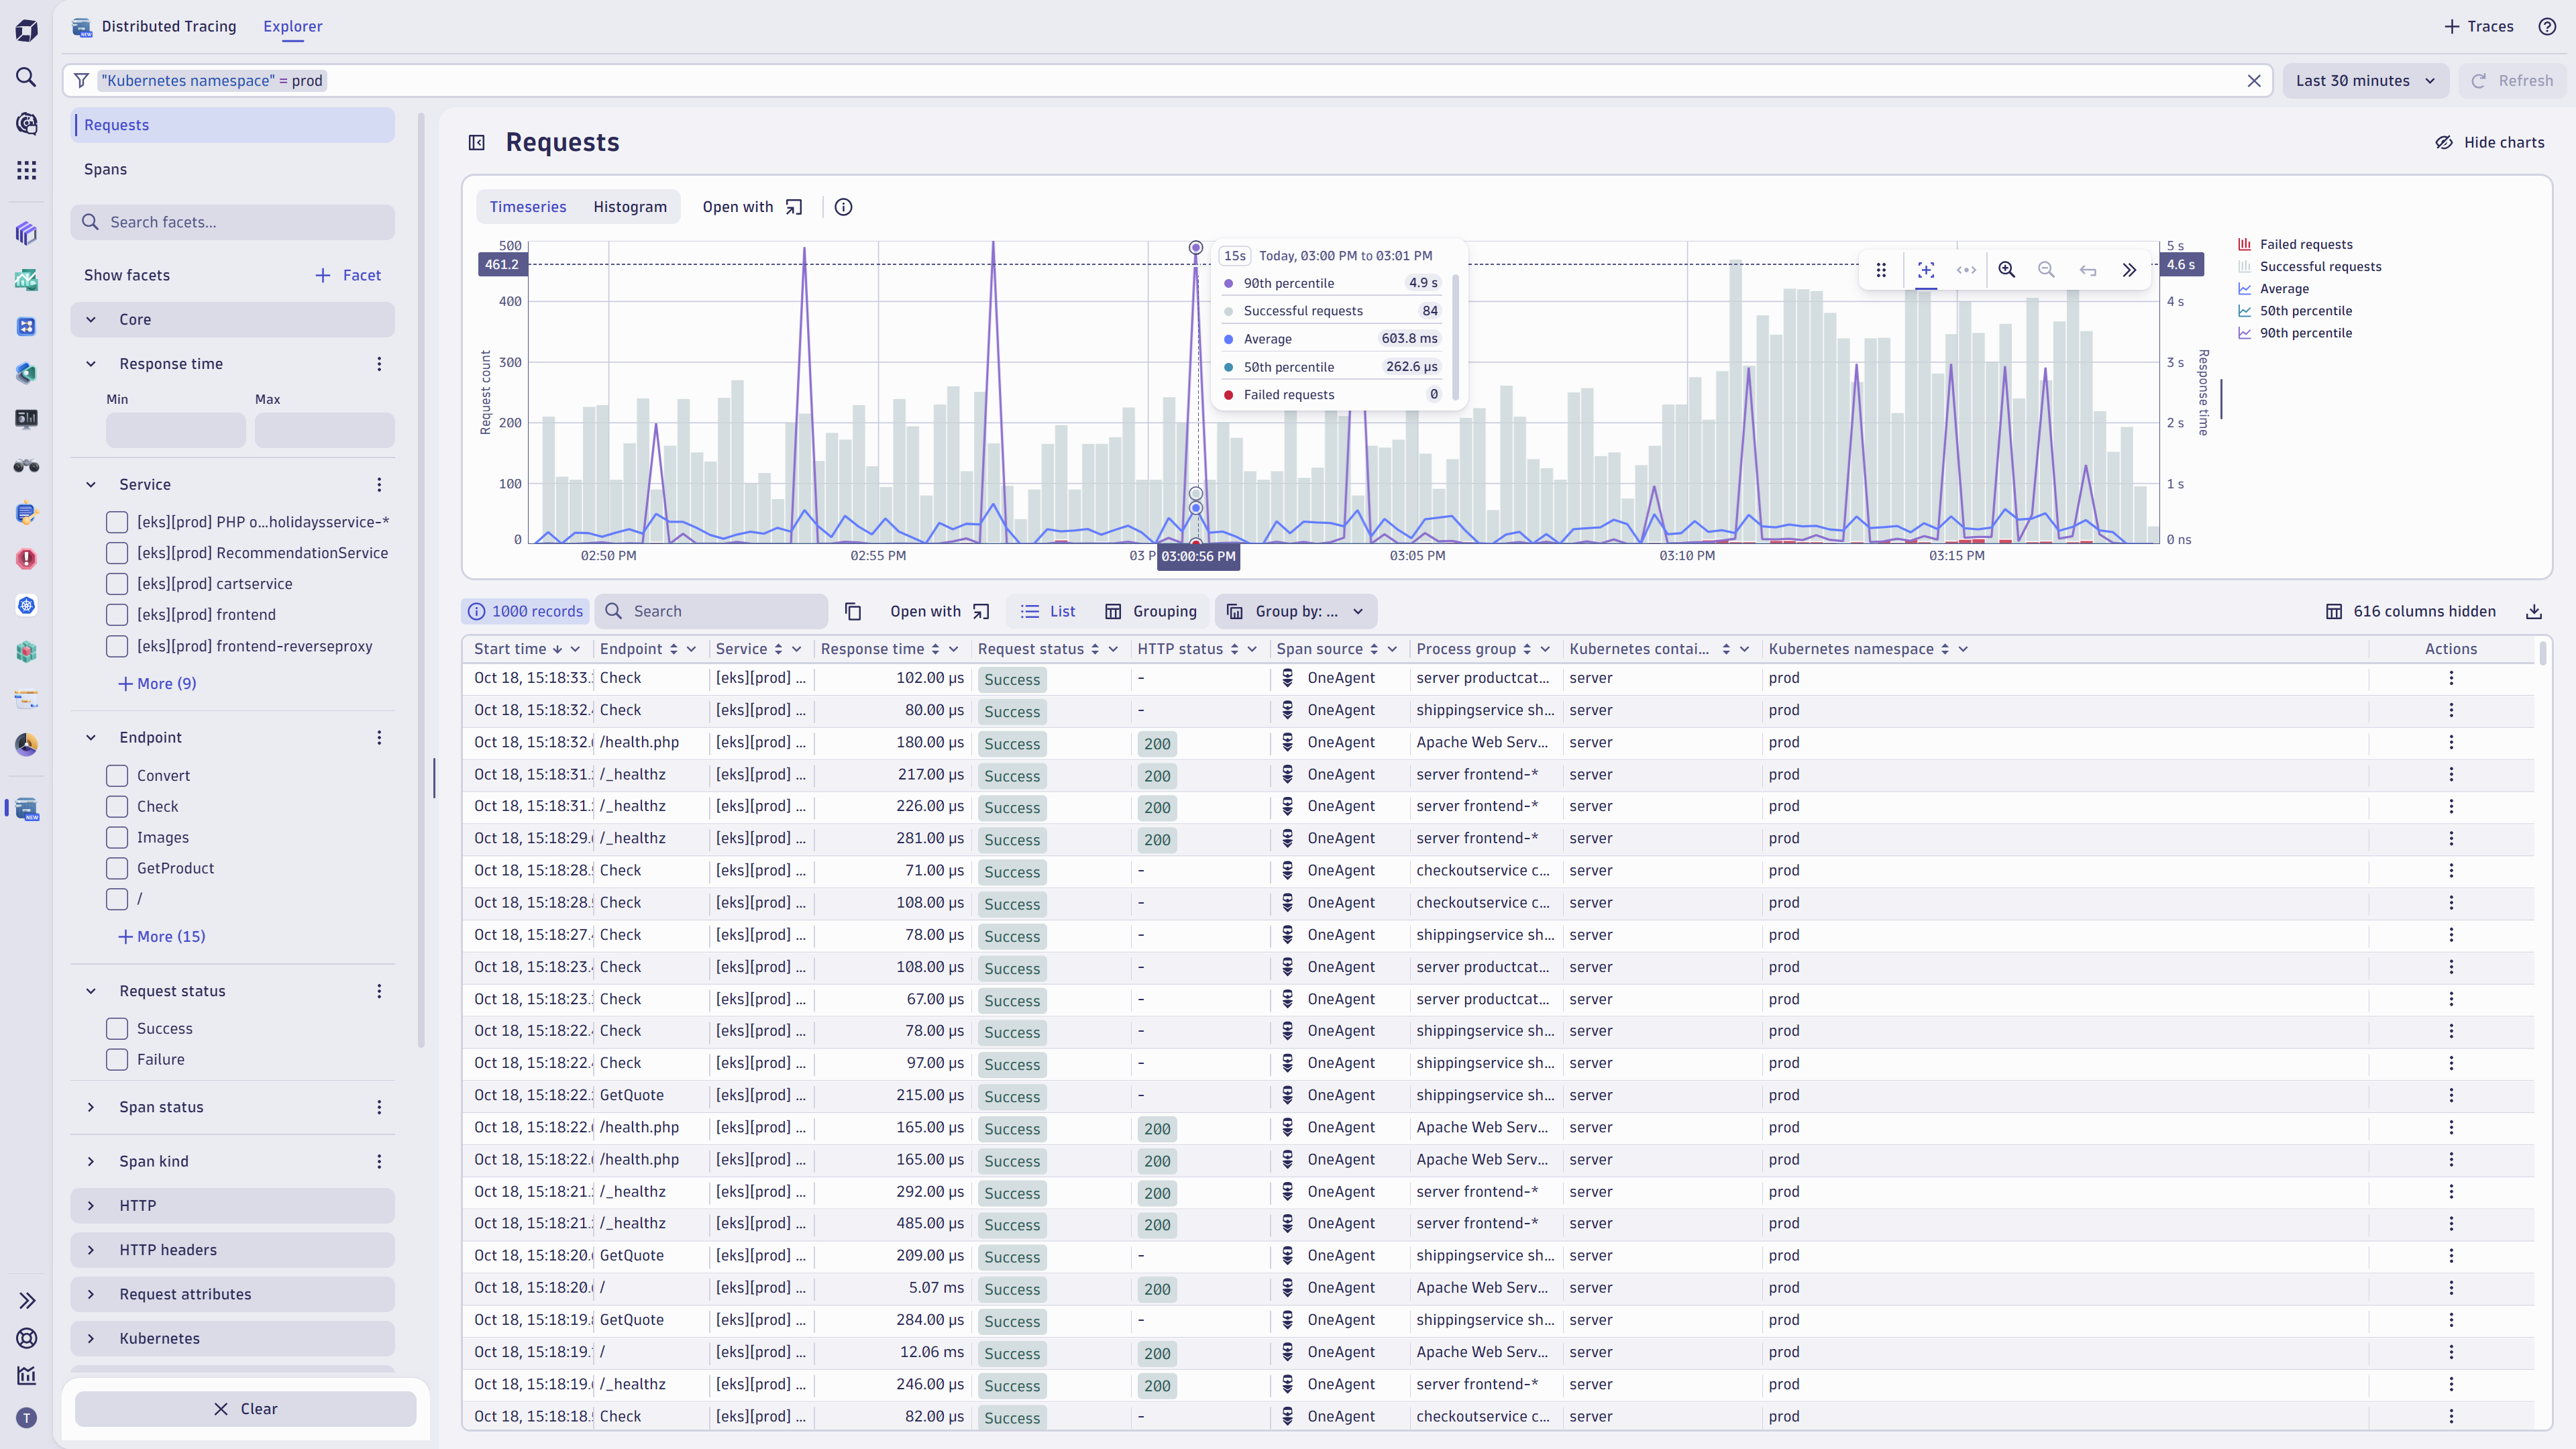
In this scenario, an e-commerce business uses Dynatrace to monitor the performance of its online store. They use Kubernetes to power their marketplace. The team decides to dig into the “prod” namespace to perform exploratory analysis of their critical production workloads.
By opening the time series view filtered by the “prod” cluster, the team immediately notices spikes in the 90% decile of request response times. These performance outliers in production are impacting customer experience, so the team needs to investigate further.
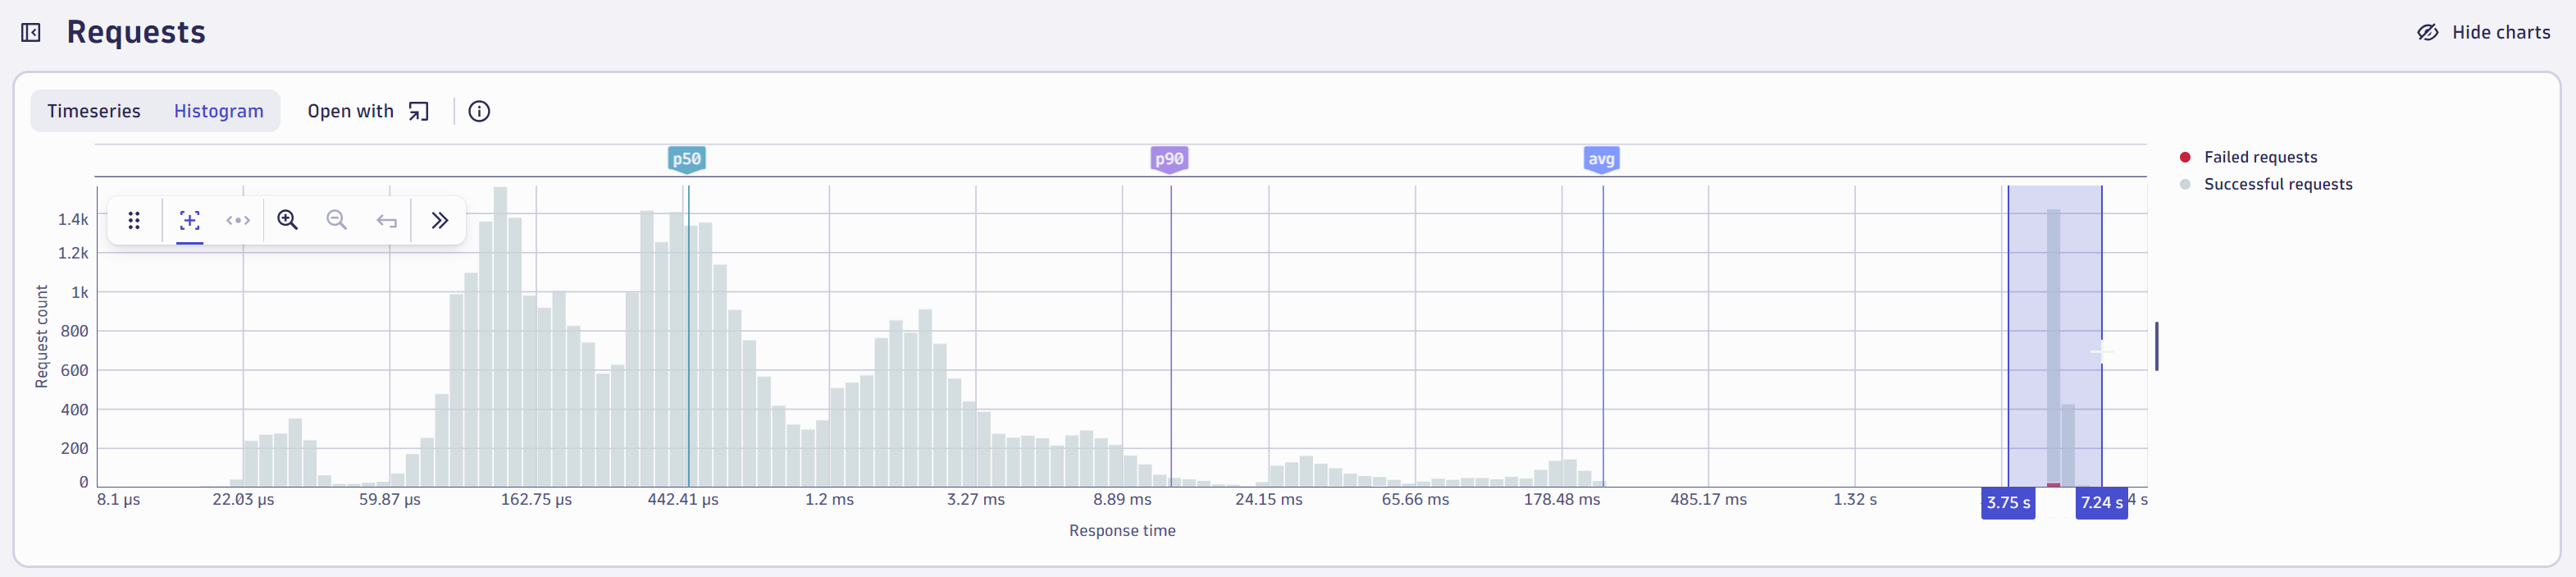
By analyzing the response time distribution in the histogram, the team notices that the outliers occur when the response time is around 5 seconds.
Next, the team leverages the interactive chart, hovering over the outlier requests to see real-time details. In the image below, they select the range of slow requests (3.7 s – 7.24 s) to investigate further.
Now filtered, the image below shows only requests in the time bucket selected (3.7 s -7.24 s).

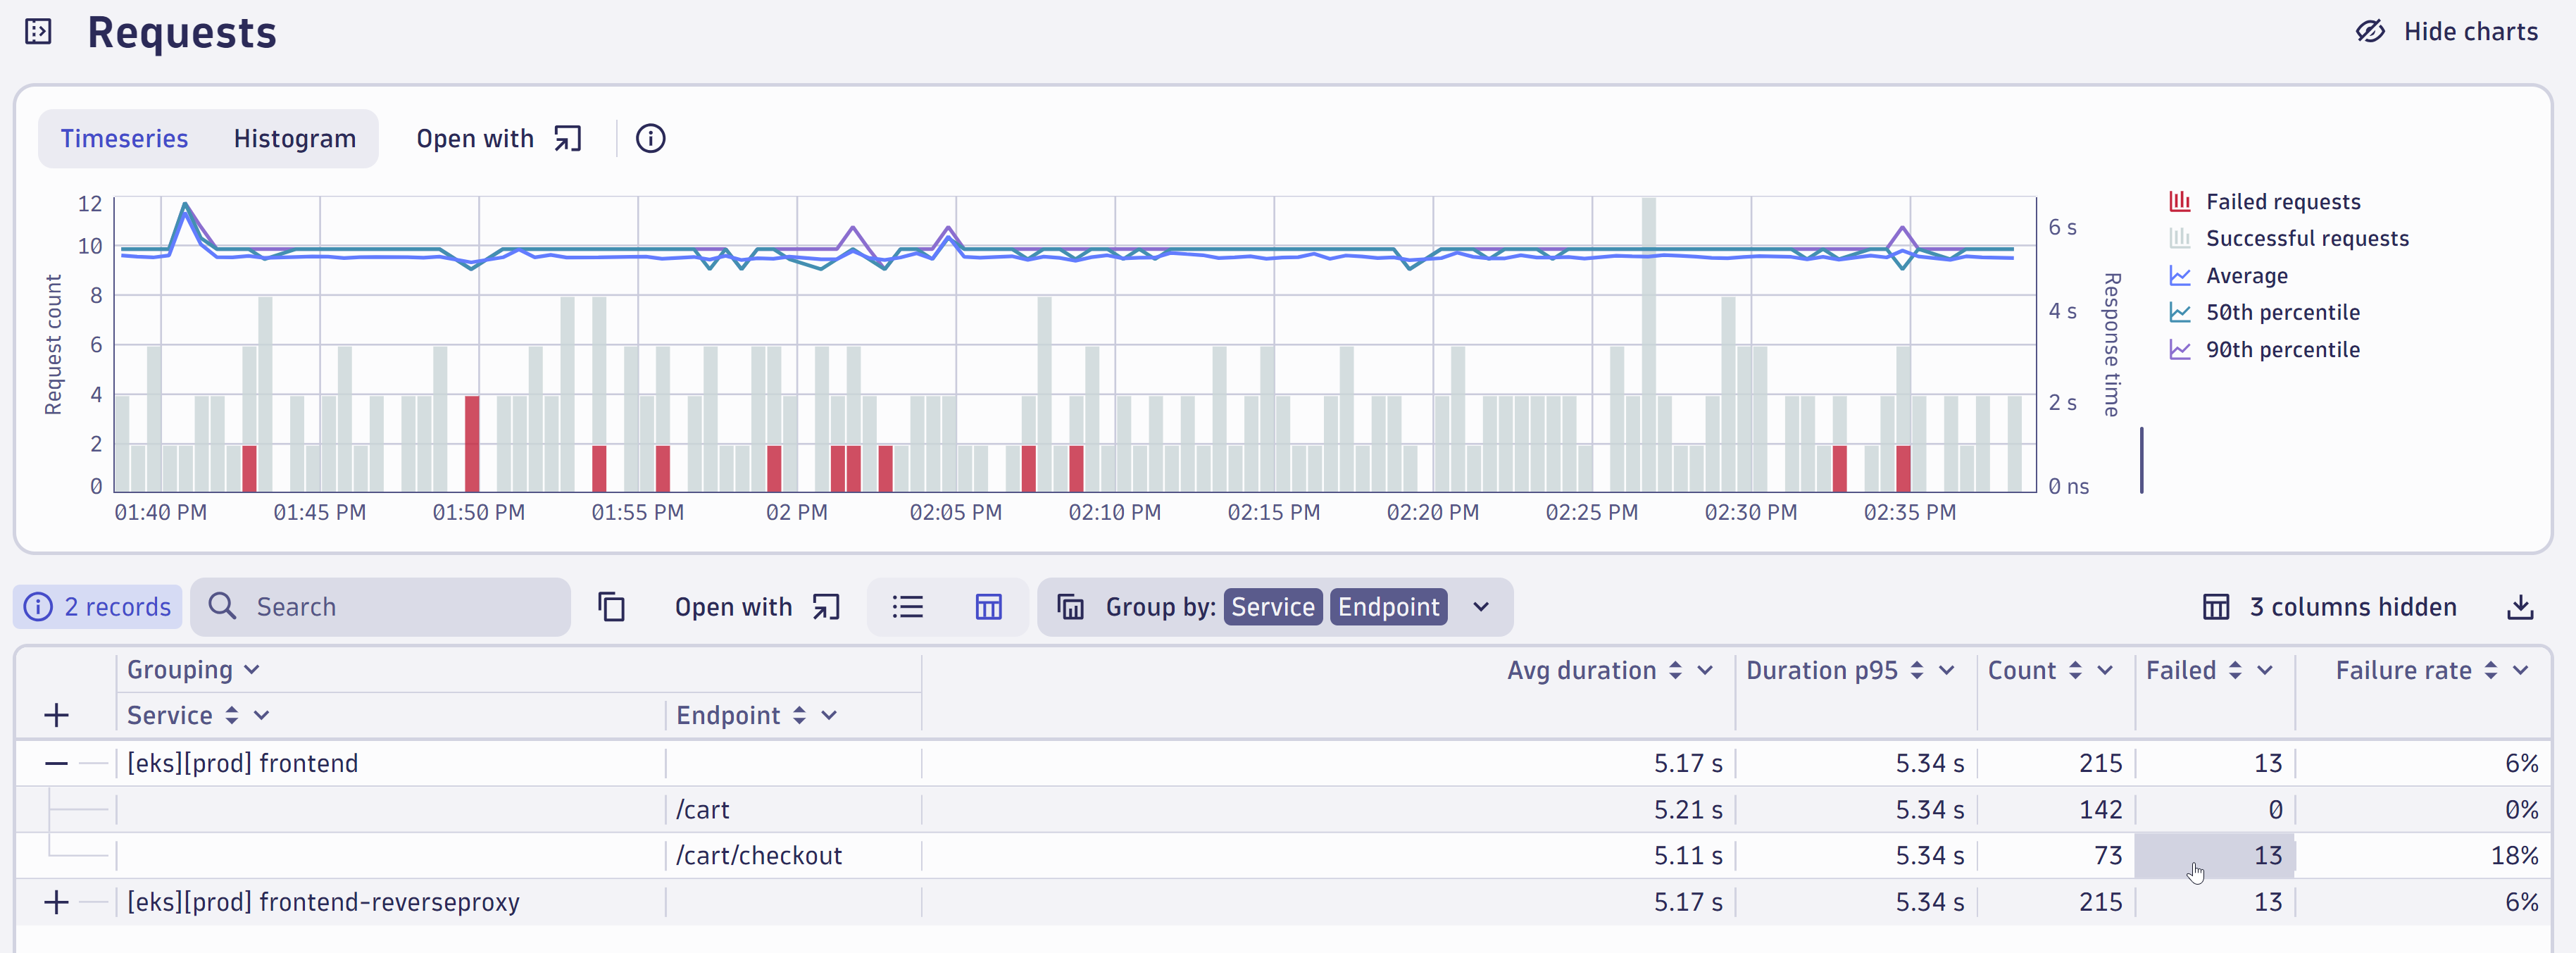
The filter bar displays all the filters applied during the analysis. To better understand where slow response times are occurring, the e-commerce team decides to group requests by service and endpoint.
To focus on an essential endpoint for the e-commerce website, they use a wildcard (*) to filter on endpoints that start with "/cart".

This investigation reveals that requests in the “/cart/checkout” endpoint are failing. The team filters further by the “/cart/checkout endpoint” attribute value.
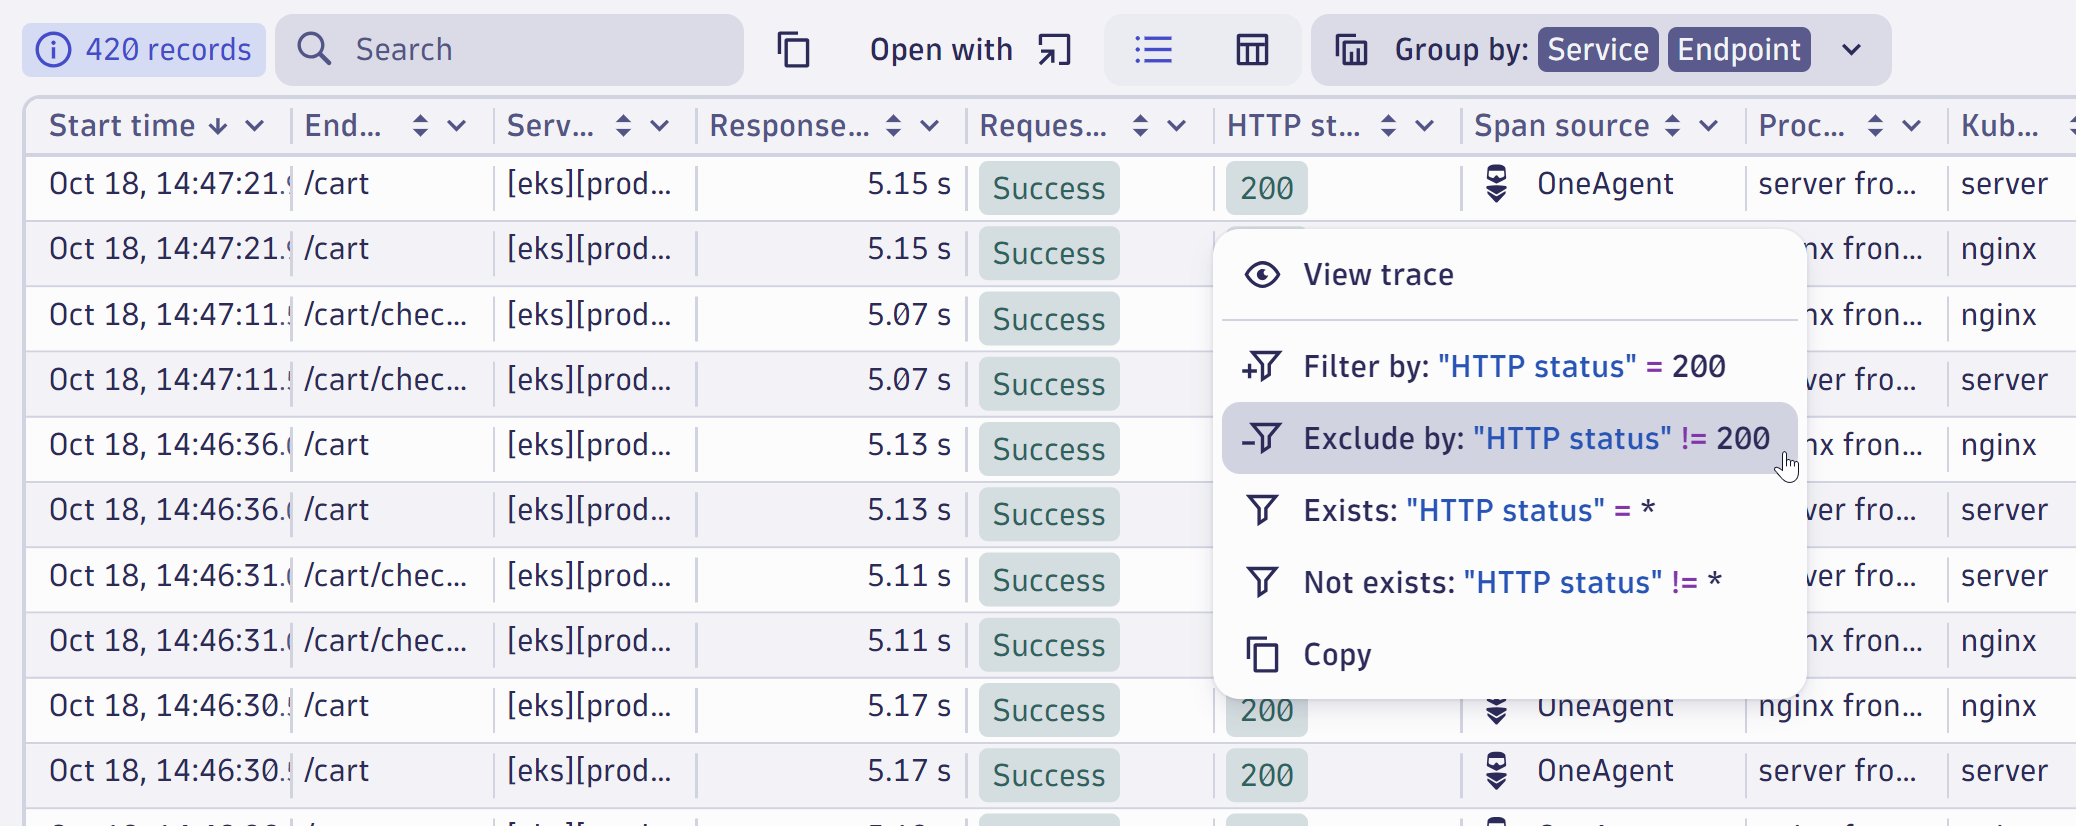
To pinpoint the exact requests that are failing, the e-commerce team filters by excluding successful HTTP 200 status codes. This refinement reveals that only a few requests are failing. The team can now dive deeper to find out why.
To understand what happened in detail, the team clicks on an impacted trace and opens the waterfall view of the full trace.
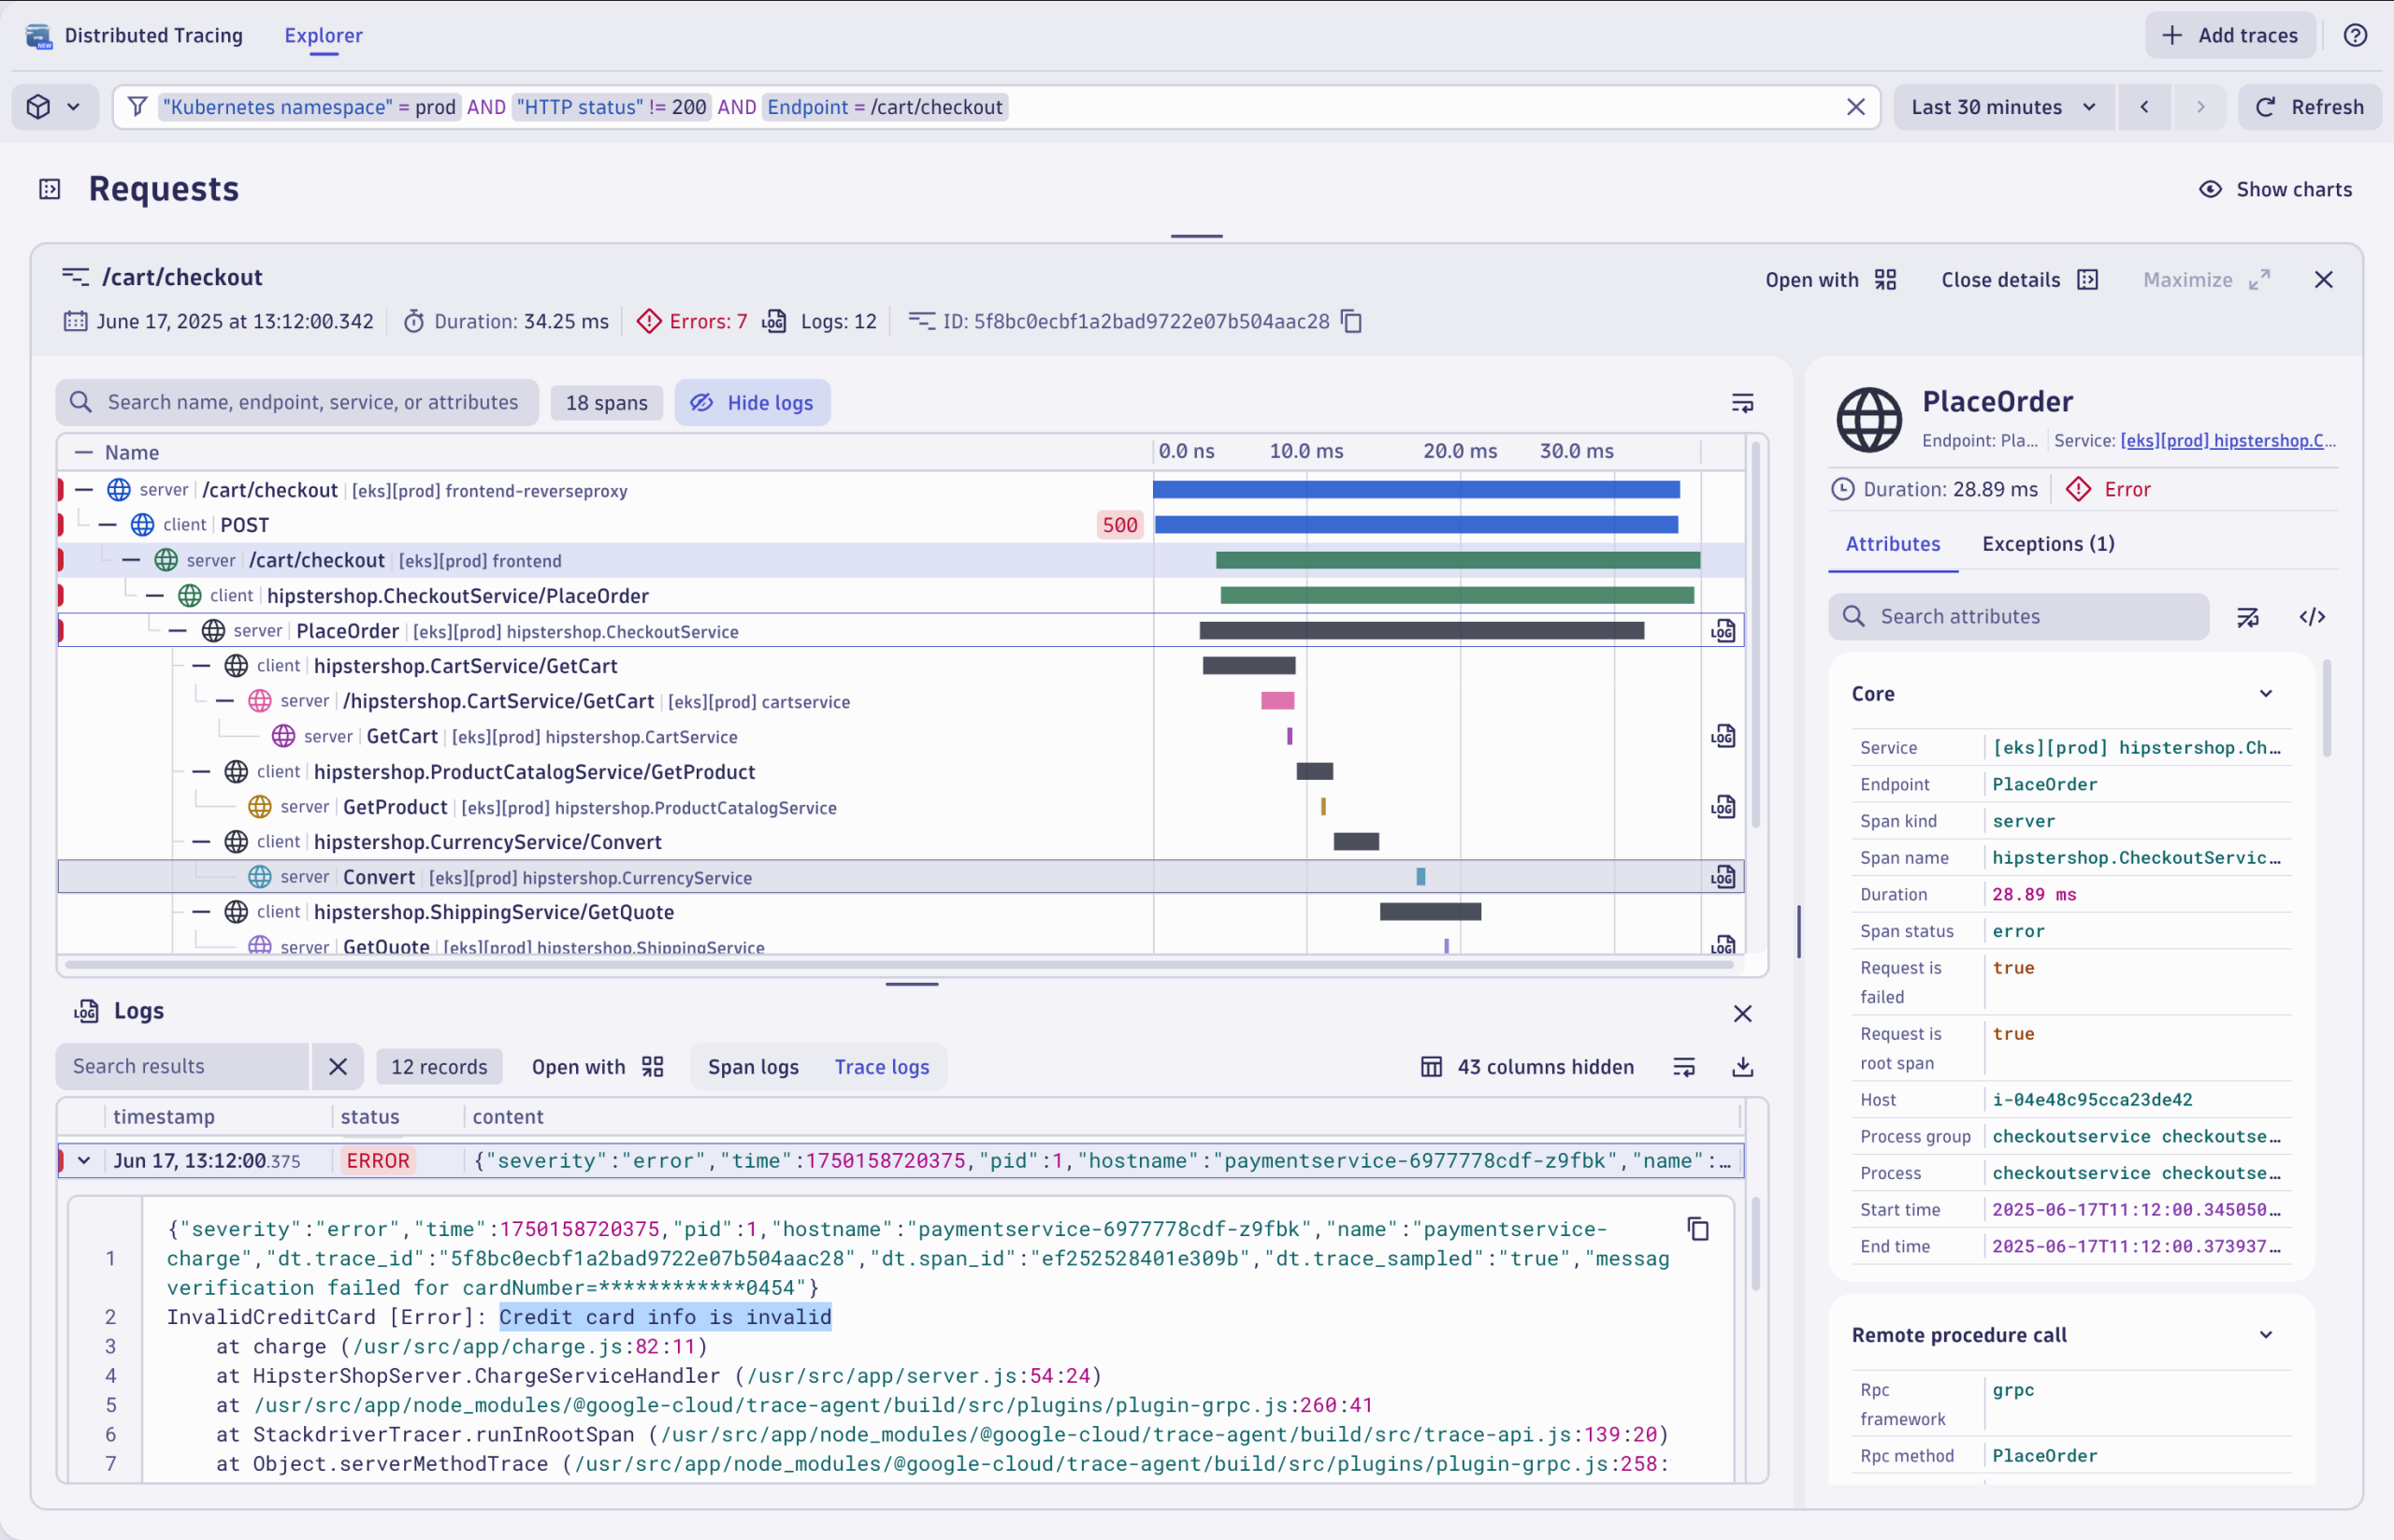
In the waterfall view, the team can quickly and easily switch among multiple traces and their attributes when analyzing issues. A span can have many different attributes, and the search function helps the team quickly find interesting insights. They search for “failure” and explore the exception tab. Here we’ve found some exceptions that happen rarely.
In this view, the root cause of the issue is clear: an exception is generated when a user tries to purchase an item with a card that is not a Visa or Mastercard. Instead of returning a 500 error, the application should provide the user with a failed payment message letting them know their card is the reason why the transaction was not completed. With these details, the issue is found, and they have the information needed to escalate the situation to their development teams and prioritize the creation and deployment of the needed fix.
With logs now integrated directly into the waterfall view, the team can see detailed log messages tied to each span without switching tools. This seamless access to both trace flow and detailed log context accelerates the investigation from symptom identification to root cause analysis
Explore service telemetry data
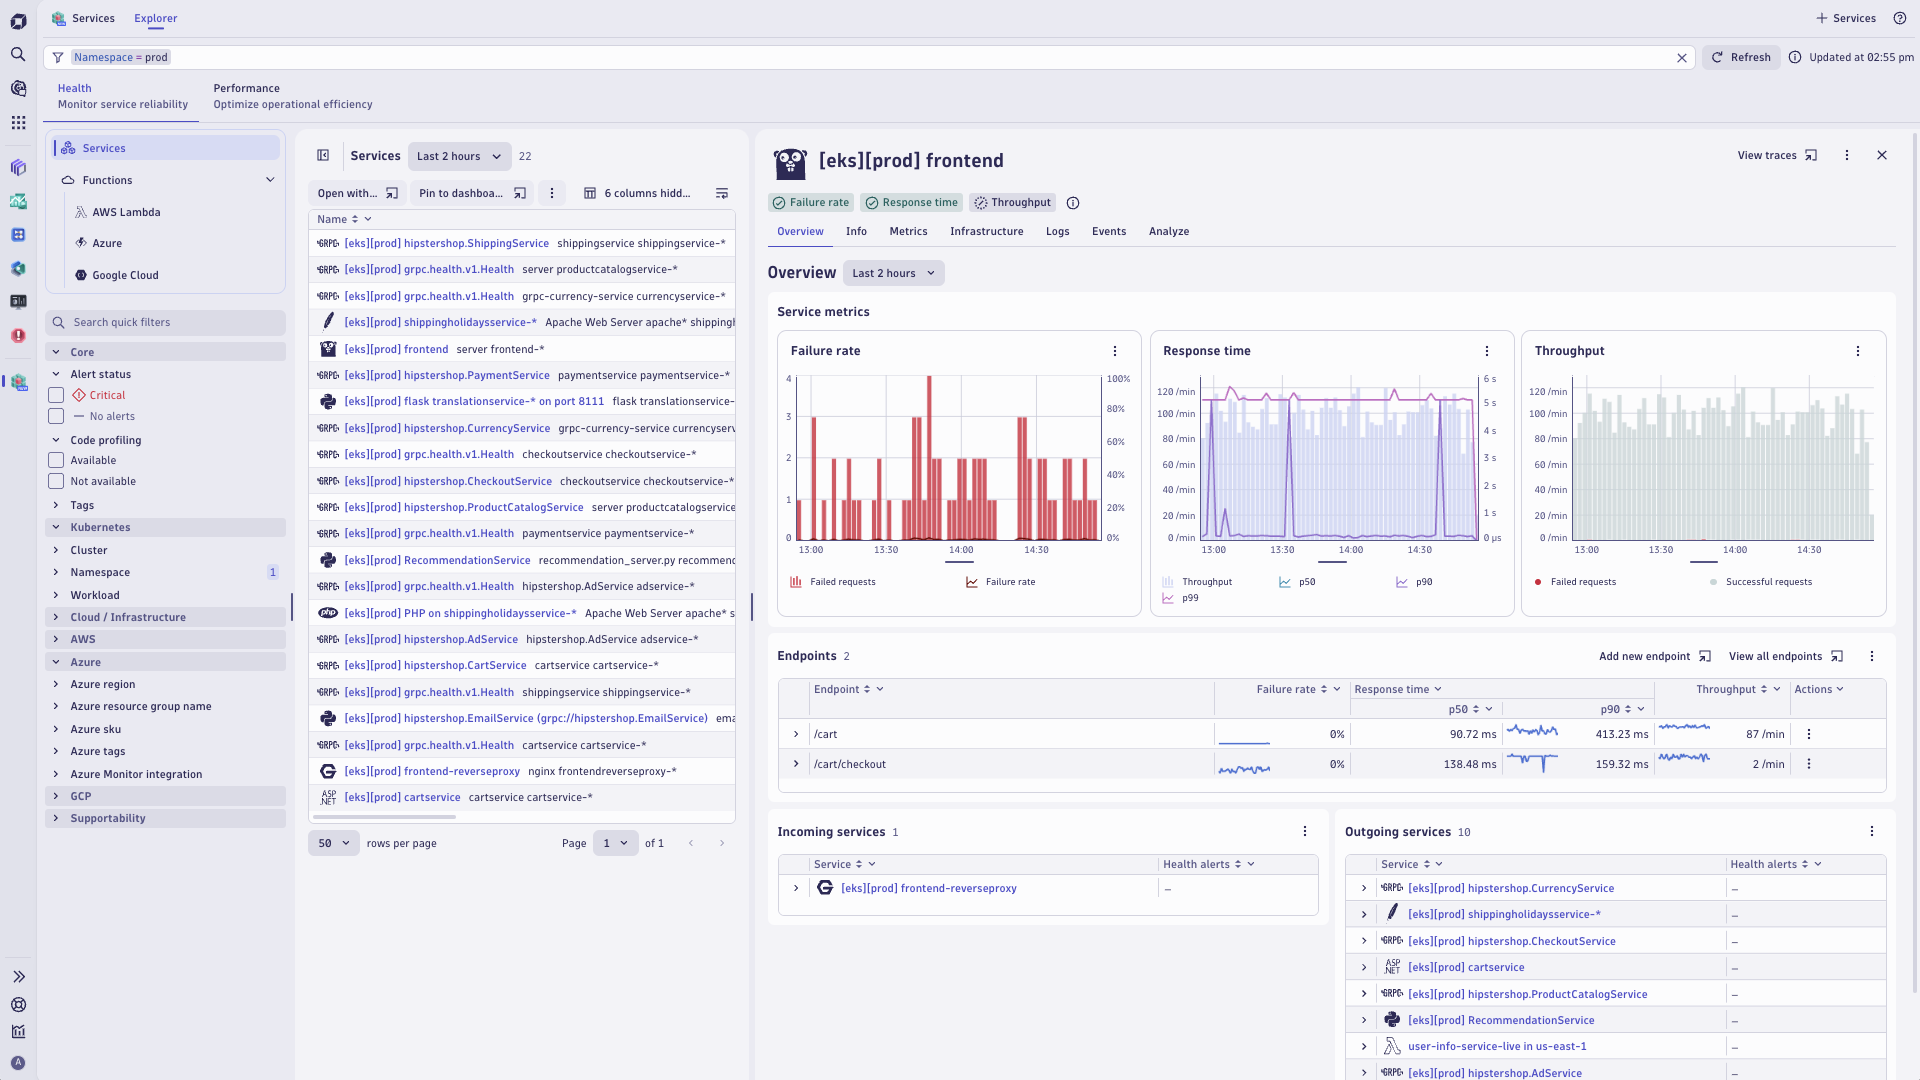
With the Services app you can view traces in an aggregated format, easily sift through problems, and ensure general services are functioning properly. A comprehensive view of trace data organized by services provides additional context.
When a problem arises, the Services app is an excellent tool for analysis. Davis® AI automatic root cause analysis highlights abnormal behaviors, such as increased failure rates at the /cart/checkout endpoint, in real time to accelerate the analysis process
Get started with the Distributed Tracing and Services apps
If you’re new to Dynatrace and want to try out the Distributed Tracing app, check out our free trial.
We’re rolling out this new functionality for our existing Dynatrace Platform Subscription (DPS) customers. As soon as the new Distributed Tracing Experience is available for your environment, you’ll see a teaser banner in your classic Distributed Traces app.
If you’re not yet a DPS customer, you can use the Dynatrace playground instead. You can even walk through the same example above. The new Services app is already available to all DPS and non-DPS customers.
This is just the beginning. stay tuned for more enhancements and features.
Make your voice heard after you’ve tried out this new experience. Provide feedback for Distributed Tracing in the Distributed Tracing feedback channel (Dynatrace Community). To share your feedback regarding the Services app, go to the Services feedback channel (Dynatrace Community).


Looking for answers?
Start a new discussion or ask for help in our Q&A forum.
Go to forum