Business transactions depend on the performance of applications. In modern applications built with microservices, decoupled services are common, and events are used to communicate between services, making it important for DevOps teams to have full observability into the performance of messaging systems.
Messaging systems can significantly improve the reliability, performance, and scalability of the communication processes between applications and services. An example of a critical event-based messaging service for many businesses is adding a product to a shopping cart.
In serverless and microservices architectures, messaging systems are often used to build asynchronous service-to-service communication. In traditional or hybrid IT environments, messaging systems are used to decouple heavyweight processing, buffer work, or smooth over spiky workloads. To know which services are impacted, DevOps teams need to know what’s happening with their messaging systems.
Seamless observability of messaging systems is critical for DevOps teams
Messaging systems are typically implemented as lightweight storage represented by queues or topics. This allows producer services to send messages to queues or topics and consumer services to receive them.
Because of this asynchronous behavior, the impact of messaging system-related anomalies on applications isn’t always evident. As a result, DevOps teams usually spend a significant amount of time troubleshooting anomalies, resulting in high MTTR and SLO violations.
Complete visibility into connected producer and consumer services
We’ve introduced brand-new analytics capabilities by building on top of existing features for messaging systems. Now, with technology-specific views, DevOps teams can see messaging system-related anomalies, which significantly simplifies troubleshooting efforts. One of our Preview customers summarized the new analytics capabilities as follows:
“The new analytics views for messaging systems will definitely change the way we troubleshoot asynchronous communication problems because now we have full visibility into connected producer and consumer services. This is great! With other products, we had to make guesses about the impacted services based solely on metrics”.
– DevOps Engineer, large healthcare company
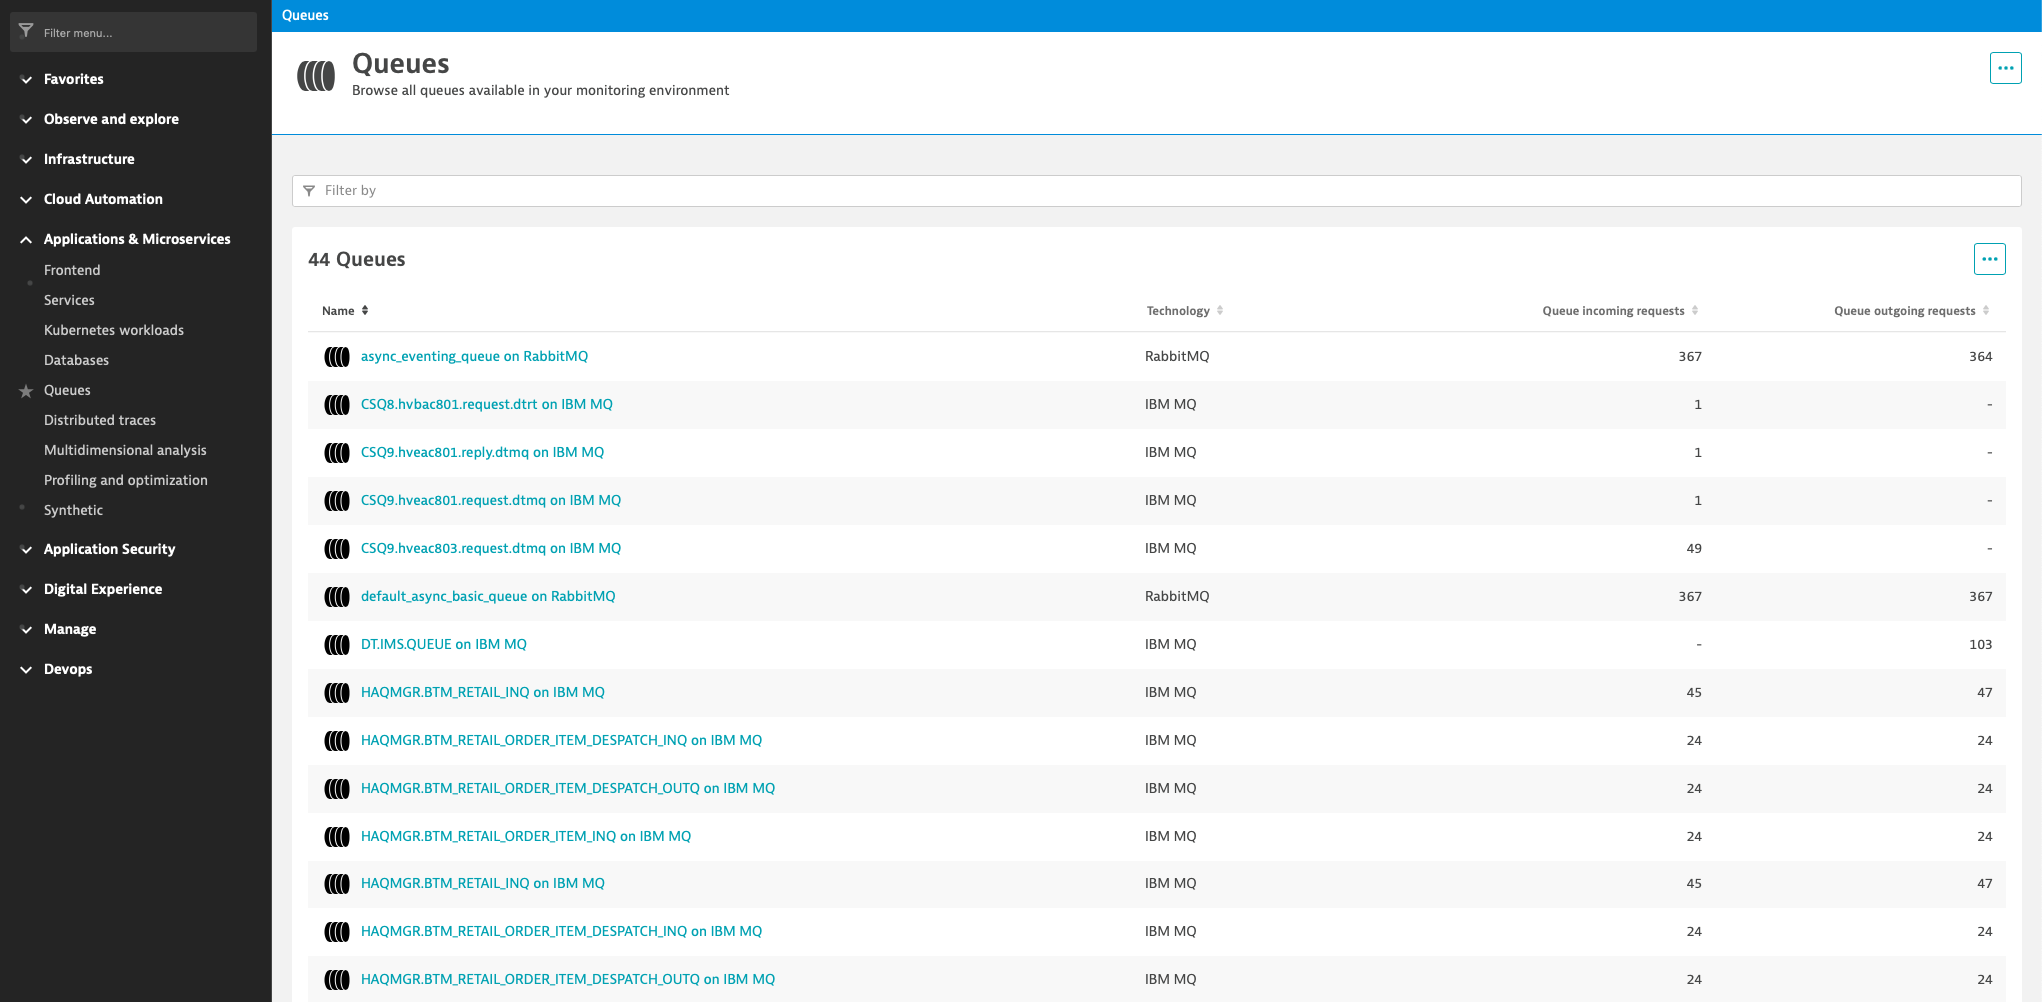
Your messaging systems at a glance with the new Queues list
With the release of Dynatrace 1.231, OneAgent detects queues and topics out of the box when they’re used in asynchronous communication processes, resulting in queue entities in Dynatrace. You can find all these entities by going to Applications & Microservices > Queues from the Dynatrace menu.

For all compatible technologies, OneAgent measures:
- The number of incoming requests on the queue or topic.
- The number of outgoing requests from the queue or topic.
By observing these metrics, you can easily catch unbalanced message processing that could result in severe problems such as queue overflows when producer services send significantly more messages to the queue than consumer services can process.
In such cases, DevOps teams must scale their queues quickly to prevent overflows or maintain failover processes so they can deal with queue outages and stay compliant with defined SLOs.
Easily troubleshoot anomalies with technology-specific views
While the Queues list provides an excellent overview, you need additional details to correctly troubleshoot different messaging systems with unique characteristics built for different use cases. Select a specific queue or topic in the Queues list to access such technology-specific views and details.
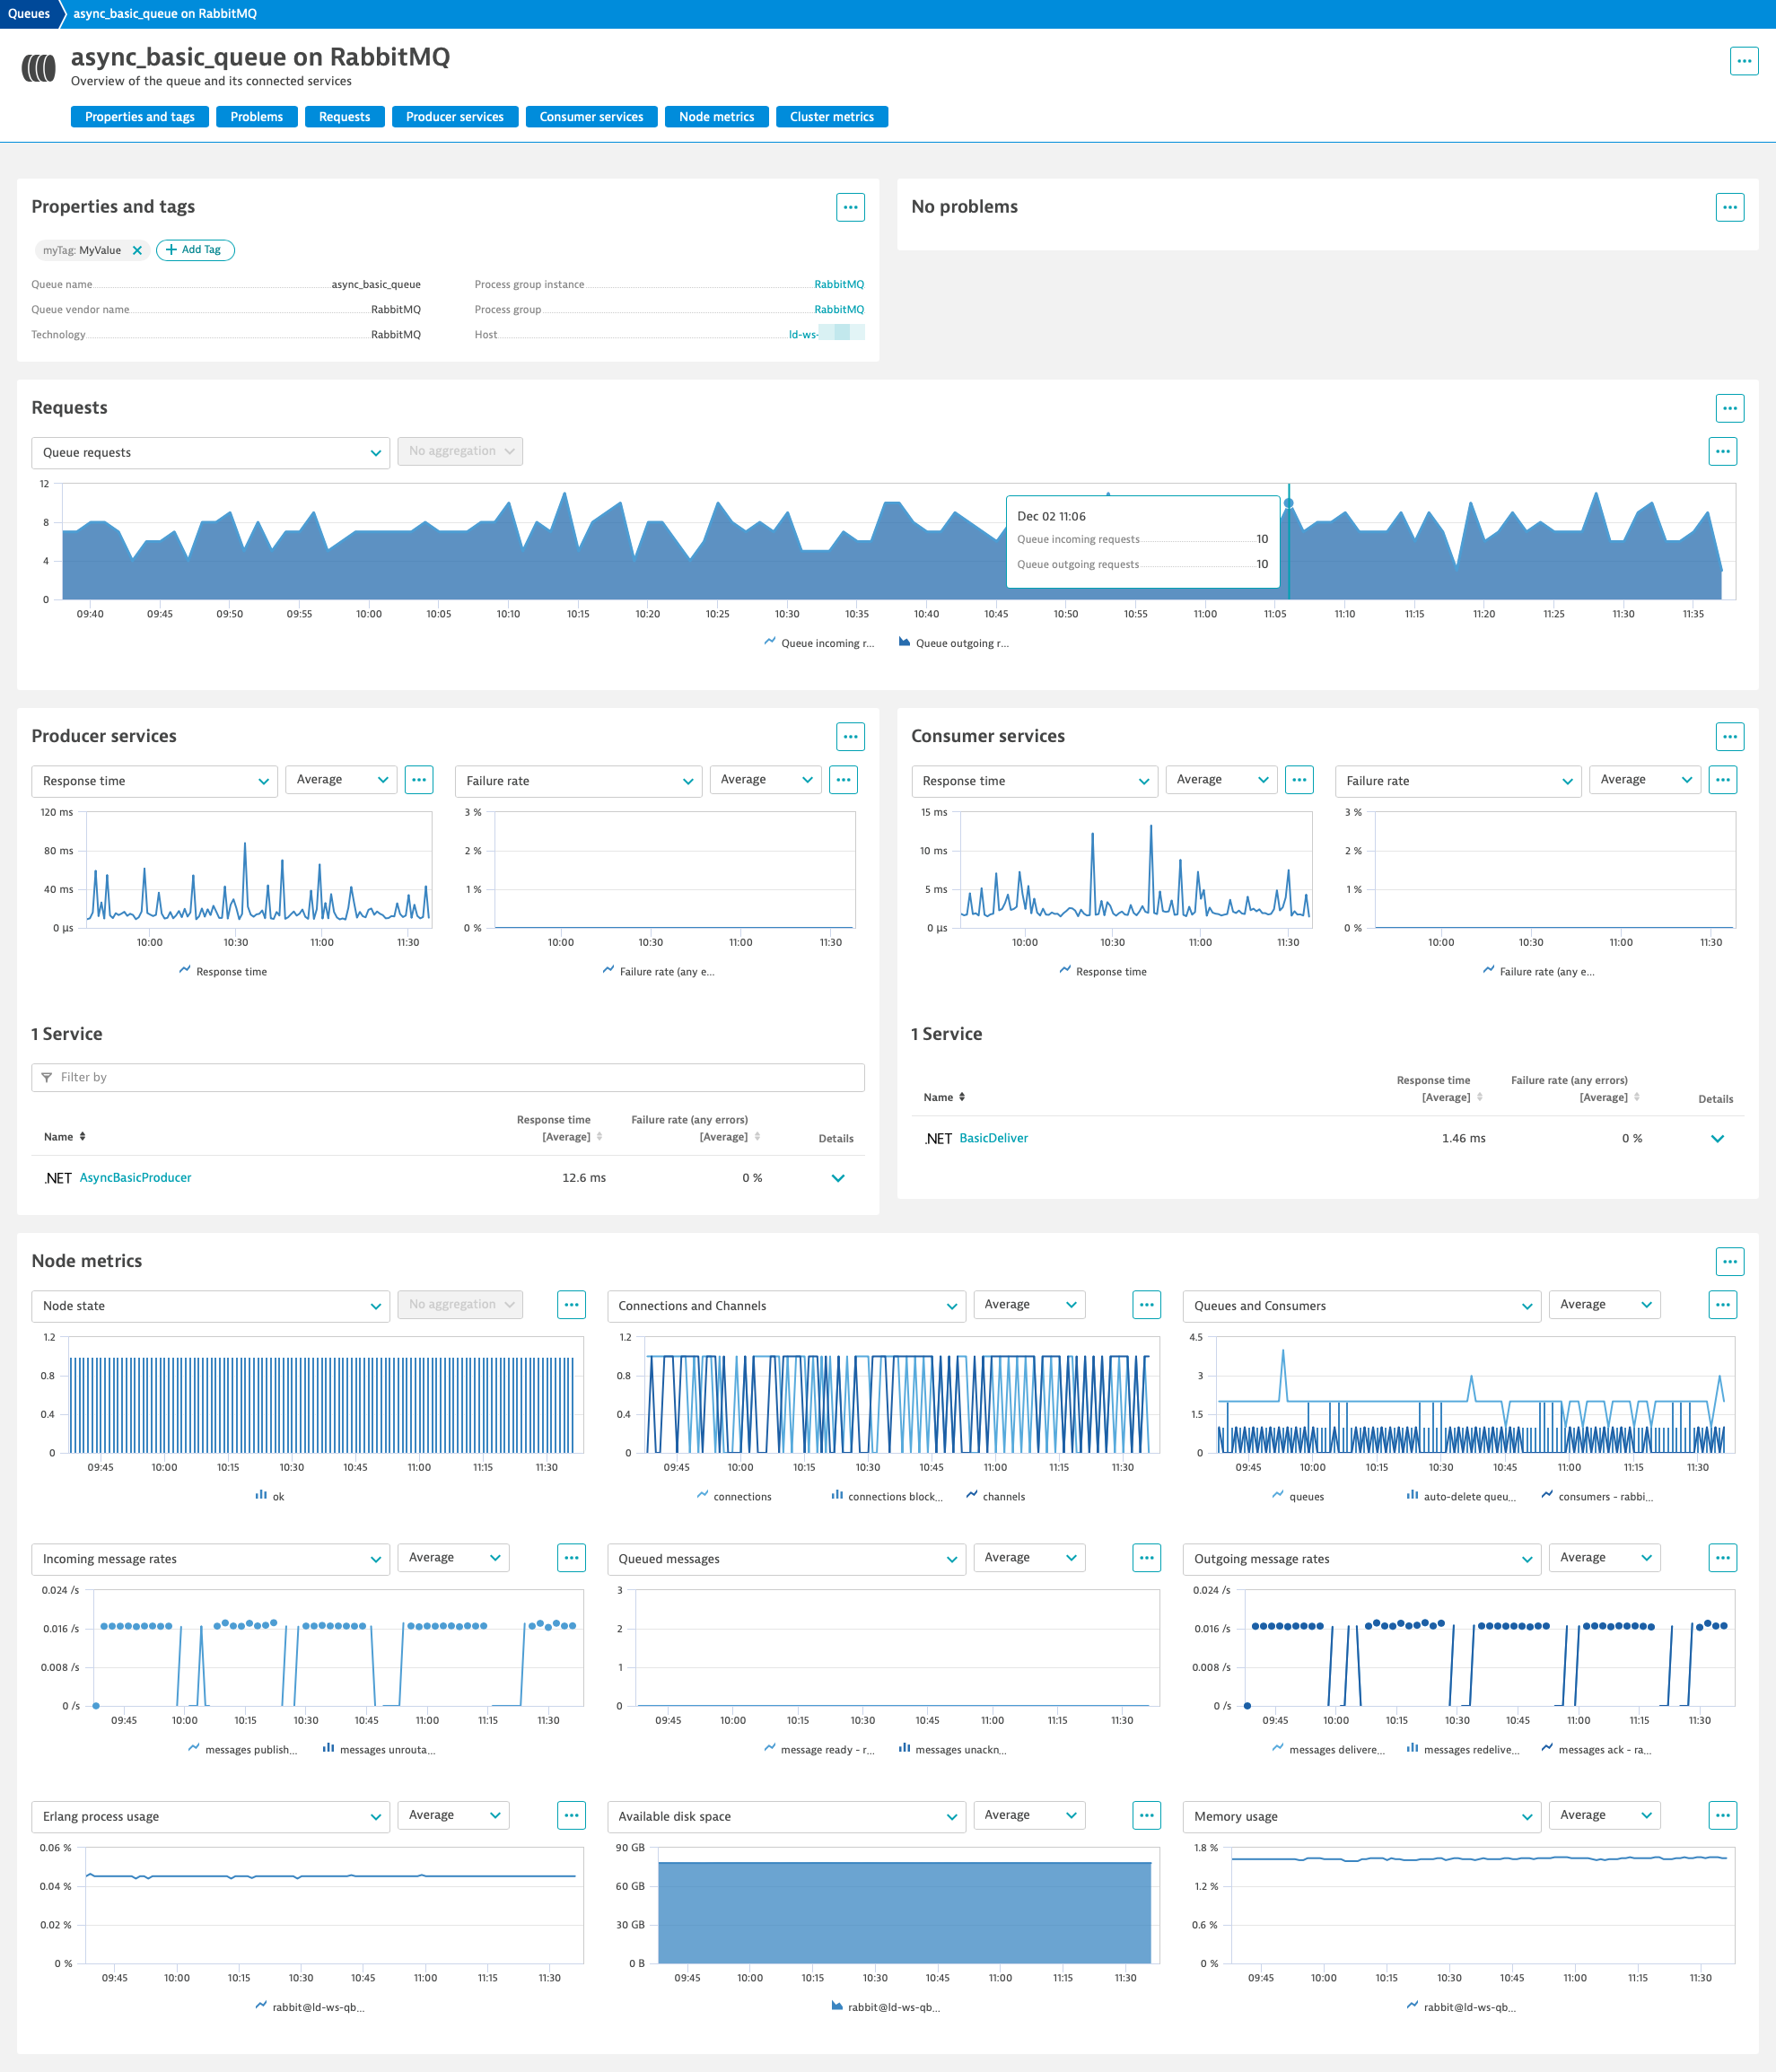
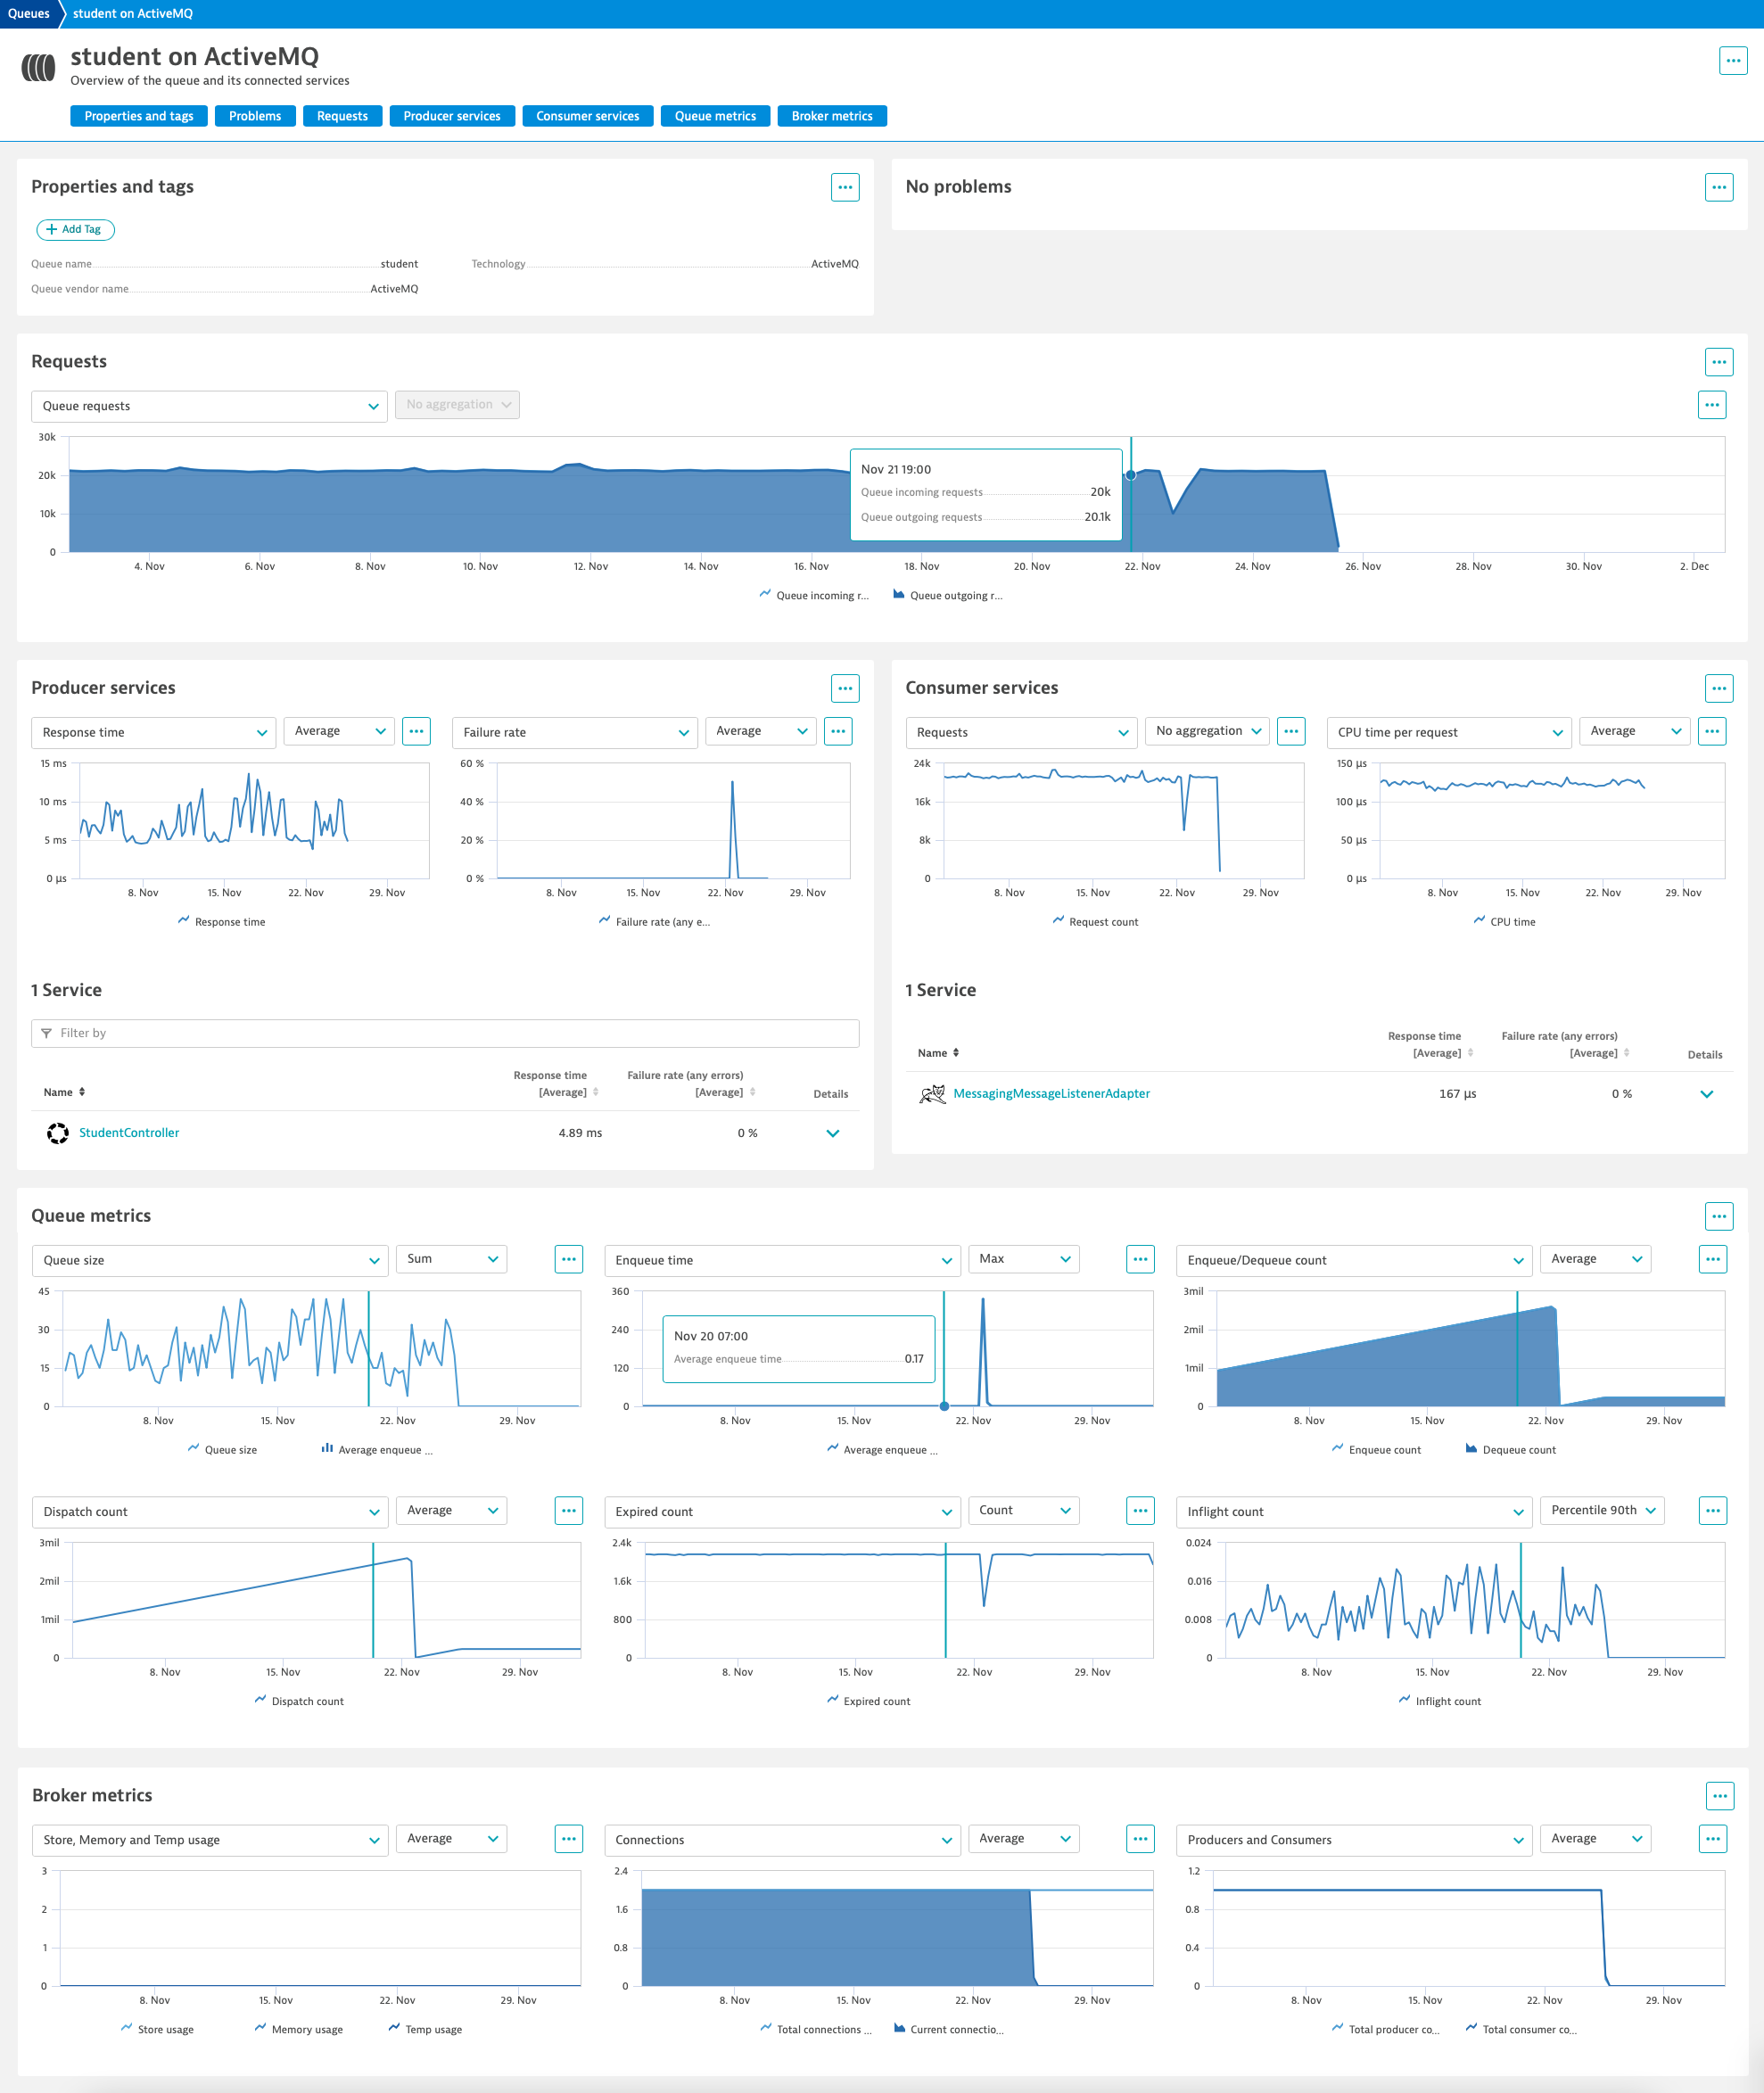
Dynatrace currently provides technology-specific views for ActiveMQ, Apache Kafka, IBM MQ, RabbitMQ, and TIBCO EMS. The RabbitMQ view, for example, provides metadata about the queue itself, the topological relationship to its process group and host, and information about related problems.
Most importantly, the RabbitMQ view provides insights about the connected producer and consumer services, allowing you to draw conclusions about the root cause of queue-related anomalies.

All producer and consumer services report metrics for their response time, failure rate, request count, and CPU time per request. The additional node and cluster metrics help you understand your entire RabbitMQ deployment, not just a specific queue.
You can easily switch between the available metrics as necessary, apply different aggregation functions, or define metric-specific alerts. To define an alert for any metric, select the More (…) button near the chart and then select Set alert.
The ActiveMQ-specific view complements service insights with various metrics about the queue and its broker to provide a holistic view of the ActiveMQ deployment.

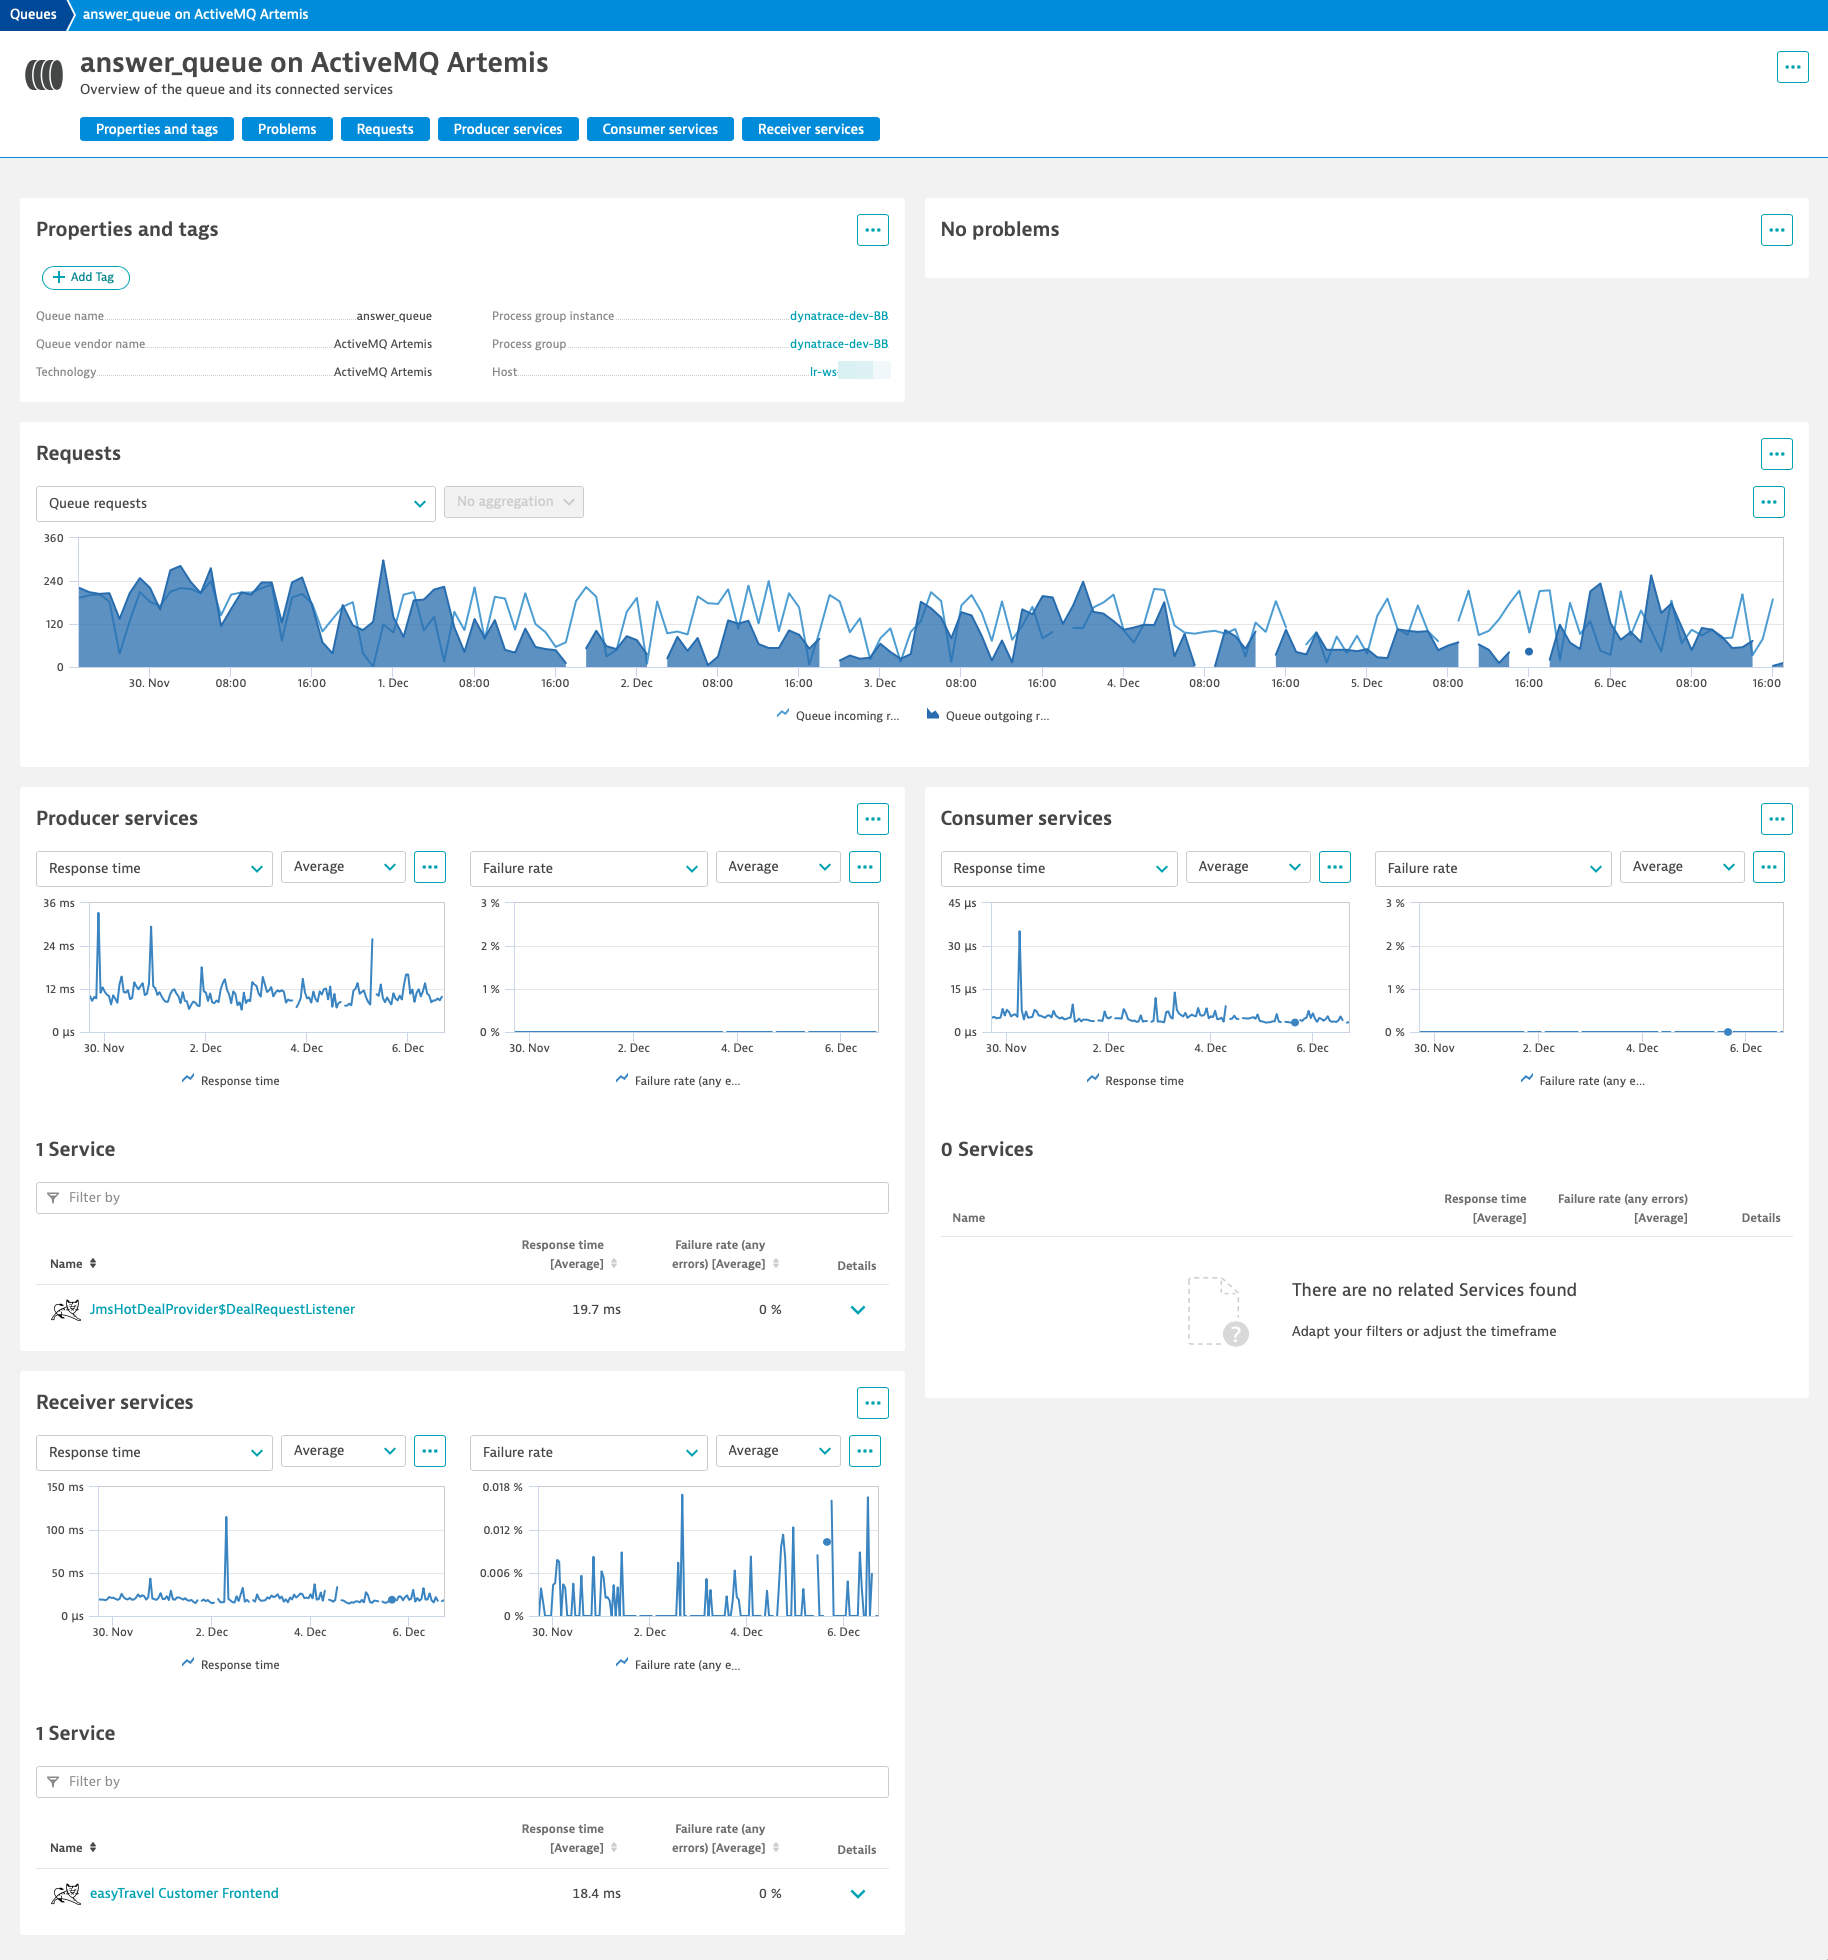
One of the concepts of the Java message service (JMS) is that a client can request the next message from a MessageConsumer synchronously by using one of its receive methods (for example, the client can poll or wait for the next message). Services that receive messages from a queue synchronously in a JMS-based application are summarized as Receiver services.
See the ActiveMQ Artemis example below, where the JMS-based application receives messages from the answer_queue.

How to get started
OneAgent version 1.231+ automatically detects message queues when a compatible messaging client is used. OneAgent extensions provide the technology-specific metrics. To get these metrics, you need to activate these extensions in your Dynatrace environment.
You can configure and activate the following extensions in Dynatrace at Settings > Monitoring > Monitored technologies > Supported technologies:
- ActiveMQ
- Apache Kafka
- Rabbit MQ
These OneAgent extensions first need to be downloaded from the Dynatrace Hub (Manage > Hub):
- TIBCO EMS
After downloading the extensions, go to Settings > Monitoring > Monitored technologies > Custom extensions in Dynatrace and upload them to your environment. Finally, you can configure and activate them there.
New to Dynatrace?
Start your free trial today for best-in-class APM, infrastructure monitoring, and AIOps, all in a single solution.


Looking for answers?
Start a new discussion or ask for help in our Q&A forum.
Go to forum