Dynatrace® extends Synthetic monitoring scope towards the network and transport layers of your tech stack with the introduction of new synthetic test types: ICMP Ping, TCP port check, and DNS—all under the umbrella of Network Availability Monitoring (NAM). Your teams get 24/7 insight into the health and availability of your infrastructure and network. Synthetic Monitoring also now provides basic information about the health of network services that aren’t based on HTTP(s) and, thus, were not targeted for synthetic testing in the past.
Current synthetic capabilities
Dynatrace Synthetic Monitoring is a powerful tool that provides insight into the health of your applications around the clock and as they’re perceived by your end users worldwide. As HTTP and browser monitors cover the application level of the ISO /OSI model, successful executions of synthetic tests indicate that availability and performance meet the expected thresholds of your entire technological stack. Combined with Dynatrace OneAgent®, you gain a precise view of the status of your systems at a glance. But is this all you need?
Why browser and HTTP monitors might not be sufficient
In modern IT environments, which are complex and dynamically changing, you often need deeper insights into the Transport or Network layers. Whether necessary as part of deep root-cause analyses of issues faced by your users that impact your business or if you’re an engineer responsible for the infrastructure hosting your applications and network paths. You want to be able to answer questions like these:
- What is responsible for application slowdown? Is it a bug in the codebase, a malfunctioning backend service, an overloaded hosting infrastructure, or perhaps a misconfigured network?
- Are all network devices up and running, and is the network providing reliable and swift access to your systems?
- Do I have reliable and up-to-date info on the health of services that are not HTTPS-based but are still crucial elements of your business-critical systems?
- Are the hosts on which OneAgent can’t be deployed for technical reasons (for example, a legacy OS) or security-related reasons (for example, systems processing financial information and third party vendors) up and running? Are the corresponding services running on those hosts?
“ICMP ping tests in NAM are highly valuable and complement the overall value provided by the Dynatrace platform. They enable effective monitoring for devices where OA (OneAgent) cannot be applied due to technical or policy constraints.”
Robert Jędrzejewski– Senior Project Manager, BNP Paribas Bank Polska Spółka Akcyjna
How Dynatrace addresses these questions
Traditionally, Dynatrace provides powerful Platform extensions, which might answer all the above questions. However, those solutions have certain limitations:
- They are not scalable as a pure synthetic solution powered by an API for quickly defining and maintaining tests. Thus, covering an infrastructure the size of several thousand hosts, which is not unusual in modern enterprises, might be significantly challenging.
- Even though these issues were addressed with Extensions Framework 2.0, Synthetic Monitoring still boasts its own advantages with the combination of NAM and HTTP/Browser tests from the same location as well as higher capacity ActiveGates.
To help you enjoy a new and more powerful solution, we’re launching a tool that facilitates the automatic transformation of your existing extensions based on EF1.0 into NAM test definitions. Our script, available on GitHub, provides details.
Why Dynatrace NAM is the solution you need
Ease of deployment and management
Synthetic NAM monitors are executed from the same private locations used for monitoring your internal applications with HTTP and browser monitors. This guarantees oversight into high availability, as test executions are load-balanced between nodes hosting private locations.
Also, the API can be used to manage tests at scale, the same way you might use APIs to manage all other synthetic tests. This simplifies solution deployment (as it is available for current DT synthetic users) and managing tests covering a massive number of devices or services.
Test customization
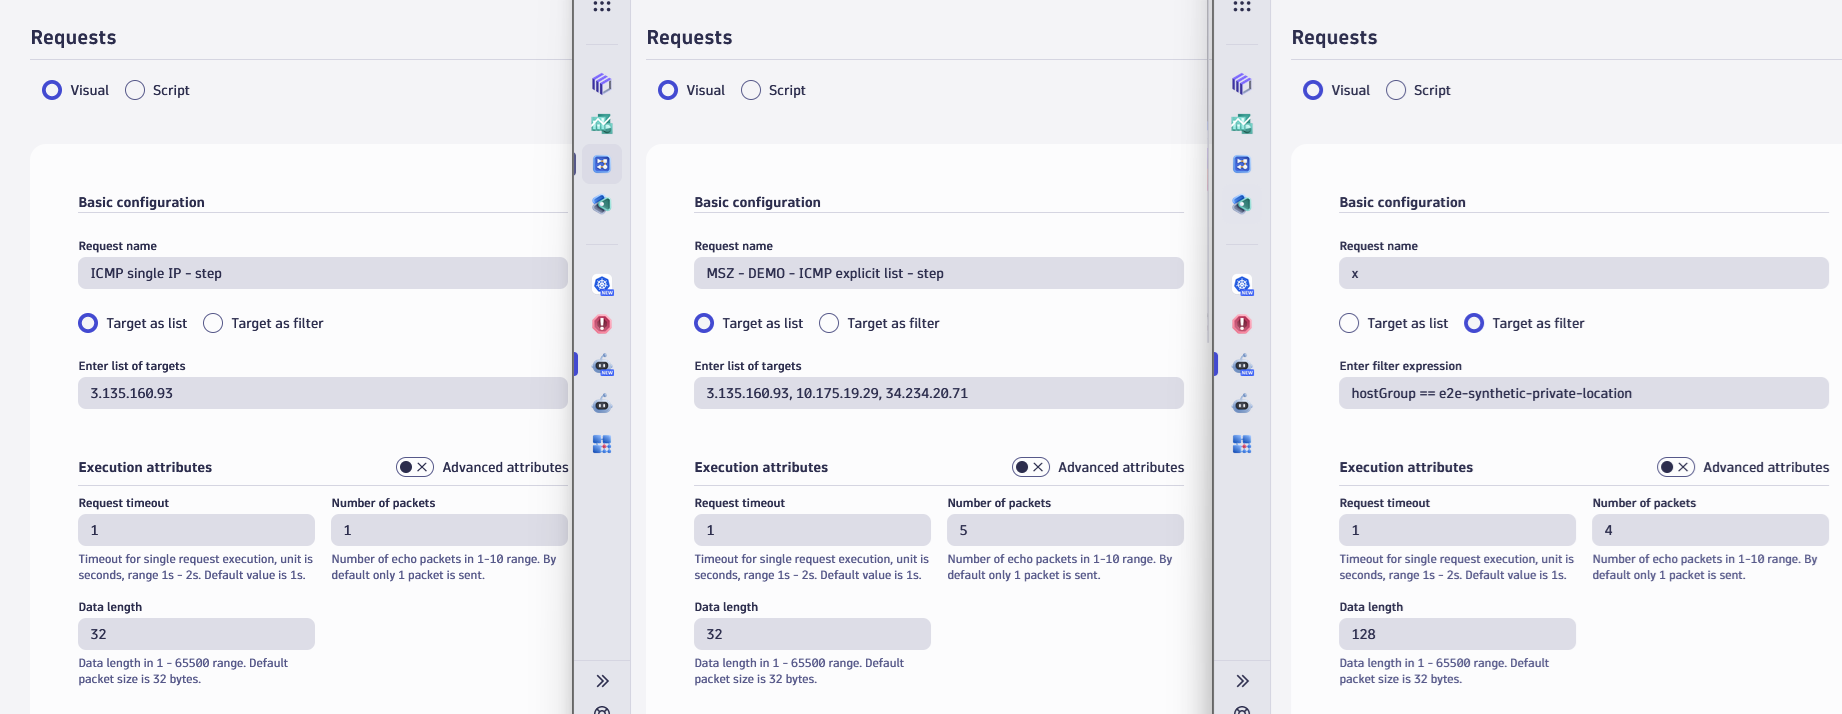
Even though ICMP pings are not the most sophisticated tests, certain customization options can help tailor tests to your needs. For example, you may select the number of packets sent during each execution of the test (to mitigate the risk of temporary anomalies in the network that could impact your test result) and packet size (for example, to ensure that the given MTU is defined on the whole network path).
Of course, it is also possible to define the required success rate of ICMP packets for each test execution against a given IP address to determine if a test is successful.
Compared to other solutions I have tested, Dynatrace NAM monitors are the most configurable which is to my liking. We are already using three or more packets within all of my ping tests and see customized packets size as a valuable option for the future.
Observability Lead, Ivy League University
Similarly, you can adjust your TCP port check tests to validate if selected ports are not opened or closed as intended. Sometimes, the desired state of a port is not to accept connections. You might want to use a port to validate if security settings are properly applied and if ports that are supposed to be closed are closed.
Easier test management and integration with infrastructure monitoring tools
A single NAM test can cover one host (for ping) or socket (for TCP port check); however, you can make your life easier by creating single tests covering multiple (up to 1k) hosts at once. Whether you aim to check all addresses from a given IP list with ping tests, you can succeed with a single test! Similarly, a single TCP test can check if connections are accepted on multiple ports of one or more hosts.
But we went one step further here. Dynatrace NAM stands above all other competitive offerings because you can define a single ICMP ping test covering all hosts within a given host group (optionally narrowing down the IP addresses to a given range). The beauty of this solution is that even if the configuration of the host group changes, the configuration of your synthetic test stays up to date with no extra action needed.

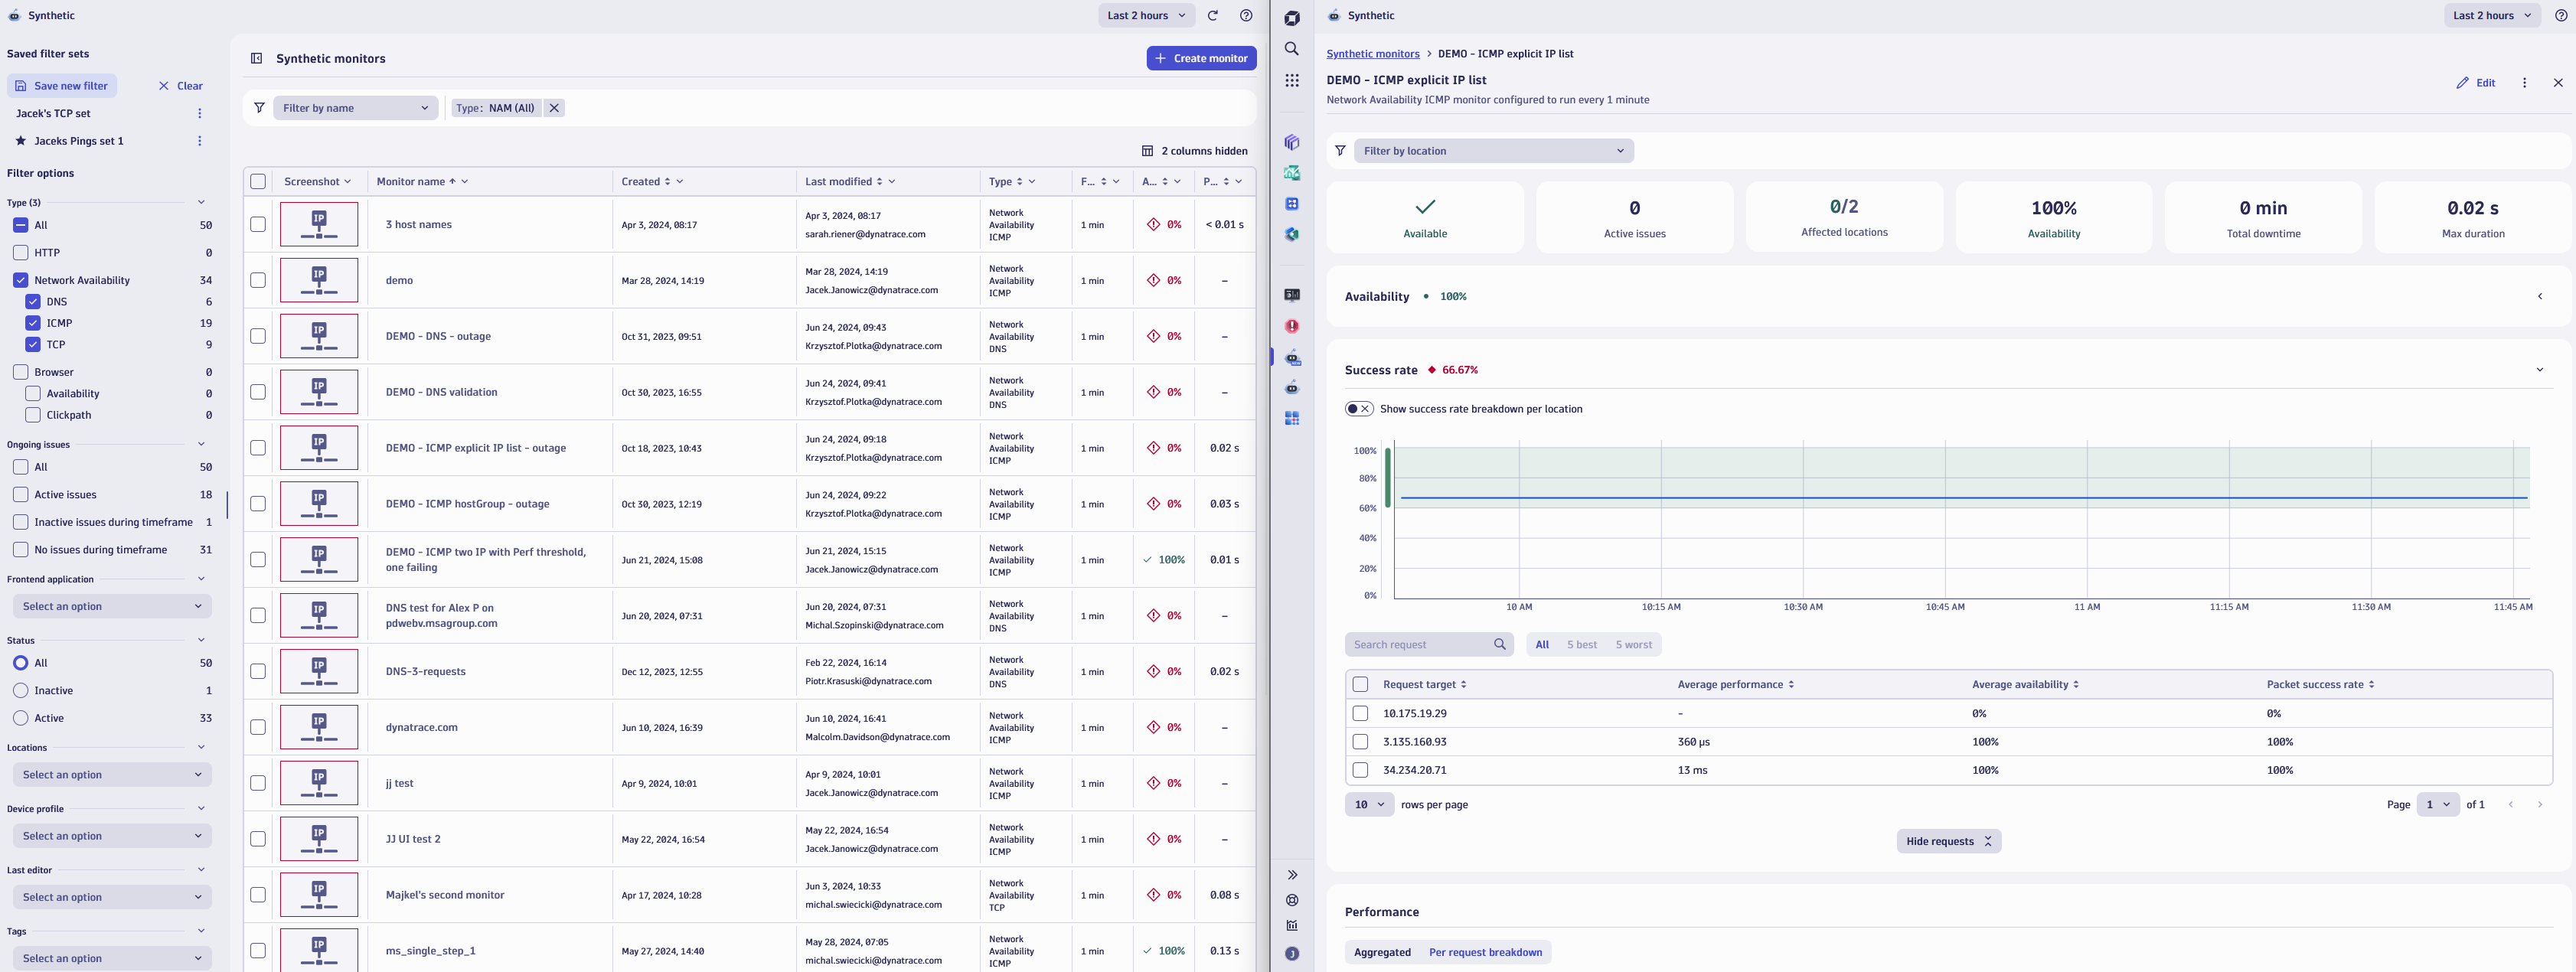
Of course, the reporting side is properly adjusted to handle such monitors. For each failed monitor and each problem triggered as a result of such a failure, you can easily identify which requests (IP addresses, sockets) are responsible for the failure and might require appropriate attention.
How NAM tests work
You can use the API or our new web UI (Dynatrace SaaS only) to create NAM tests.

The new Synthetic app covers the configuration and reporting of network availability monitors thanks to the power of Grail™ and the new Dynatrace platform.
NAM monitors are defined in a similar manner to other synthetic monitors. Apart from elements specific to the given type of test, such as:
- IP address and number of packets for ICMP ping
- Port number for TCP port check
- Names to be resolved and DNS server for DNS tests
All other elements (like assigning locations or conditions for triggering alerts) are the same as those used in other Synthetic monitors.

The reporting also looks similar; there are easy-to-understand charts indicating the availability and performance of the whole network availability monitor, as well as metrics providing an overall summary and links to currently opened problems.
For more complex network availability monitors covering multiple requests, you might like to look at the chart presenting the request success rate, which shows a list of all requests in the form of a table or a separate chart reporting executions of separate requests.

NAM is available for Dynatrace Managed users
While the new, Grail-powered Synthetic app is available only in Dynatrace SaaS environments, Dynatrace Managed users can also benefit from NAM. Dynatrace Managed users get:
- A powerful API for creating and managing synthetic tests (the same as for Dynatrace SaaS users).
- A set of metrics allowing query results with Data Explorer and creating advanced reporting using Dynatrace Dashboards.
- Basic reporting, available out of the box, provides insight into values of the most important metrics describing the execution of all monitors and indicating which requests might be a reason for failures or slowdowns.

Next steps
- Get familiar with the new Synthetic app! It currently fully supports NAM monitors, but a preview of HTTP monitors will start soon.
- Find out how Synthetic NAM monitoring affects your billing on DPS and classic.
- Expect an easy way of integrating NAM monitors with network devices monitored within the IO app (coming soon).
- Configure NAM monitors directly from the Discovery and Coverage app (coming soon).
Check out our Dynatrace NAM documentation to learn more about its functionality and how to use it to address your use cases.


Looking for answers?
Start a new discussion or ask for help in our Q&A forum.
Go to forum