
AWS monitoring
Built for cloud-first and hybrid deployments, our AI-powered observability, analytics, and security platform provides end-to-end visibility and helps you comply with AWS's Well-Architected Framework.

Level up your observability with
Dynatrace
-
Complement Cloudwatch
Leverage code-level application and business insights, and augment with AI-driven anomaly detection, root cause analysis, session replay and low-code answer driven remediation
-
Master Well-Architected Framework
Build reliant and high-performing architectures, mastering the six pillars of the AWS framework for business agility.
-
Unified UI and data observability for hybrid and cloud
A one-stop shop for all your observability needs, whether you're using modern hybrid, multicloud, or traditional infrastructure and application architectures.
Platform compliance certifications

Reduce MTTR with AI-powered intelligence
- Auto-baselining: Learn thresholds of your AWS services health without needing to manage an AI/ML scientists team. It’s all out of the box.
- Auto-root cause analysis: Resolve your incidents faster with no-config Davis AI pinpointing problems and associated business impact.
- Auto-alerting: No more manual alerting for common AWS EKS errors. Dynatrace is highly technology-aware and can alert SREs to problems without having to define alerts manually.
- Predictive analytics: Leverage Davis AI's predictive analytics to identify traffic anomalies through seasonal pattern detection, assess potential business impacts, and effectively scale your AWS services.
Accelerate your AWS cloud migration
Plan and migrate
- Dynatrace OneAgent: Get full stack visibility across your AWS public cloud, AWS Outposts, and traditional data centers with with easy setup steps, no matter where your applications are running.
- Auto-instrumentation: Dynatrace uniquely supports all technologies, from mainframe to cloud. It automatically instruments system components without any configuration or code changes, collecting metrics, logs, traces, and user experience signals.
- Auto-discovery: OneAgent gives instant, real-time visibility into how your IT landscape is interconnected with Smartscape.
Operate
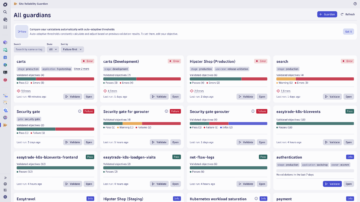
- Built in SLO Management: Define SLOs and enforce software release decisions using change-impact data analysis with Dynatrace Site Reliability Guardian. Gain actionable insights through causal AI-based exploratory analytics powered by Dynatrace Notebooks.
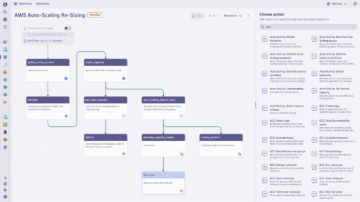
- Auto-remediation with closed loop: Leverage Dynatrace AI-powered root cause analysis and rollback your deployments or features with automated workflows.
Innovate faster by following AWS Well-Architected Framework
- Operational Excellence: Gain full visibility into your AWS applications, detect problems proactively, and create faster development cycles with prescriptive recommendations from Davis AI.
- Security: Leverage Dynatrace security protection to shield against known and unknown vulnerabilities. Use security analytics for advanced threat detection and remediation.
- Reliability: Enrich your chaos engineering, resiliency and reliability testing with AI-powered, real-time analytics and automation for observability and security.
- Performance Efficiency: Govern with data-driven decisions using Dynatrace’s AWS cloud application, which offers a singular, comprehensive view of your AWS resources or hybrid cloud environment.
- Cost Optimization: Gain control over cloud costs with powerful insights of AWS resource utilization with Dynatrace Grail platform.
- Sustainability: Dynatrace Carbon Impact enables you to calculate and plan your AWS carbon footprint for your carbon reduction initiatives or regulatory compliance.
Excel with DevSecOps
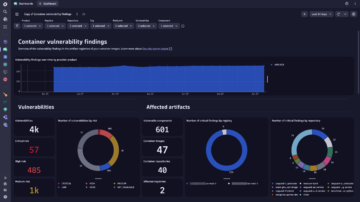
- App Security: Detect code-level vulnerabilities across AWS IaaS and PaaS services, with Davis AI prioritizing.
- Security Analytics: Conduct proactive threat hunts and gain confidence in your application security defenses.
- Runtime application protection: Detect malicious activity within your applications and block it with confidence without affecting real users.
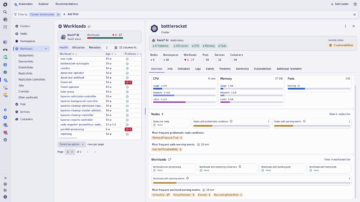
- Visibility of AWS resource utilization: Govern your cloud resources with smart filters and contextualized logs and metrics data in the context of problems.


Dynatrace is proud to be an Advanced Technology Partner
As an AWS Service Ready Partner, AWS recommends Dynatrace to AWS customers based on technical validation by AWS Partner Solution Architects who reviewed product availability and architecture for the following services:
AWS competencies


Sign up for AWS monitoring today!
You’ll be up and running in under 5 minutes:
Sign up, deploy our agent and get unmatched insights out-of-the-box.
