With the advent of OpenTelemetry – supported by Dynatrace in PurePath 4 - we are shifting left the control over observability to developers. However, developers often still lack the control over how the monitoring platform itself is behaving as it consumes observability. As developers gain responsibilities through practices such as GitOps and SRE, their ability to configure observability – and keep it up to date with evolving requirements – becomes a cornerstone for successful organizations. Configurations such as SLIs (Service Level Indicators), SLOs (Service Level Objectives), dashboards and alerting rules are left to be created separately, and often manually.
Recently, Dynatrace added OpenTelemetry support to its PurePath 4 technology, which is its fourth and latest generation of automatic and intelligent distributed tracing. Dynatrace’s OneAgent automatically captures PurePaths and analyzes transactions end-to-end across every tier of your application technology stack with no code changes, from the browser all the way down to the code and database level. The addition of OpenTelemetry is especially helpful for organizations looking at embedding OpenTelemetry into their applications as their data will automatically enrich PurePath’s distributed trace data.
While this standard is an amazing leap forward to giving developers control over observability, they are often still not able to control how the observability platform itself is behaving. As developers gain responsibilities through practices such as GitOps and SRE, their ability to configure observability – and keep it up to date with evolving requirements – becomes a cornerstone for successful organizations. Configurations such as dashboards, alerting rules and Service Level Objective definitions are left to be created separately, and often manually.
Anything becomes harder to do at scale when it’s done manually. It takes more time to do, large efforts need to be undertaken to guarantee a consistent result, and it generally ends up costing a lot more to do. Automation gives us the ability to create a predictable level of quality at scale with limited resources.
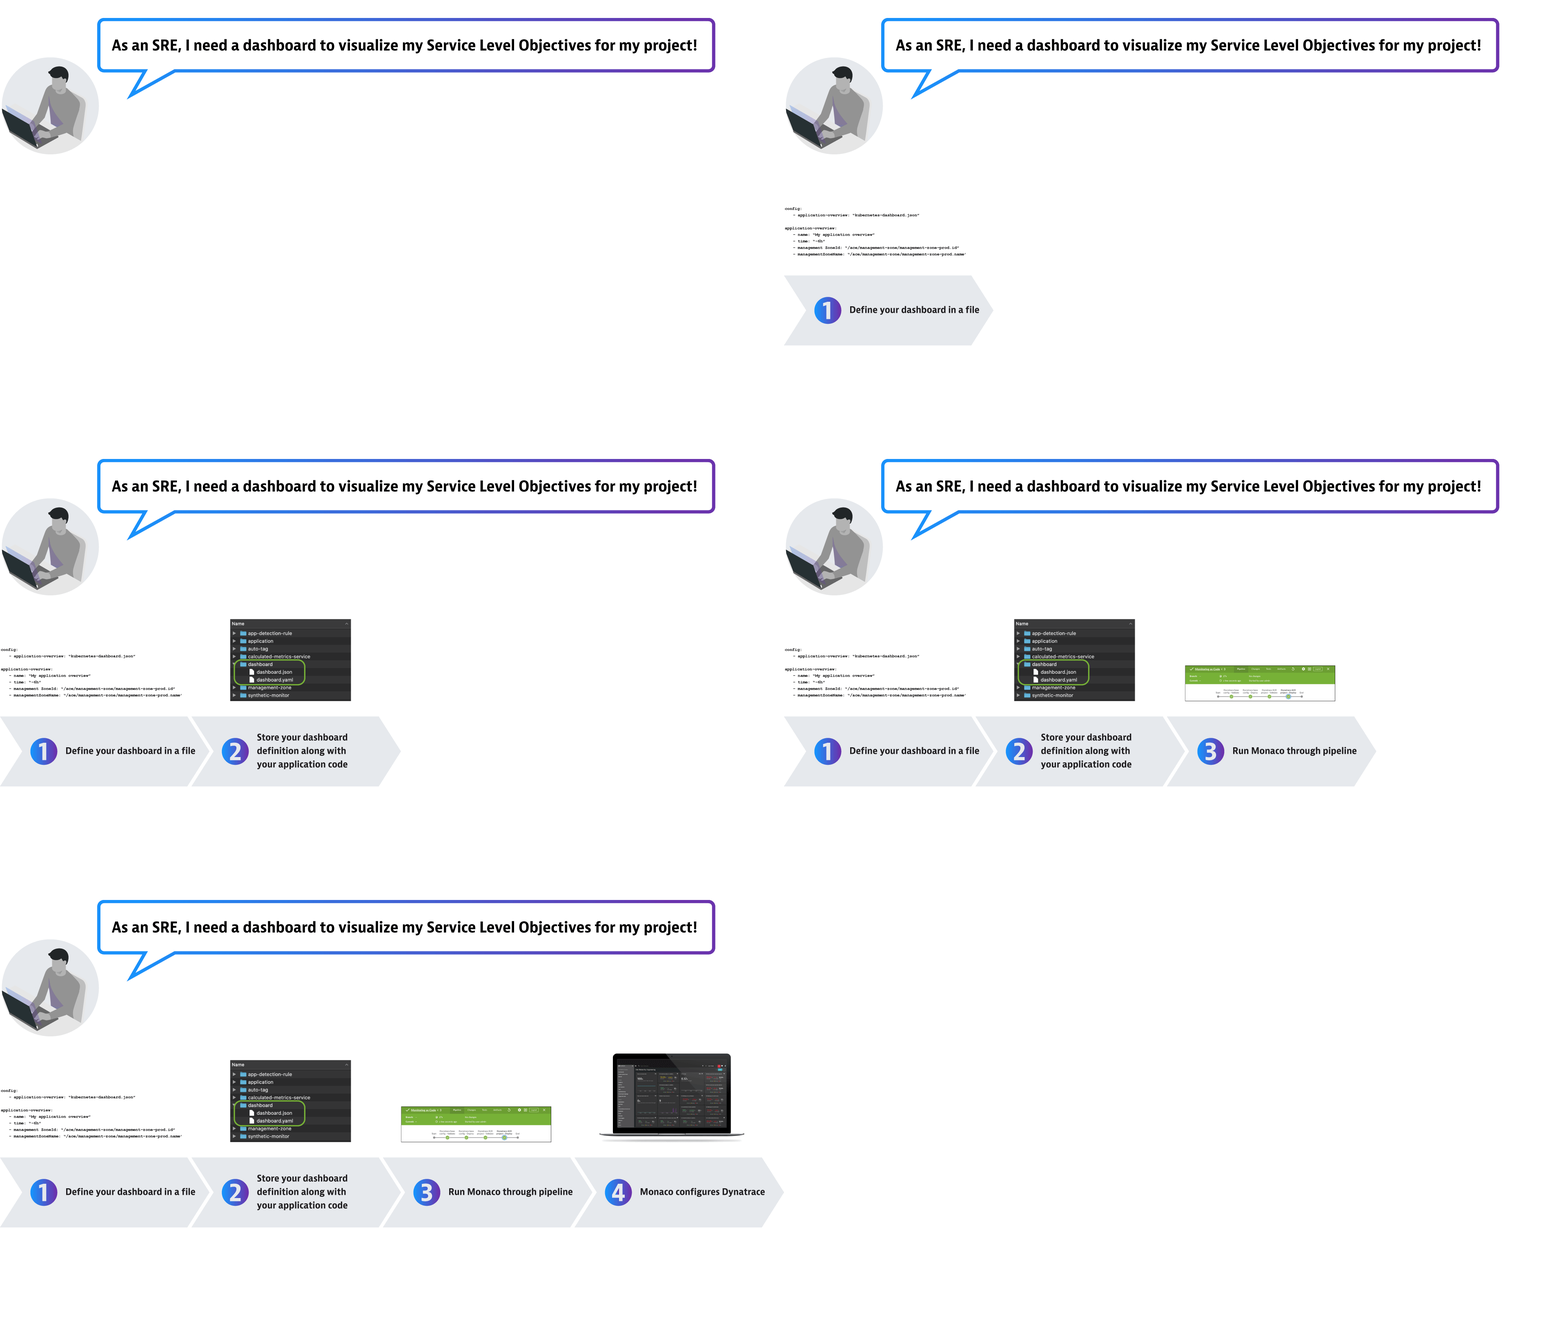
Configuring monitoring and observability is no stranger to that paradigm and it was also highlighted in the latest State of DevOps 2020 report. Based on that report successful organizations enable Application Teams through self-service capabilities to setup and configure Monitoring and Alerting without causing manual work on the team responsible for monitoring. Defining what to monitor and what to be alerted on must be as easy for developers as checking in a monitoring configuration file into version control along with the application’s source code. With the next commit or Pull Request their code gets built, deployed, and they automatically get their monitoring dashboards and alerting notifications. This self-service model will ensure that your developers can focus more time on building business services. They will adopt your monitoring self-service platform instead of building a custom monitoring solution that fits into their development process and mindset.

Besides providing monitoring as a self-service to your application teams, the general increase in adoption of Dynatrace within your organization will require you to automate the process of onboarding teams, applications and entire environments. Combining the power of automation with version-controlled configurations lands us at GitOps – you describe the configuration of your system as a set of files that you process and apply in an environment.
This will make your life easier when scaling monitoring in your organization as well as it increases productivity of your application teams as you fit right into their existing processes.
Monitoring-as-code requirements at Dynatrace
At Dynatrace we’re no different when it comes to our requirements for monitoring. We like to drink our own champagne and use Dynatrace to monitor thousands of environments and supporting applications which created a need to streamline the configuration process:
- Having the ability to templatize our configuration for reusability across multiple environments
- Interdependencies between configurations should be handled without keeping track of unique identifiers
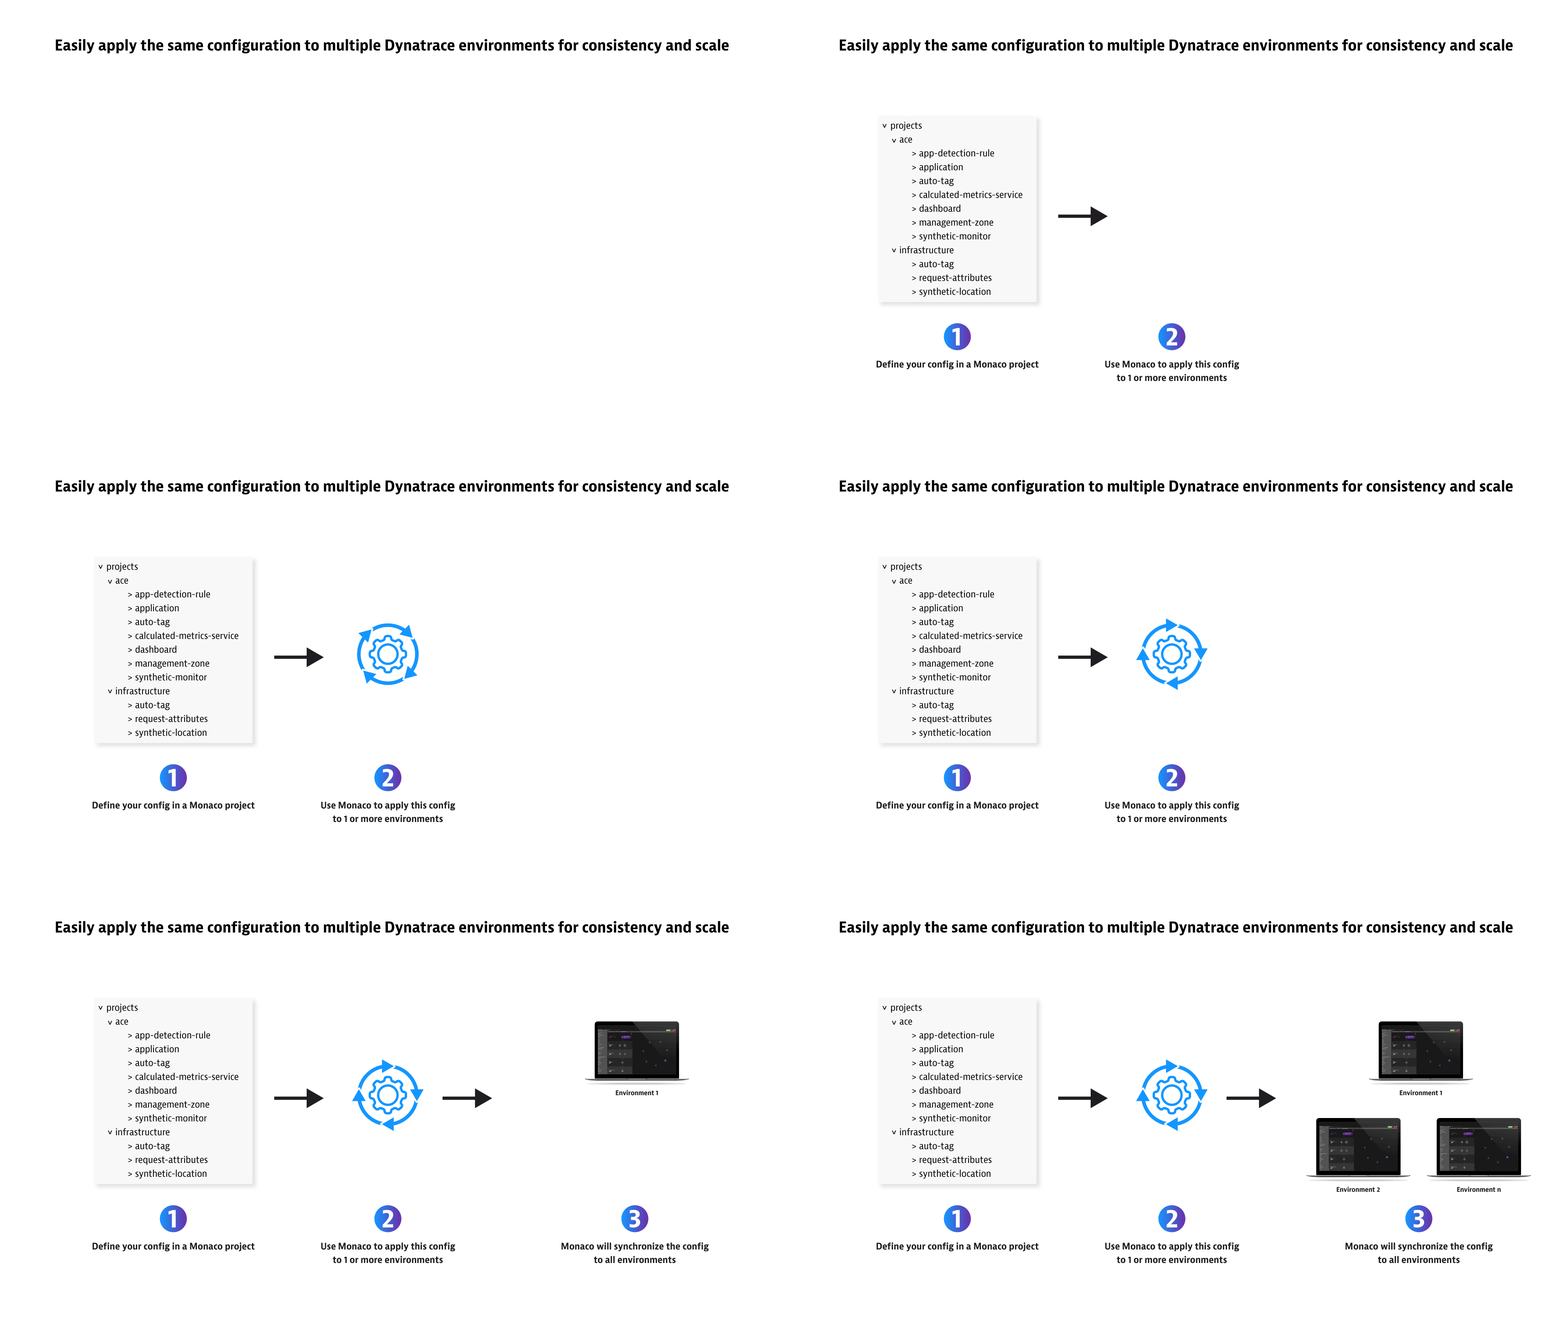
- Introducing the capability to easily apply – and update – the same configuration to hundreds of Dynatrace environments as well as being able to roll out to specific environments
- Identify an easy way to promote application specific configurations from one environment to another – following their deployments from development, to hardening to production.
- Support all the mechanisms and best-practices of git-based workflows such as pull requests, merging and approvals
- Configurations should be easily promoted from one environment to another following their deployment from development to hardening to production
Dynatrace monitoring-as-code allows us to do just that – and what started around one year ago in a ‘Minimal Viable Product’ approach to cover our internal needs, is now available to all our customers as Open Source on GitHub.
Let’s look at how monitoring–as-code Tool (Monaco) fulfills these requirements:
- Monaco speaks JSON
Simply placing a JSON object returned by our API into the right folder structure and adding a YAML config file, enables you to use the tool to setup that configuration on a Dynatrace environment – or thousands of environments. - Configuration as templates
The ability to ‘reuse anything’ as much as possible is a key requirement. For the same reason application developers create libraries for re-usable functionalities, we also see certain configurations coming back with different parameters. We might have a synthetic test template for a particular application which needs to be deployed in dev, staging and production. By reusing the same test template with different values for the endpoint, we massively reduce the effort to create and maintain these tests. - Referencing other configurations by name
Identifiers are great! They allow us to easily create a primary key of a configuration that is unique in the system. Unfortunately, if these get auto generated – which they are in most cases – they are hard to keep track of and reuse in other configurations. So, when we want to use a particular management zone in a dashboard, we wouldn’t want to have to look up that Management zone ID to reference it in our configuration as code. Monaco resolves this by giving you the ability to reference other configurations by name. Monaco will then look up the matching configuration using the Dynatrace API and provide the correct ID. Oh, and in case configurations depend on other configurations, Monaco will figure out in which order to deploy them automatically, to ensure all configs exist when they are needed. Piece of cake! - A GitOps approach to observability
Relying on JSON and YAML files for configuration allows for monitoring configuration to put under version control and changes to be reviewed and approved in the same way as code pull request. Using such versioned configuration, Monaco can be run as part of CI/CD pipelines to ensure the right monitoring setup for any new deployment of the applications you’re monitoring.
This is how we use Monaco, git and a CI/CD pipeline at Dynatrace:
- We have one repository that contains all our “main” configuration that needs to be applied to hundreds of environments.
- Each time we need to make a change – e.g., add a new management zone – we create a new branch in this repository and create and test the new configuration.
- When development and testing is done, a pull request is created to merge this new configuration into the main branch. This is then peer-reviewed for quality.
- Once approved and merged, a pipeline kicks in that applies the configuration to all defined environments.

As a Dynatrace user, you can now benefit from a tried and tested framework that our own teams depend on day-to-day to manage thousands of environments and start offering Dynatrace Monitoring as a Service (MaaS) to your teams!
Dynatrace MaaS is an integral part of adopting Autonomous Cloud Enablement best practices, where we look at automating everything with, and around, Dynatrace. From integrating observability with your business processes for automated application onboarding to intelligent quality gates to automate a promotional flow and automated incident remediation to instantly shield your users from an introduced regression; ACE practices are there to allow you to release better quality software faster and more frequently while guaranteeing quality downstream. Want to learn more? Please reach out to us via ace@dynatrace.com!
Monaco provides monitoring-as-a-service
Another use case already implemented by customers is automated application onboarding, delivering monitoring-as-a-service for private and public clouds. For instance, Zurich Insurance Company, applied this approach through Azure DevOps. As an application team, they needed a standard set of configurations that are consistent across the entire application landscape. For this, they created a form where they fill data such as business unit, application name, application URL, etc. An Azure Logic App takes this information and drives an approval workflow that triggers an Azure DevOps pipeline, which uses the application parameters to configure the Dynatrace environment using Monaco.
“Using Monaco, we are now able to offer true application monitoring as a self-service to our users and has our application onboarding in a few minutes instead of hours, reducing human dependencies.” Juan Antonio Conde, Global Service Owner for Application Monitoring, Zurich Insurance Company Ltd.
With this, they have built a streamlined automated application monitoring onboarding process that is reusable for all teams and applications. True monitoring-as-a-service. According to Juan Antonio Conde from Zurich, they were able to reduce application onboarding time from hours to just a few minutes! Considering that they have hundreds of applications, the savings are massive!
How you can get started with monitoring-as-code
Do you want to take your observability strategy with Dynatrace to a whole new level and take a GitOps approach to monitoring or offer a true Monitoring as a Service to your teams? Stay tuned for an upcoming Performance Clinic! Monitoring as Code will also be featured at Perform 2021 with a Breakout session and a dedicated virtual hands-on training!
For more information on what Monaco can do take a look the README.me and some sample configurations used for integration testing.
Learn how combining Dynatrace’s intelligent tracing technology with monitoring-as-code can save you time and money.


Looking for answers?
Start a new discussion or ask for help in our Q&A forum.
Go to forum