Kubernetes is a great system for automating deployment, scaling, and management of containerized applications. It eliminates an enormous amount of devops work and allows companies to focus on building software that provides real value to customers.
Introduction
Kubernetes is a great system for automating deployment, scaling, and management of containerized applications. It eliminates an enormous amount of DevOps work and allows companies to focus on building software that provides real value to customers. Without monitoring though, you are flying blind. The Dynatrace ActiveGate Plugin, for monitoring a Kubernetes cluster, is an approach using the ActiveGate Plugin technology to extend the problem analysis of Dynatrace.
Kubernetes is a complex system unto itself.
In Kubernetes, a lot of components and services operate together to maintain a desired state of the cluster and keep everything up and running. Functionality for automatic load balancing between nodes, automatic restarting of failed nodes/pods, and rolling deployments to roll out new updates are in place. In such a complex system, failure of any component can have serious consequences. Especially, if core cluster components enter an unhealthy state.
Monitoring is not equal to firing alerts.
For monitoring, Kubernetes is pre-equipped with Prometheus exporters providing metric endpoints (/metrics). After deploying Prometheus Operator and kube-prometheus, we get a great overview about the cluster health, capacity, nodes, deployments and pods. When components reach an unhealthy state, Prometheus fires alerts in Alertmanager to which a cluster operator must react. However, the troubleshooting is often like groping in the dark. And the root cause of problems often remains untold.
Add AI to Prometheus with Dynatrace
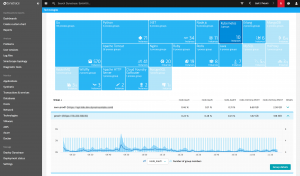
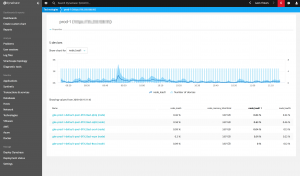
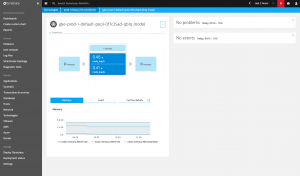
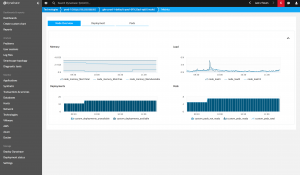
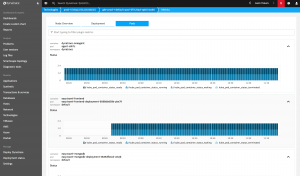
Dynatrace ActiveGate Plugins are executed on the Active Gateway and can retrieve metrics and topology from remote sources. With that, any technology exposing an external interface can be integrated with Dynatrace. Through correlating the plugin and OneAgent collected data, Dynatrace extends its problem analysis with the events and root cause originating from external sources, that don’t have Dynatrace running.
How to install the plugin?
Getting started with the Dynatrace ActiveGate Plugin is easy, simply follow the instructions under:
https://github.com/dynatrace-innovationlab/activegateplugin-k8s
How to contribute?
The plugin is available in a public repository on the Dynatrace Innovation Lab GitHub page. Feel free to test and contribute to the development of the plugin.
Disclaimer
The Dynatrace Kubernetes ActiveGate Plugin is currently in EAP (Early Access Phase).
Early Access releases provide early-stage insight into new features and functionality of the Dynatrace Platform. They enable you to provide feedback that can significantly impact our direction and implementation.
While Early Access releases aren’t ready to be used to build production solutions, they’re at a stage where you can test and tinker with an implementation. As we receive feedback and iterate on a project, we anticipate breaking changes without advanced warning, so Early Access releases should not be used in a user-facing manner or applied to production environments.
Update
Starting with ActiveGate version 1.163+ please follow the instructions from the official Dynatrace Help section to connect your Kubernetes cluster to Dynatrace.





Looking for answers?
Start a new discussion or ask for help in our Q&A forum.
Go to forum