Dynatrace recently published a NuGet package that makes it easy to instrument your Xamarin apps with Dynatrace OneAgent for Android and iOS, thereby making it possible to monitor your Xamarin apps with Dynatrace.
The Dynatrace.OneAgent.Xamarin NuGet package helps with auto-instrumenting Xamarin apps and offers an interface that makes it easy to add manual instrumentation to monitor additional HTTP frameworks or to tag users. The screenshots below show a monitored Xamarin app in Dynatrace.
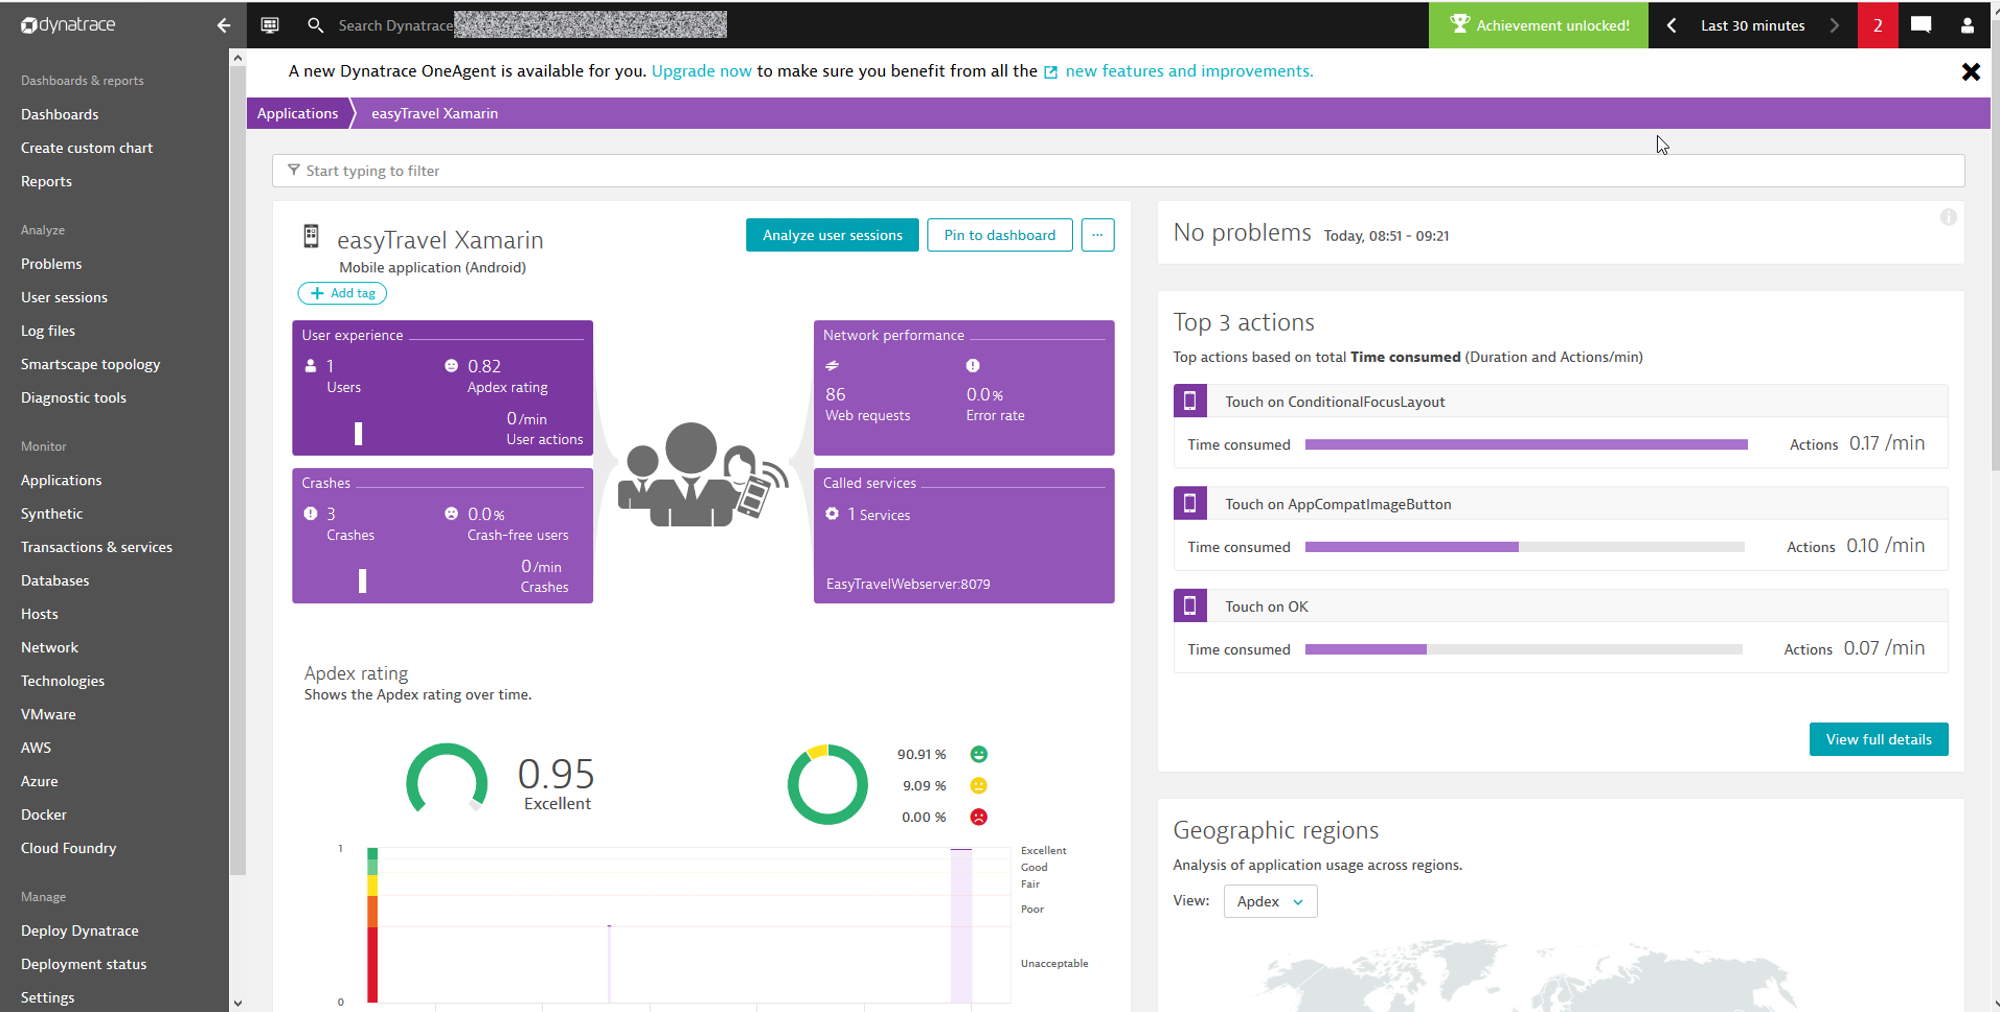
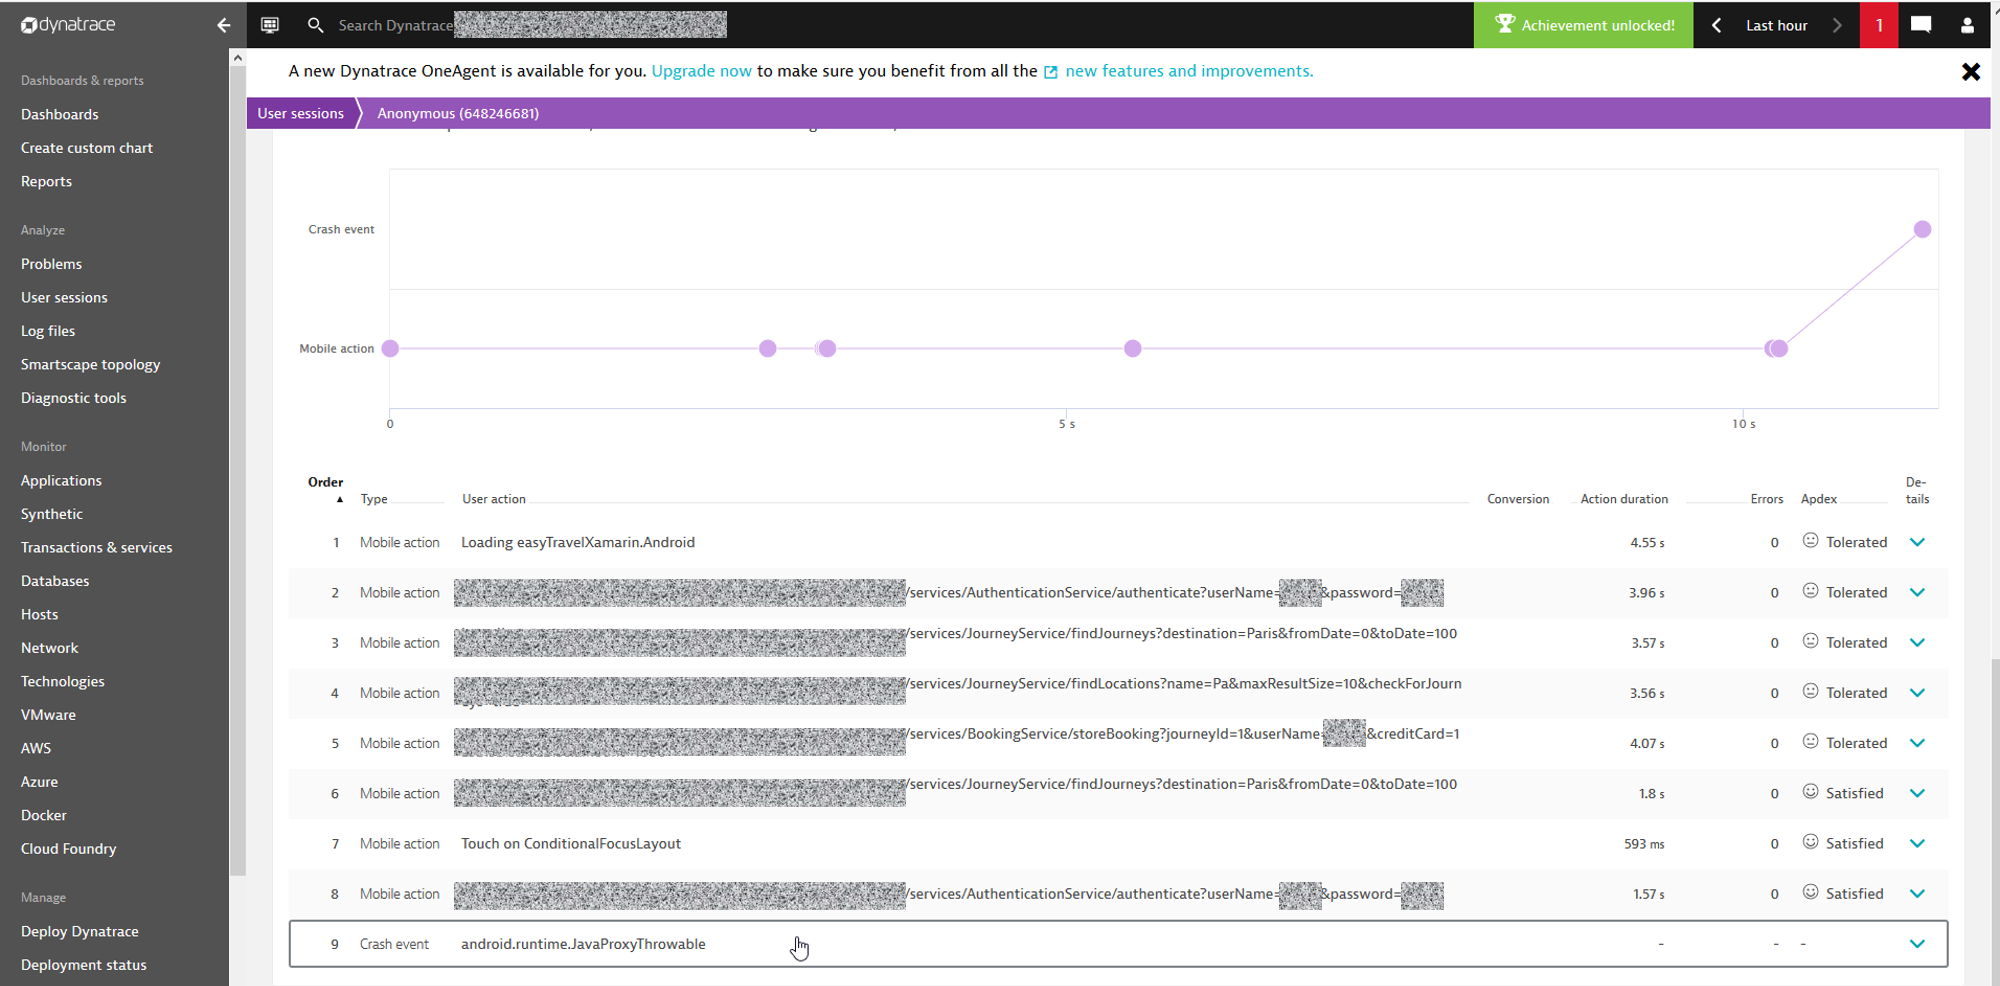
Get started
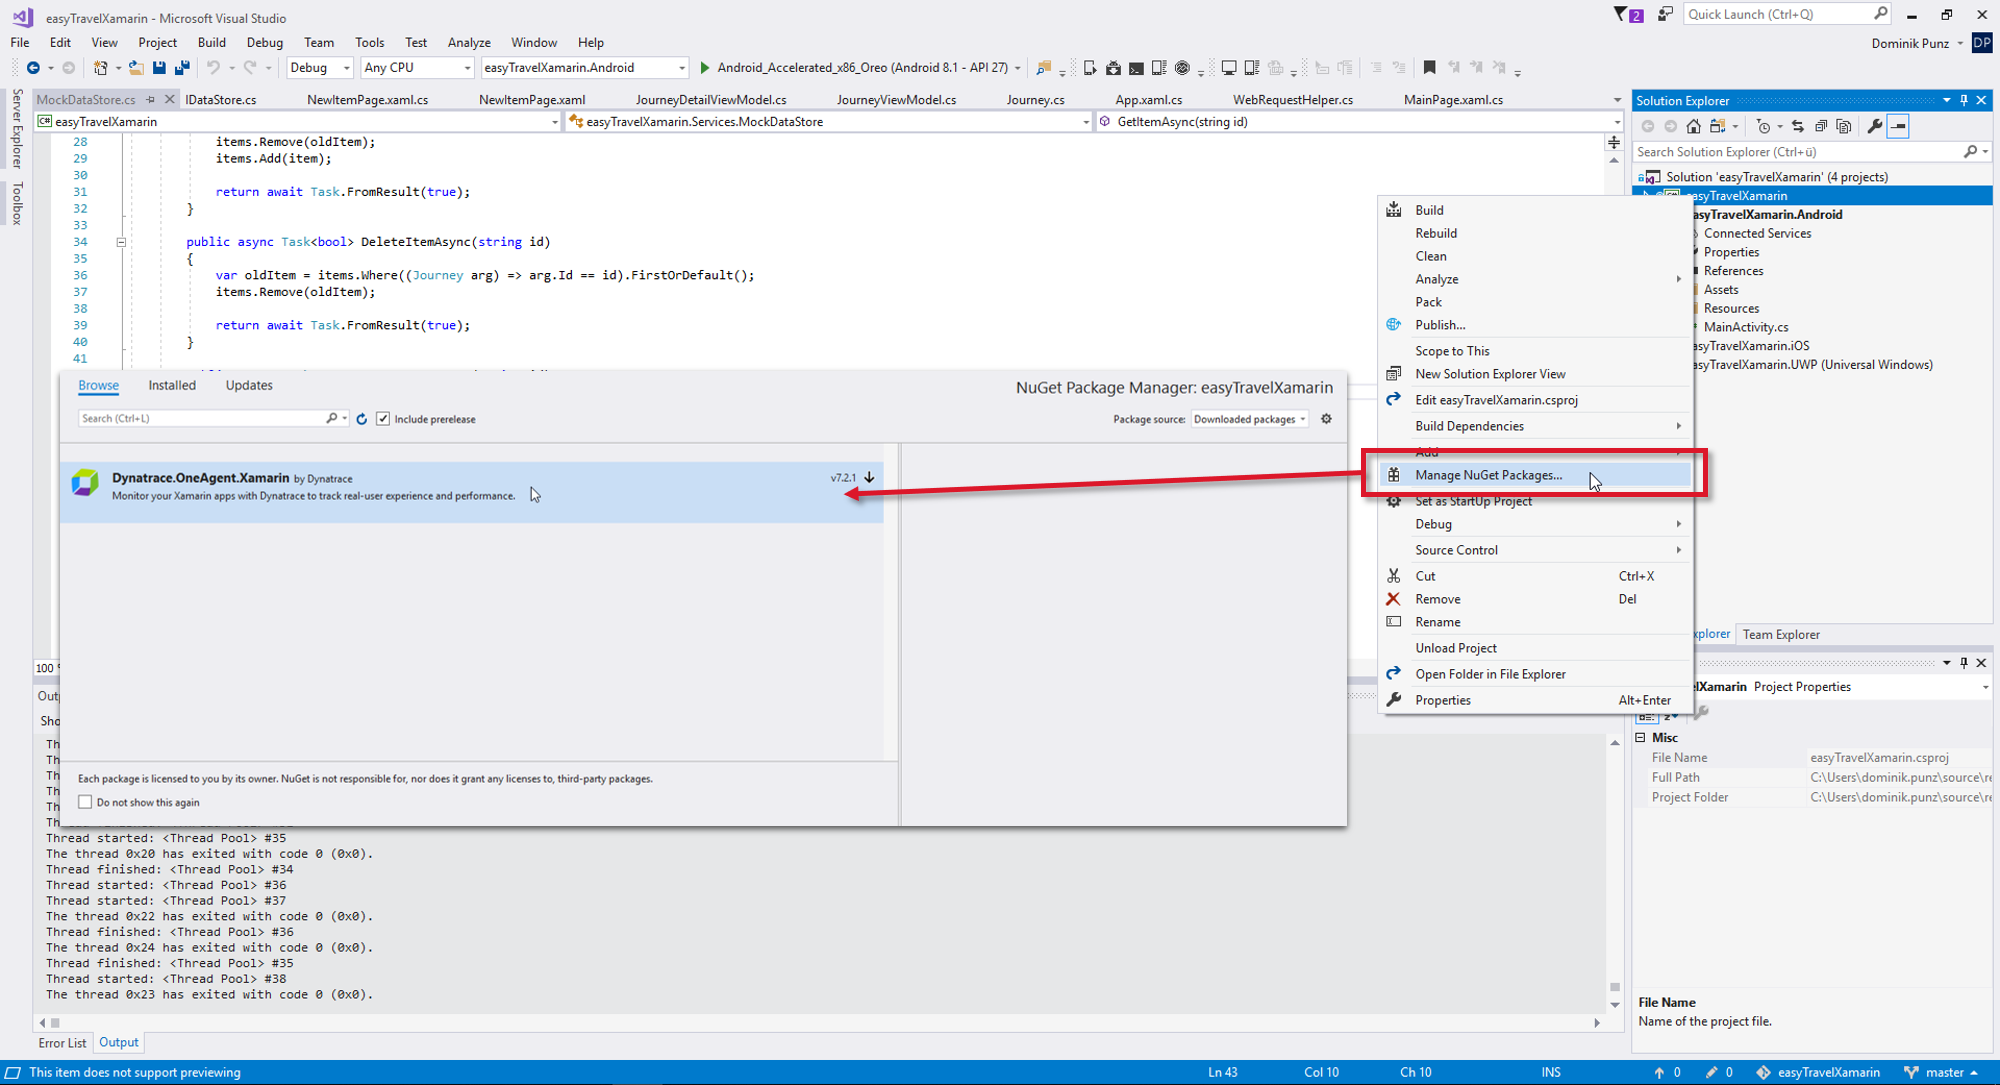
To get started, right-click on the main project of your app in Visual Studio and select Manage NuGet Packages. Search for Dynatrace.OneAgent.Xamarin and install the latest version.
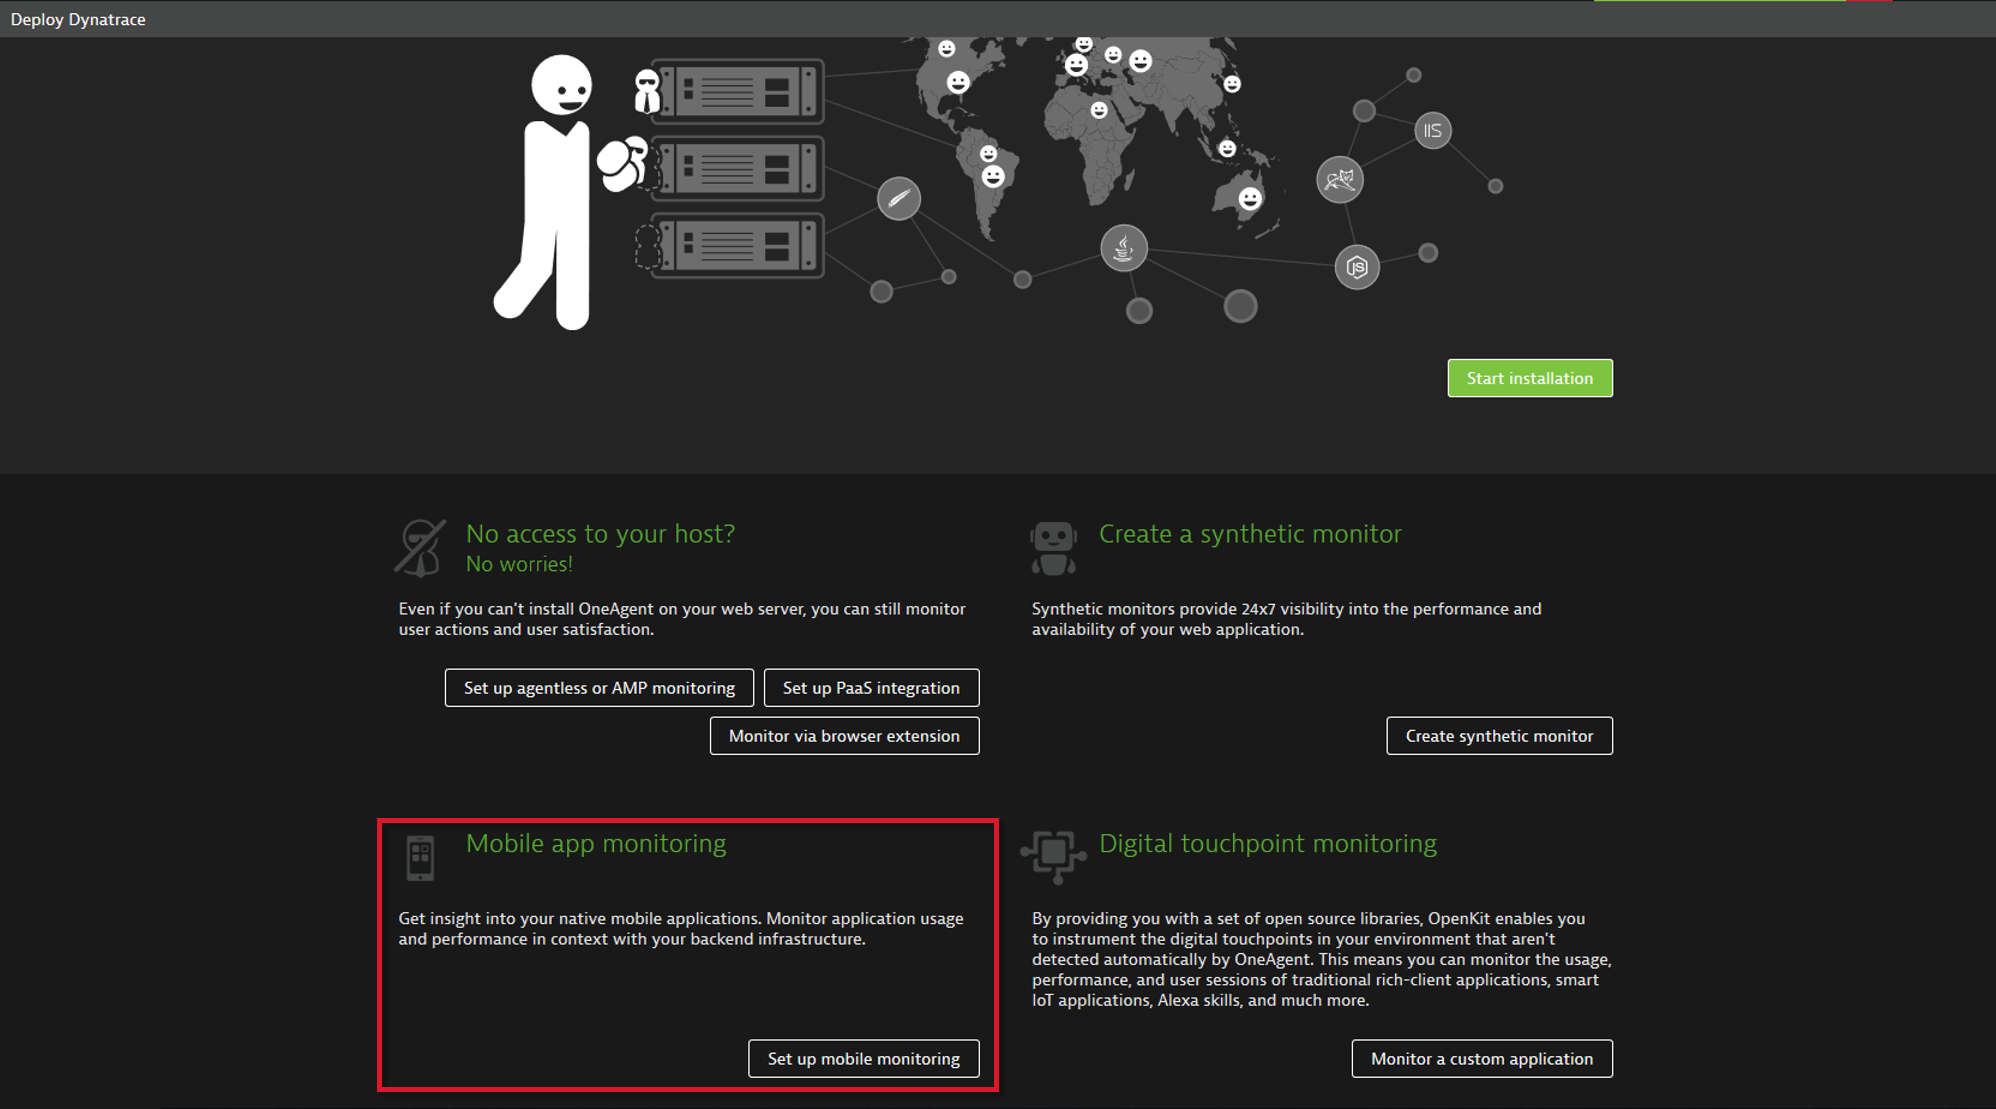
To set up monitoring in Dynatrace, you first need to define a new mobile app: Go to Deploy Dynatrace > Set up mobile monitoring.
This takes you to the Instrumentation settings page that provides you with details like application ID and beacon endpoint. See below for completing the configuration in your Android and iOS projects.
Configure your Android app
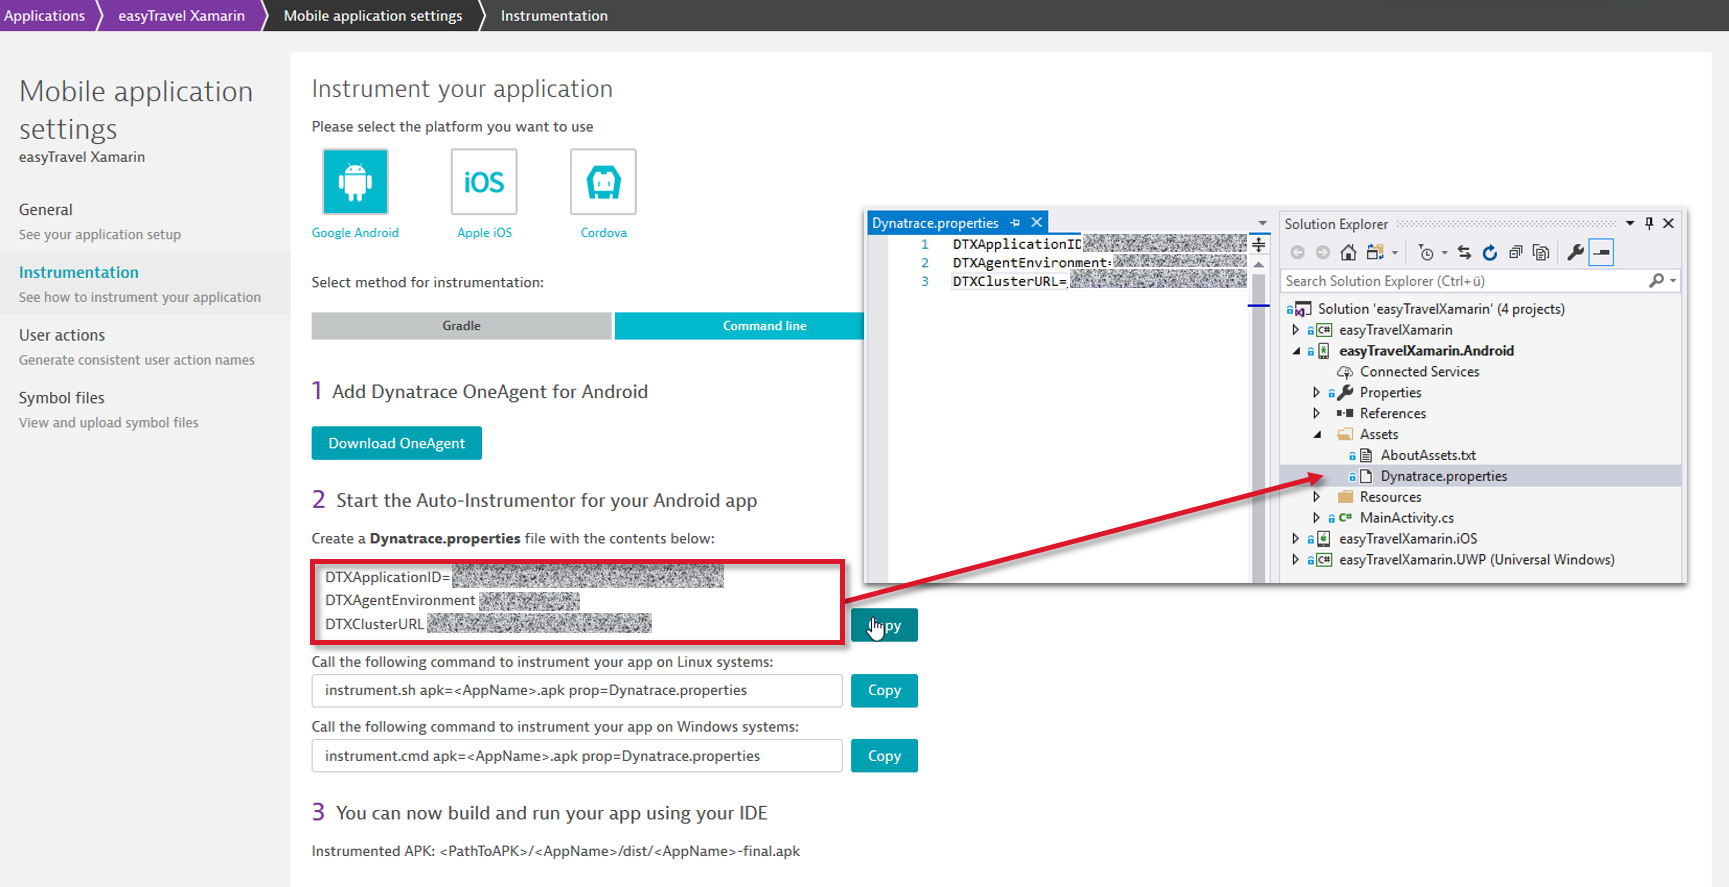
On the Instrumentation page, click Google Android and select the Command line tab. In Visual Studio, create a new file in the Assets folder of your Android project called Dynatrace.properties and paste the content from the Dynatrace portal window.
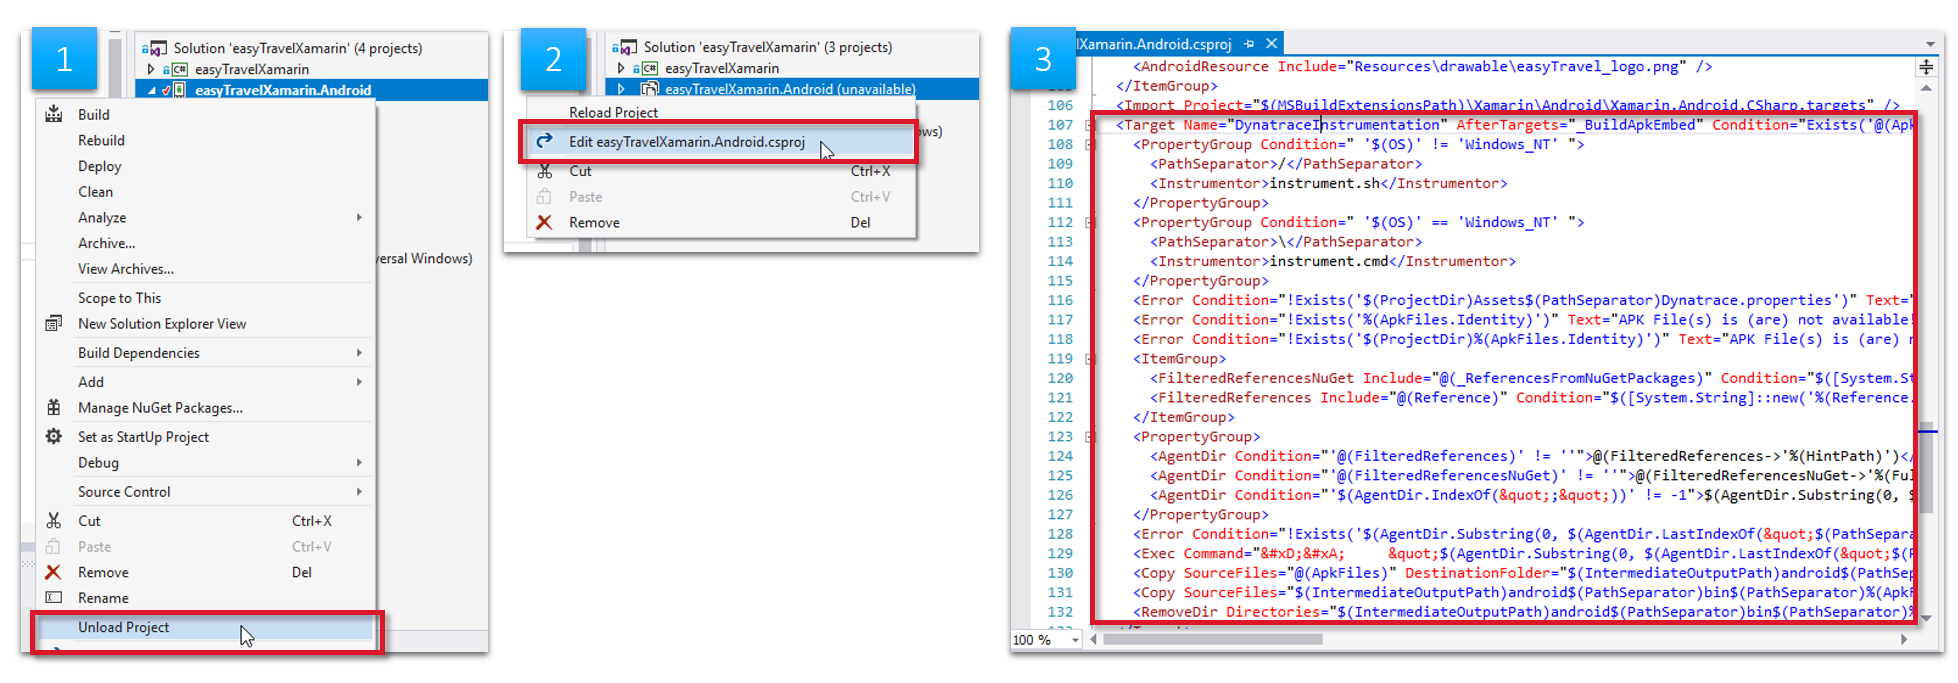
If you have a Forms-based application, you’ll also need to update your *.Android.csproj file by adding a build target that invokes the Android auto-instrumentation. You can find the details in the documentation section of the package on nuget.org. The easiest way to edit your .csproj file is to upload the project to Visual Studio (1 in the image below) and then open the file directly in Visual Studio (2 and 3 in the image below).
Configure your iOS app
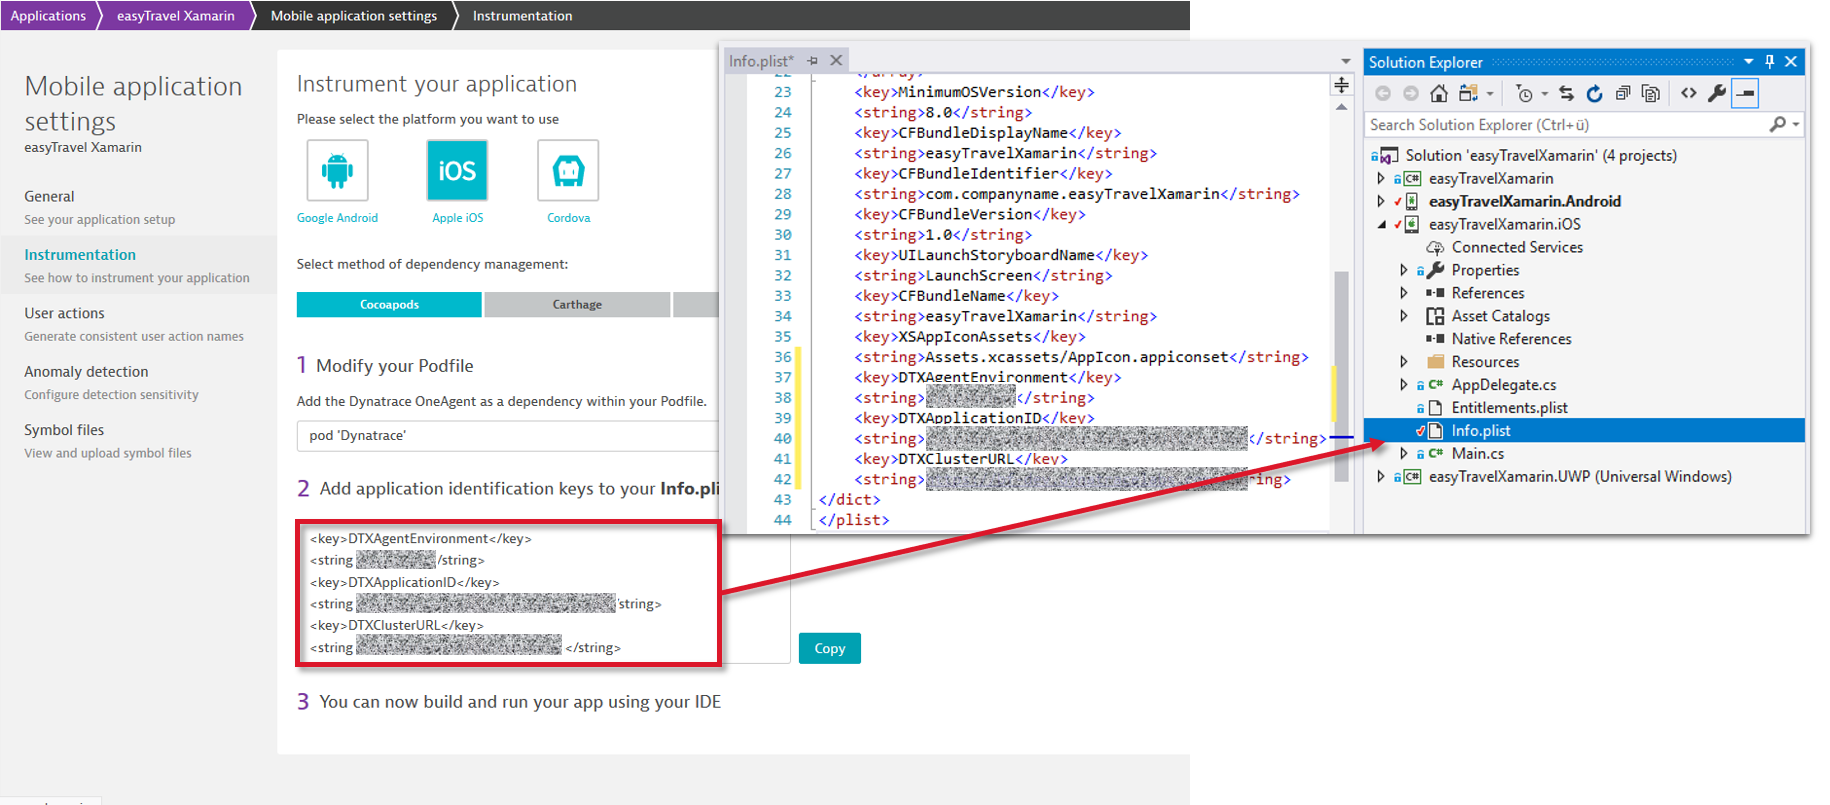
On the Instrumentation page, select Apple iOS and select the Cocoapods tab. Copy the PLIST code snippet into the existing Info.plist file in your Visual Studio project.
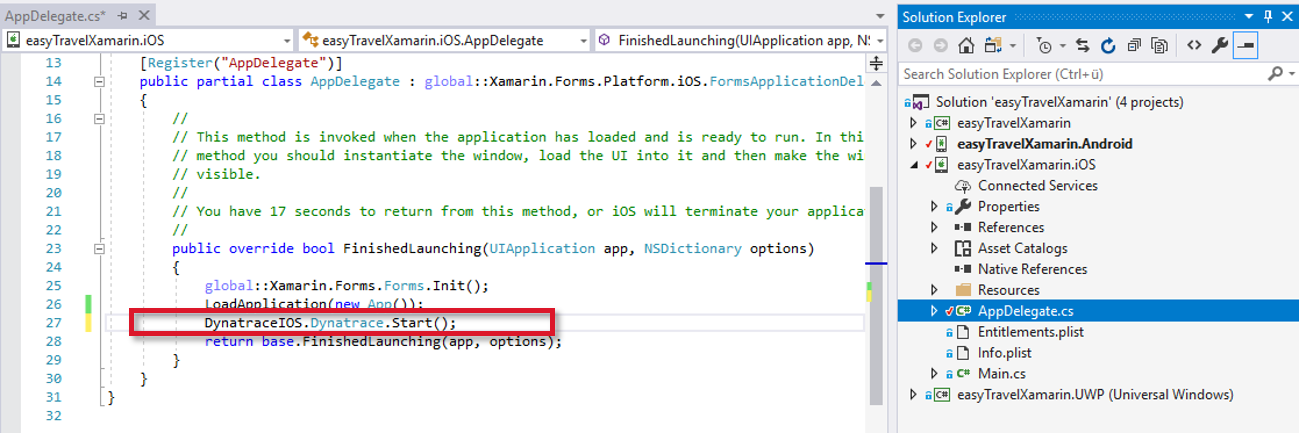
To prevent OneAgent for mobile from being stripped out of the iOS app as part of optimizations, you should add at least one call to the Dynatrace library. You can do this by adding a startup call to your app, as shown below.
Monitor web requests in your Forms project
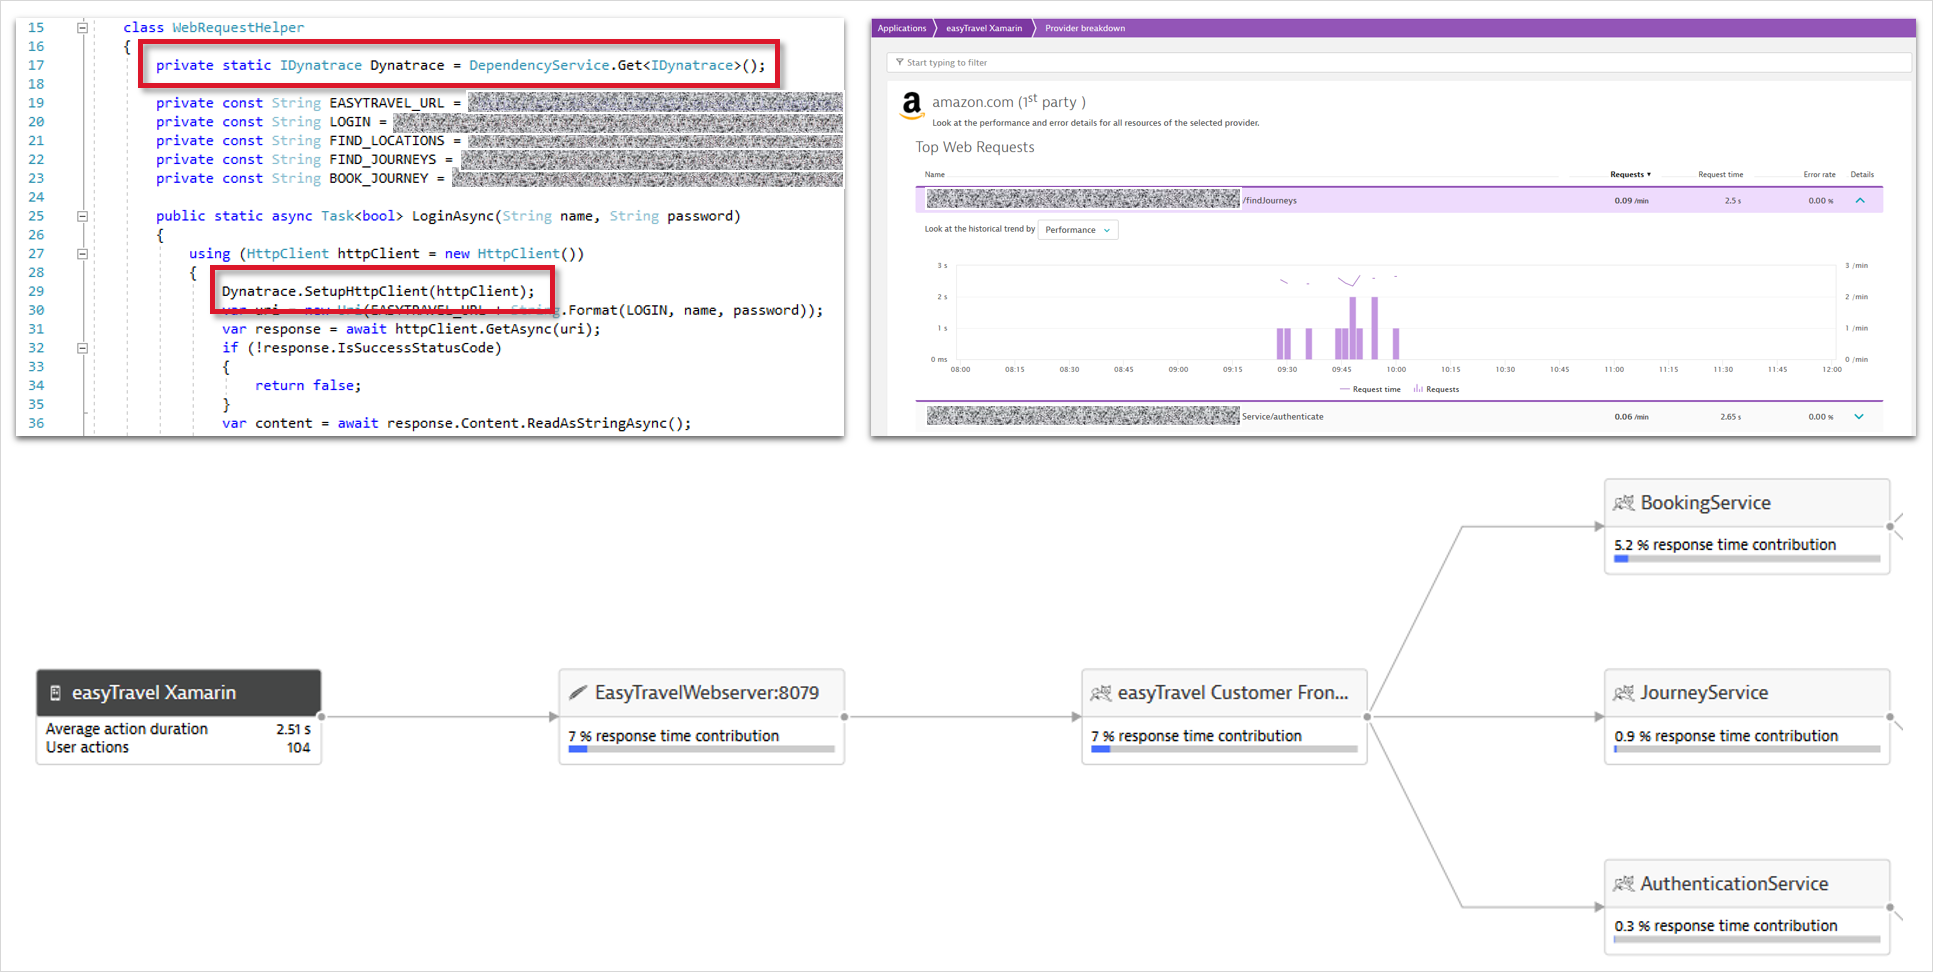
Dynatrace automatically monitors web requests that are made using the frameworks that are available natively on Android and iOS. If you trigger requests directly from your .NET code, they can be captured only manually by the Mobile Agent. So we’ve provided an interface for the commonly used HttpClient framework that allows you to set up request instrumentation with a single line of code. All other types of requests have to be instrumented differently. The documentation available through Nuget tells you how to instrument such requests.
Crash reporting
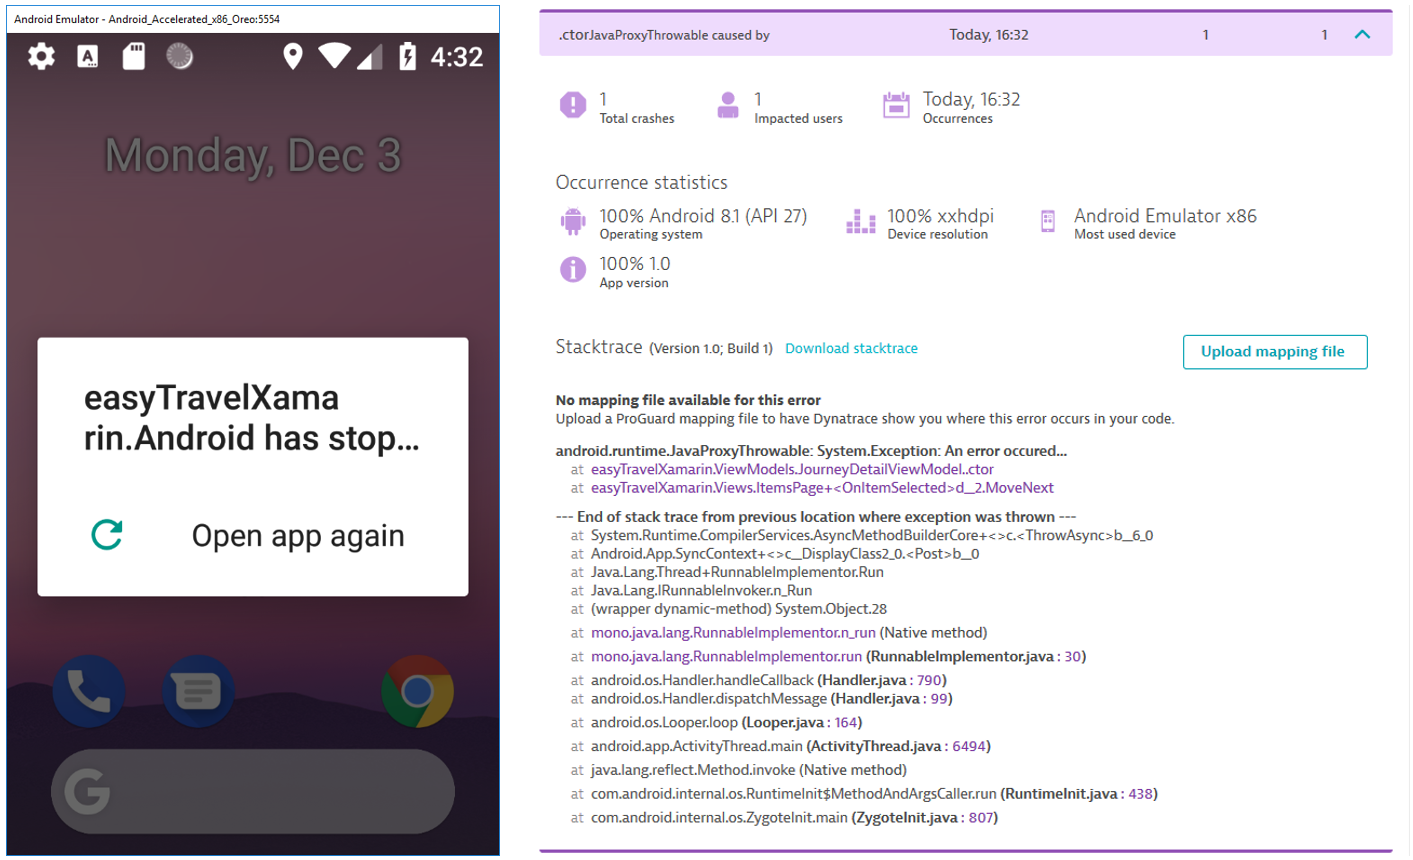
Crashes are reported automatically. Be aware that Dynatrace doesn’t support the upload of .pdb files. Symbolication is only available based on Proguard mapping files or iOS dSYM files.


Looking for answers?
Start a new discussion or ask for help in our Q&A forum.
Go to forum