Dynatrace OneAgent is great for monitoring the full stack. However, you can’t install OneAgents on every single type of device. There are certain situations when an agent based approach isn’t possible, such as with network or storage devices, or a very old OS. In those cases, what should you do if you want to be proactive and ensure that your infrastructure is always up and running?
You could of course create a custom device in Dynatrace and send data to it using our API or an ActiveGate extension. While this will give you a lot of information about the health of these components, sometimes a simple synthetic monitor is sufficient. Whether you need to make sure that your SQL database is listening on port 1433 even when there is no traffic, that your switch is responding to a ping or that your DNS server is up and running, the more devices you proactively monitor, the quicker you can react to unforeseen events.
Platform extensions
Heading up the Platform Extension Services team at Dynatrace, we’re the go-to team for anything that isn’t available out of the box. Whether you are looking to augment Davis® with additional metrics and events using our extensions framework, integrate Dynatrace with your CMDB or ticketing system, or add insight into unsupported technologies or frameworks using the OneAgent SDK or OpenKit, our global team has you covered.
In the past couple of years, the team has received several requests to provide synthetic monitoring for non-web-based protocols, such as ping, port checks, and DNS lookups. Using a combination of the ActiveGate extension framework and the Third-party Synthetic API, the extensions team has created a template that we use to quickly fulfill such requests.
Third-party synthetic monitors
Are you looking to monitor your infrastructure using one of our ready-made extensions, or would you like to draw on our experience and create your own synthetic monitors?
The Platform Extensions Services team is pleased to announce the open sourcing of our implementations for DNS lookups, port checks, and ping in GitHub.
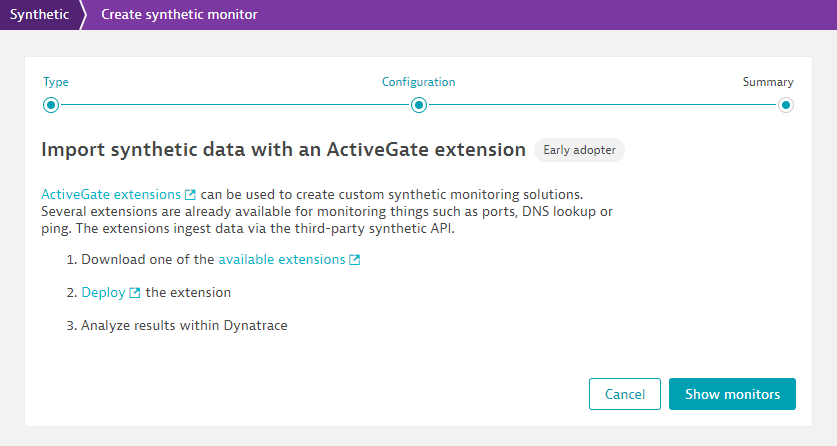
To further simplify the integration of extensions with Dynatrace, as of Dynatrace version 1.198, we’re launching an Early Adopter program with the first version of a dedicated flow that makes it easy for you to find example extensions that can support your needs.

Get started with Dynatrace extensions
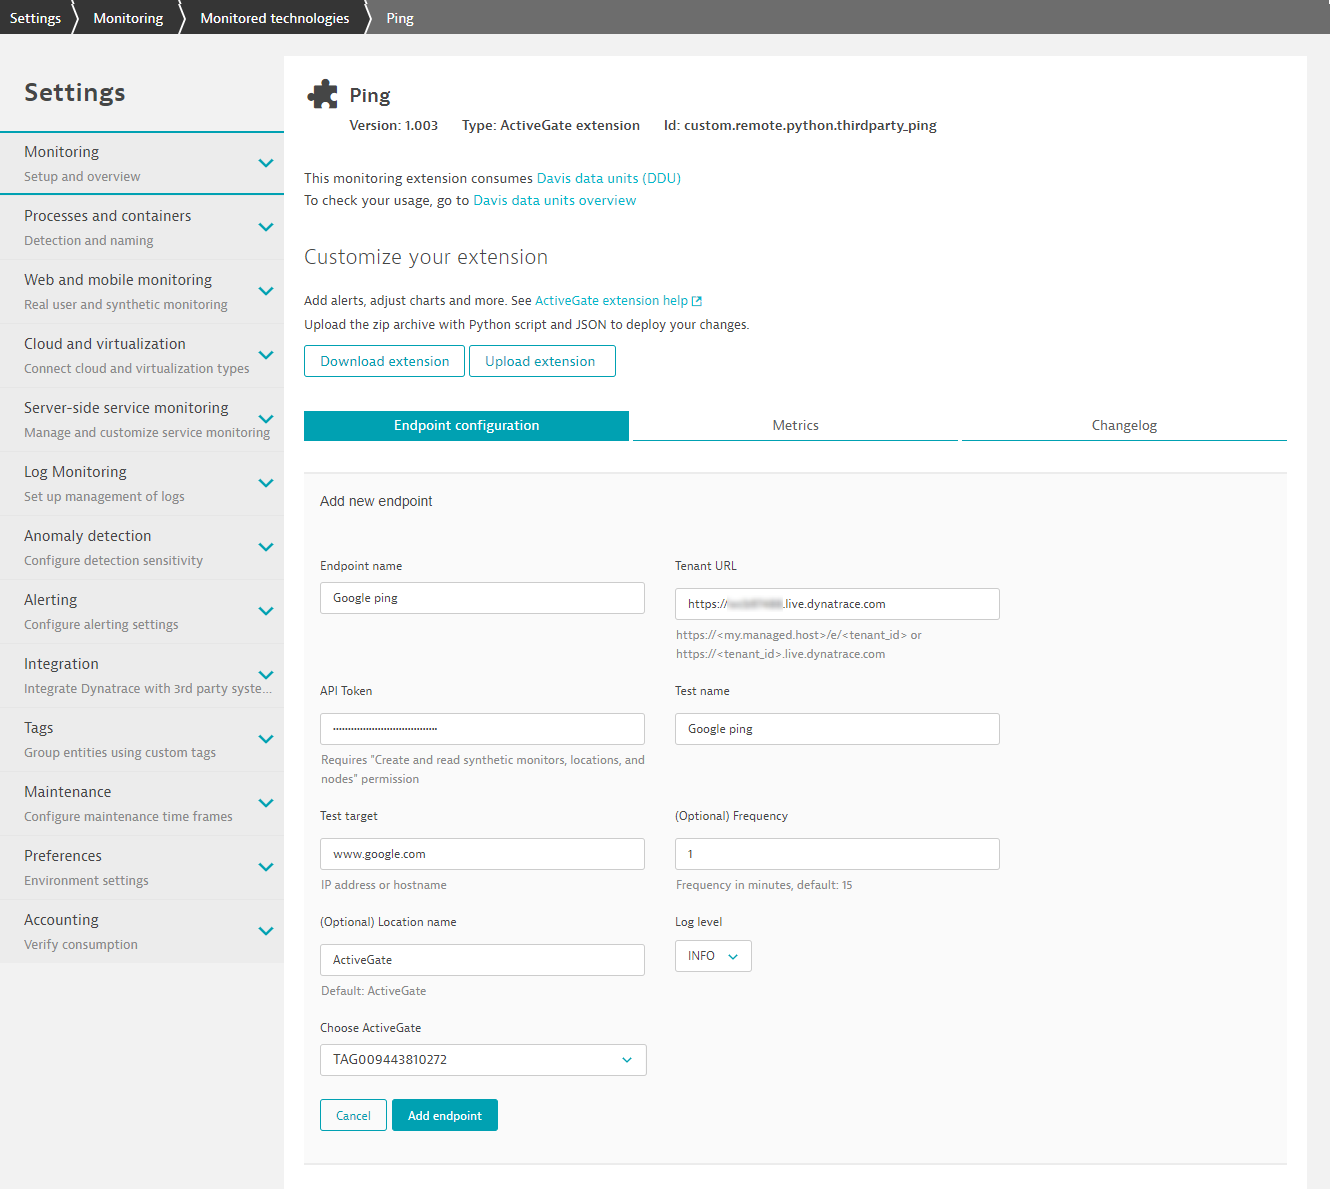
To get started, download and install one of the extensions by following the instructions on GitHub. Once that’s complete, you can create the synthetic monitors via the Custom extensions tab on the monitored technologies page.

Visualize your synthetic monitor data
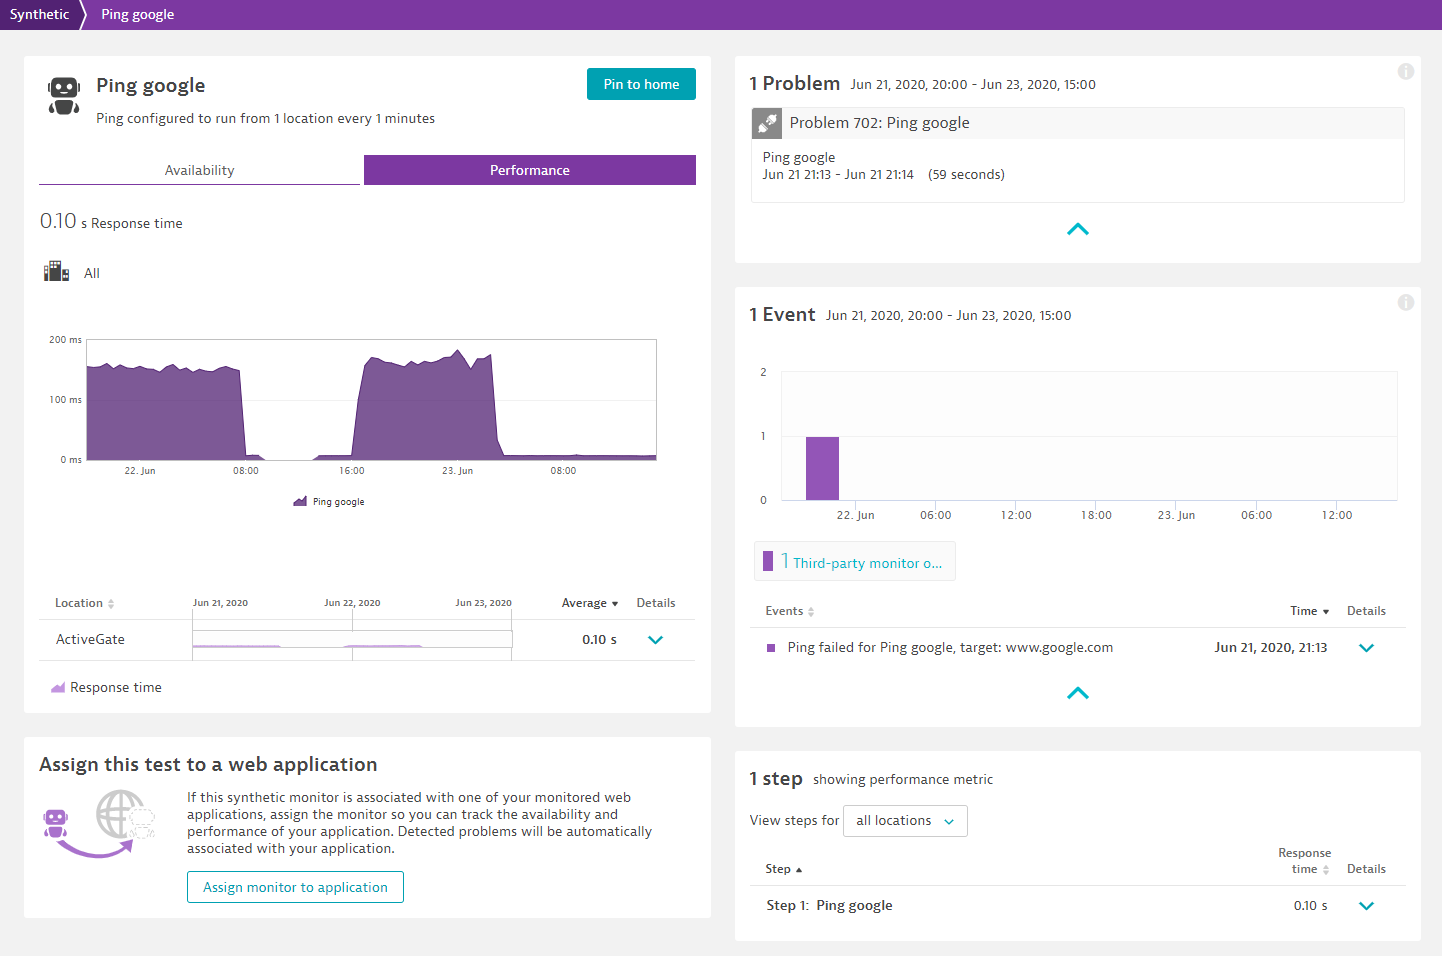
Once you’ve filled in the information for your synthetic monitor, the captured monitoring data will be displayed on the monitor’s overview page. Now you can analyze the results, link the synthetic monitor to a Dynatrace monitored application, create dashboards with the data, and much more.

Easy and flexible infrastructure monitoring
In just a few simple steps, you’ve now expanded your infrastructure monitoring possibilities! Following this same approach, you can add as many synthetic monitors as you need. For example, querying a database, doing an LDAP lookup, performing a get/put to (S)FTP, checking if a file exists and much more. If you don’t have the time to create additional monitors based on our template, you can reach out to the Dynatrace Platform Extension Services team at extensions@dynatrace.com. We’ll be happy to assist you.
For more information on creating ActiveGate extensions, please see Introduction to ActiveGate extensions.
For further details, see Third-party synthetic API.
Start a free trial!
Dynatrace is free to use for 15 days! The trial stops automatically, no credit card is required. Just enter your email address, choose your cloud location and install our agent.


Looking for answers?
Start a new discussion or ask for help in our Q&A forum.
Go to forum