
The observability backend you use with the OpenTelemetry demo application can help you quickly diagnose failures. Using the Astronomy Shop demo application, see how Dynatrace Dashboards with context from Grail gives you full visibility into your OpenTelemetry signals.
More organizations are adopting the OpenTelemetry observability standard in pursuit of a vendor-neutral solution to manual instrumentation, sending data to multiple vendors, and gaining insight into third-party services. But as most developers know, it’s the observability backend that reveals the value of your data and instrumentation strategy.
The OpenTelemetry community created its demo application, Astronomy Shop, to help developers test the value of OpenTelemetry and the backends they send their data to.
In this article, we’re going to see how using Dynatrace Dashboards can help us obtain an overview of the OpenTelemetry demo application’s health, based on the data we receive from the OpenTelemetry collector.
Using our dashboard, we can get an impression of the application’s overall usage and performance and detect potential problems, such as an increasing failure rate. We’ll also demonstrate how you can drill down on such problems further to identify bottlenecks within the application’s ingested distributed traces using the analytics power of Grail.
Set up the demo
- To run this demo yourself, you’ll need the following:
- A Dynatrace tenant. If you don’t have one, you can use a trial account.
- A Dynatrace API token with the following permissions. To set up the token, see Dynatrace API–Tokens and authentication in Dynatrace documentation.
- Ingest OpenTelemetry traces (
openTelemetryTrace.ingest) - Ingest metrics (
metrics.ingest) - Ingest logs (
logs.ingest)
- Ingest OpenTelemetry traces (
- A Kubernetes cluster (we recommend using kind)
- Helm, to install the demo on your Kubernetes cluster
- Once your Kubernetes cluster is up and running, the next step is to create a secret containing the Dynatrace API token. This will be used by the OpenTelemetry collector to send data to your Dynatrace tenant. Create the secret using the following command:
API_TOKEN="<your API token>"
DT_ENDPOINT=https://<your-tenant-id>.dynatrace.com/api/v2/otlp

kubectl create secret generic dynatrace --from-literal=API_TOKEN=${API_TOKEN} --from-literal=DT_ENDPOINT=${DT_ENDPOINT}
- After successfully creating the secret, you can install the OpenTelemetry demo application using Helm. First, download the helm values file from the Dynatrace snippets repo on GitHub. This file configures the collector to send data to Dynatrace using the API token in the secret you created earlier.
- Next, use the following commands to install the Demo application on your cluster:
helm repo add open-telemetry https://open-telemetry.github.io/opentelemetry-helm-charts helm install my-otel-demo open-telemetry/opentelemetry-demo --values otel-demo-helm-values.yaml
- After invoking the helm install command, the application will soon be up and running, and the OpenTelemetry collector will send data to your Dynatrace tenant.
Installing the OpenTelemetry demo application dashboard
- In your Dynatrace tenant, navigate to the Dashboards app:
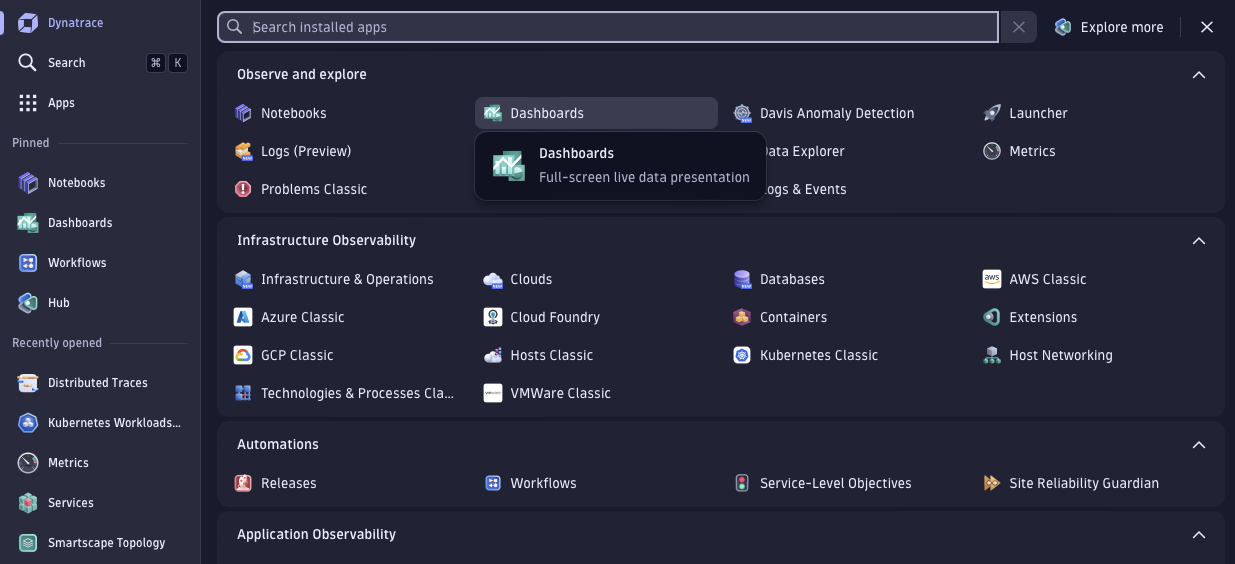
Figure 2. Find the Dashboards app on the Dynatrace tenant. - To install the OpenTelemetry demo application dashboard, select Upload at the top of the Dashboards app and upload the following JSON file that contains the dashboard configuration:
https://raw.githubusercontent.com/Dynatrace/snippets/refs/heads/master/technologies/open-telemetry/open-telemetry-demo-application-dashboard/open-telemetry-demo-dashboard.json
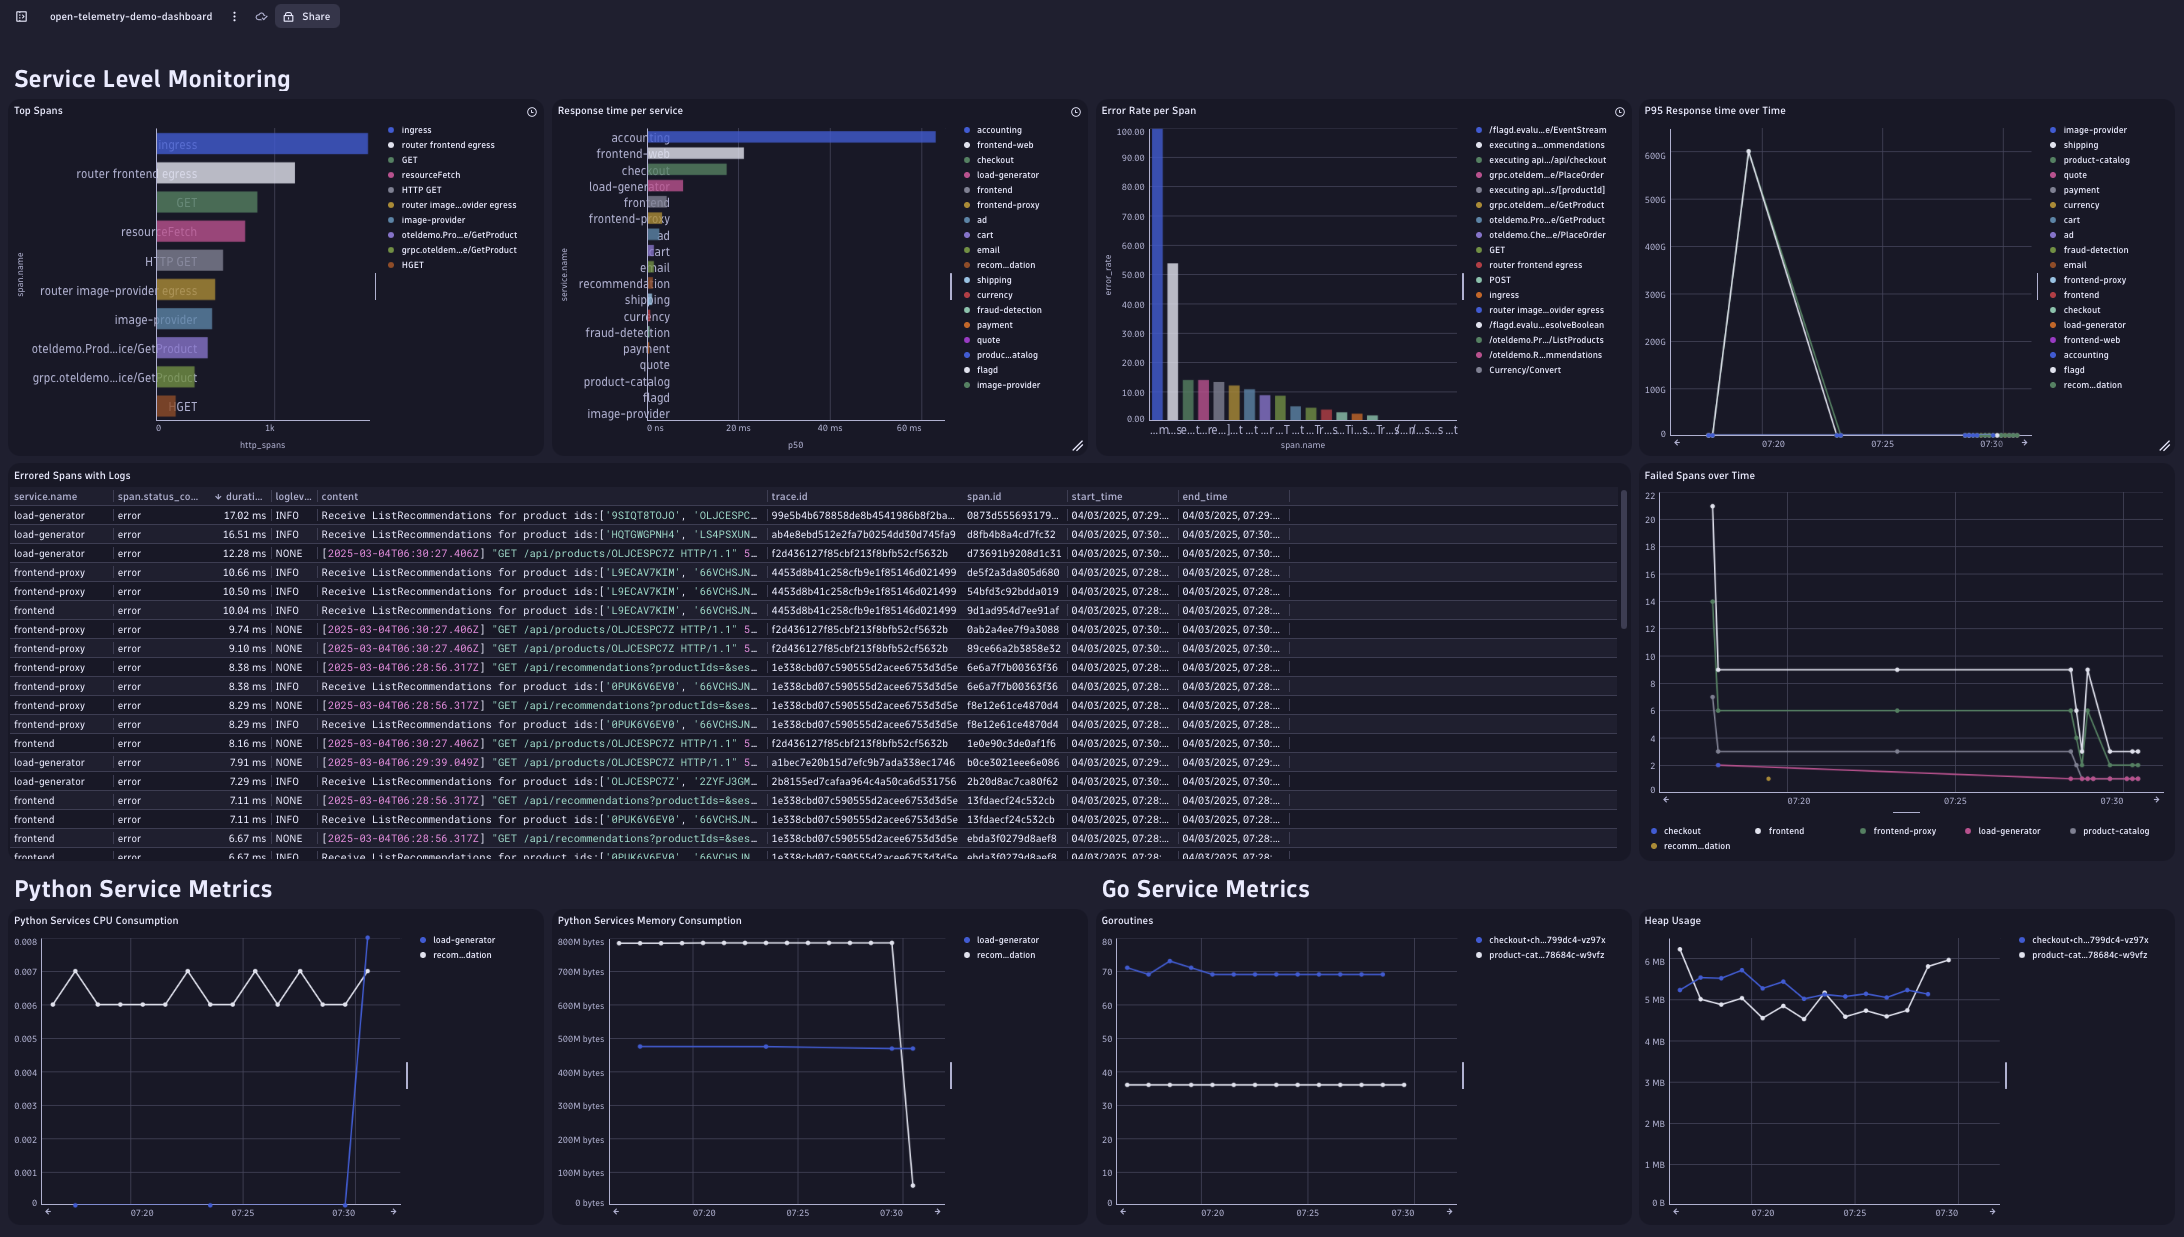
- Once you’ve imported the dashboard, you’ll see several charts representing the overall application health.
Troubleshooting problems using the OpenTelemetry demo app dashboard
Now let’s see how the dashboard and the Distributed Tracing app can help us spot problems and find their root cause. For this purpose, we’re going to make use of the built-in failure scenarios that are included in the OpenTelemetry demo.
- To enable a failure scenario, first update the
my-otel-demo-flagd-configConfigMap that contains the application feature flags. - Find the flag named
productCatalogFailureand change thedefaultVariantfromofftoon. - After a couple of minutes, you’ll notice the effects of this change as failed spans start appearing in the Distributed Tracing app.
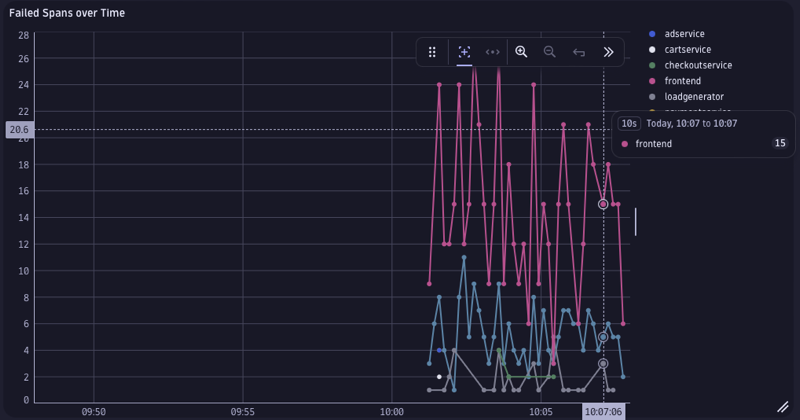
Figure 3. As spans begin to fail, their effects register across the services they touch. - Also, in the Errored Spans with Logs table, we notice many entries that seem to relate to product retrieval, as indicated in the related log messages. Since all requests generated by the load generator go through the frontend service, most of the logs related to failed spans are generated here. To pinpoint exactly where those requests are failing, we use the
trace.idfield included in each table entry. Selecting a value within this column gives us the option to further inspect the trace in the Distributed Tracing app:
Figure 4. A list of error log messages with links to the related spans. - The Distributed Tracing app, powered by Grail and its access to petabytes of trace data, gives us an overview of which services are involved in the errored trace. It reveals which of the trace’s child spans have caused errors:

Figure 5. The Distributed Tracing app shows details of the spans involved. Here we notice that the error seems to be caused by the product service, specifically instances of the
GetProductcall. We also notice that the status message indicates that the occurring failures are related to the feature flag we changed earlier. However, not all theGetProductspans seem to be failing—only some. - So, we decide to investigate further by adding a specialized tile into our dashboard where we evaluate whether the product ID has an impact on the error rate. For this, we use the following DQL query, which fetches all spans generated by the product service with the name
oteldemo.ProductCatalogService/GetProduct, and summarizes the number of errored spans by the product ID:
Figure 6. DQL query that fetches spans from the suspected product ID. - The result of this query confirms our suspicion that there might be something wrong with a particular product, as all the errors seem to be caused by requests for a particular product ID:

Figure 7. Confirmation that our hunch was right: the failures all involve a particular product ID.
Of course, this example was easy to troubleshoot because we’re using a built-in failure simulation. But this should give you an idea of how DQL helps you investigate problems by analyzing how certain span attributes might affect the outcome of requests sent to a faulty service.
What’s next
This demo showed how we can leverage the flexibility of dashboards to visualize data coming from the OpenTelemetry collector to get an overview of an application’s health. It also showed the power of DQL to pinpoint the root cause of an unexpected problem.
While service level metrics, such as the response time, error rate and throughput are available as soon as your application exports traces through the OpenTelemetry collector, there is also the potential for obtaining additional process level metrics (for example CPU and memory consumption), provided that the services within your application also send those signals to the OpenTelemetry collector. To walk through this scenario and drill down further into the spans behind the failures and their effects on the services they touch, see the post Demo: Transform OpenTelemetry data into actionable insights with the Dynatrace Distributed Tracing app.
Combining all these signals in a single analytics backend extends your visibility into all your OpenTelemetry signals and the services they interact with.
If you’re not yet a DPS customer, you can use the Dynatrace playground instead. You can even walk through the same example above.


Looking for answers?
Start a new discussion or ask for help in our Q&A forum.
Go to forum