Dynatrace has long been able to capture and monitor all outgoing requests from your monitored server-side services. This includes web requests that your server-side components send out across the Internet. As there can be many of these, and most are likely not that important to you, Dynatrace collects these requests into a special service called Requests to public networks.
Some of these requests are likely important to you. For example, you may rely on the performance and availability of 3rd party service providers. Customers have told us they want to monitor such domains as regular “first class” services. You can now do this.
To configure how Dynatrace monitors a 3rd party service provider:
- Open the navigation menu and select Transactions & services.
- Select the Requests to public networks service.
- Click Show all requests to view the list of domains that your services call.
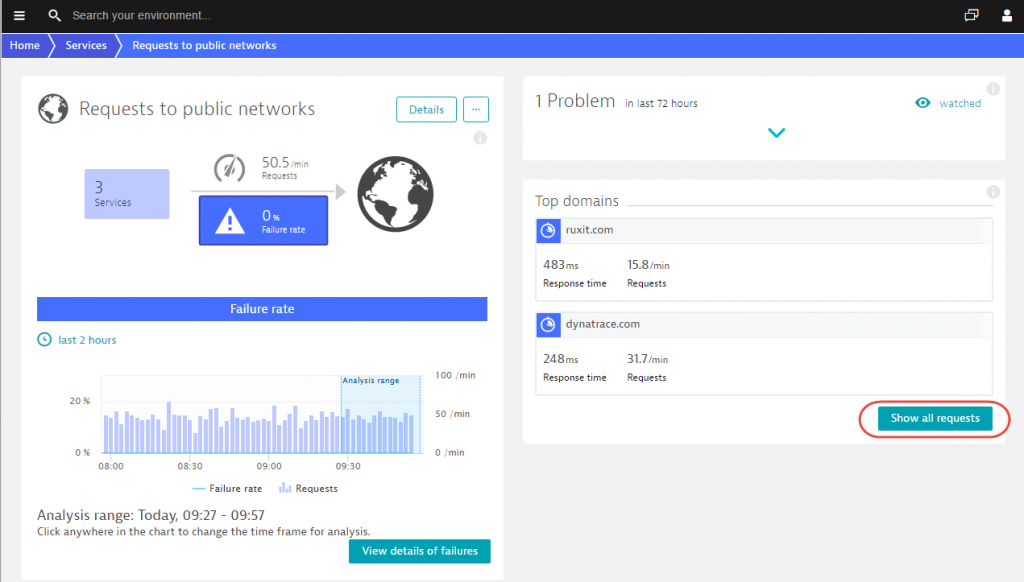
- Select the 3rd party domain that you’re interested in.
- Click Browse (…).
- Select Monitor as separate service.
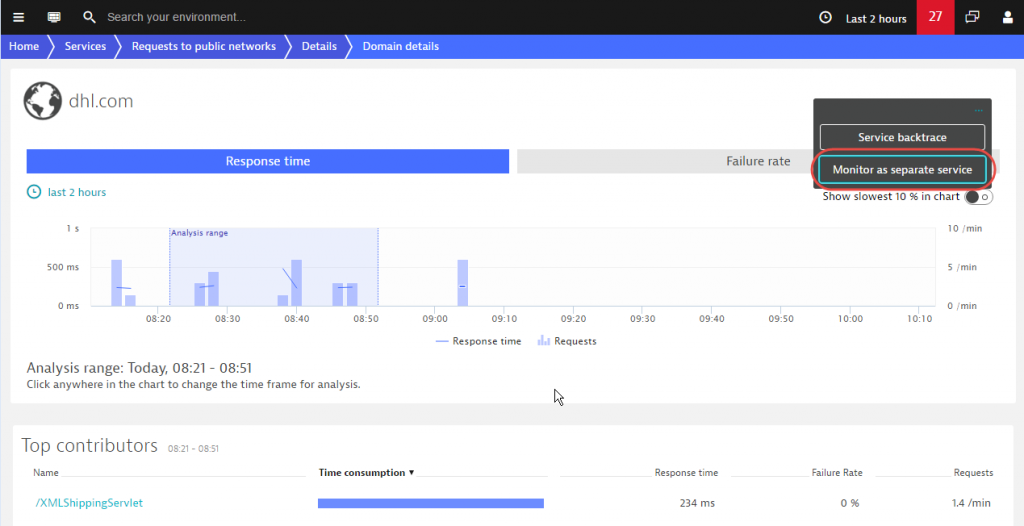
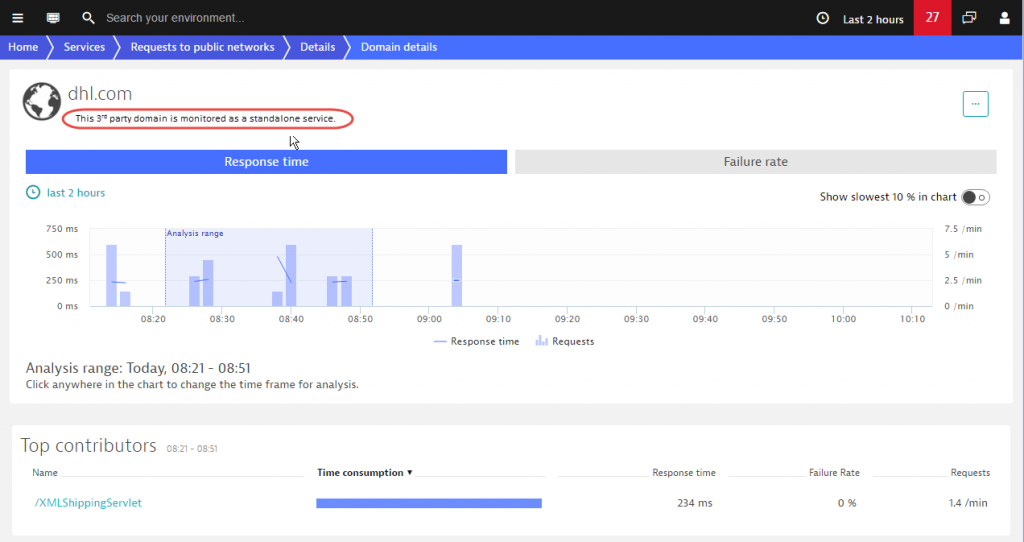
This results in re-categorization of the 3rd party domain as a standalone service.
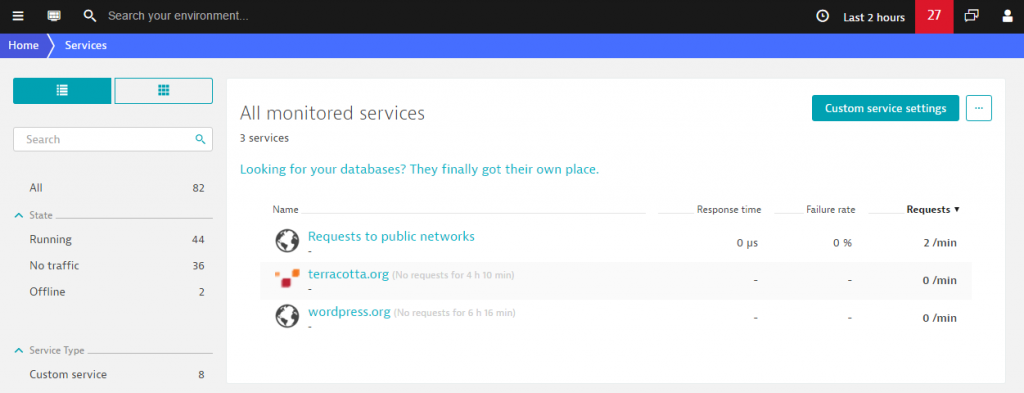
Newly categorized standalone services appear on the Services page as external dependencies (see Terracotta.org example below). They also show up in smartscape, Service flow, and elsewhere as standalone services. This enables you to track the response time of these services better. They can also be pinned to your homepage dashboard as dedicated tiles. You’ll even receive alerts when these services experience performance problems.
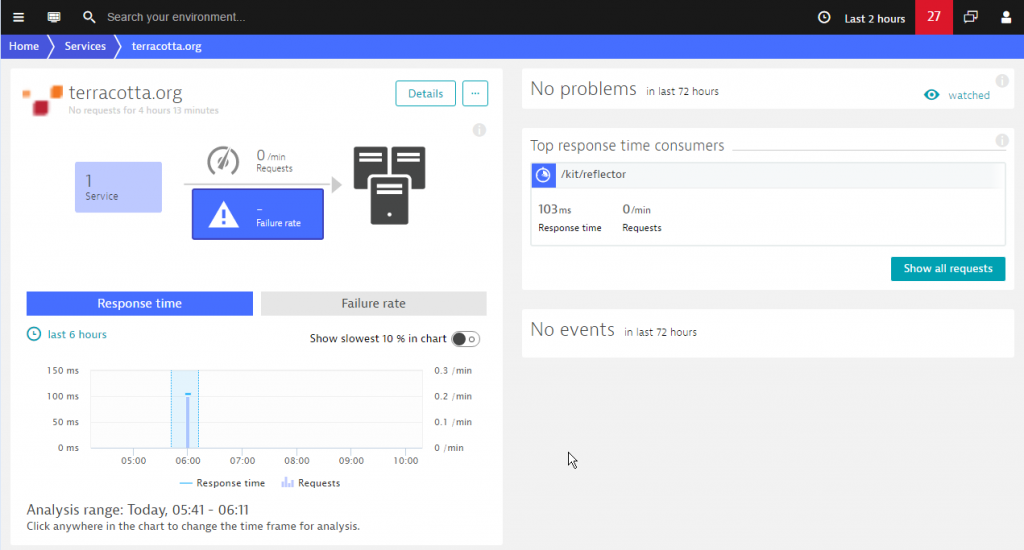
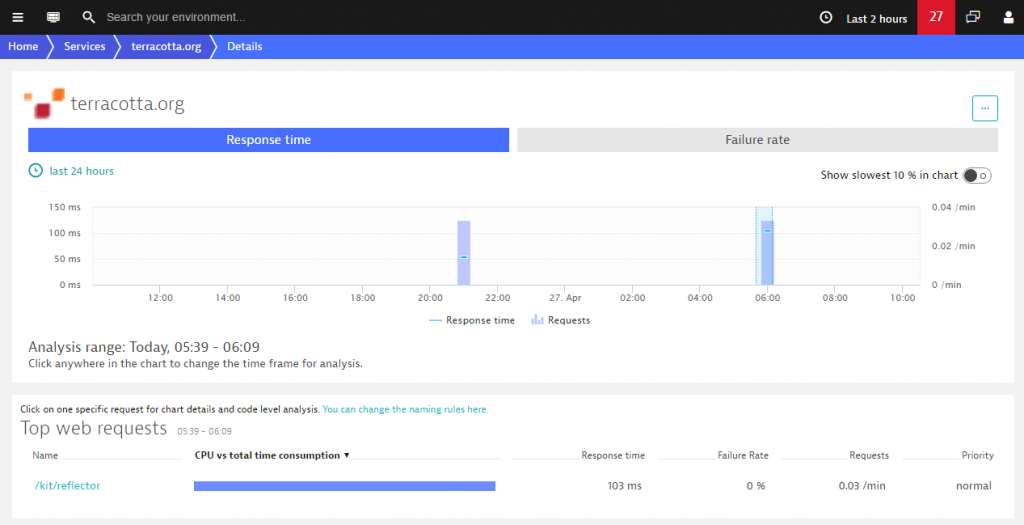
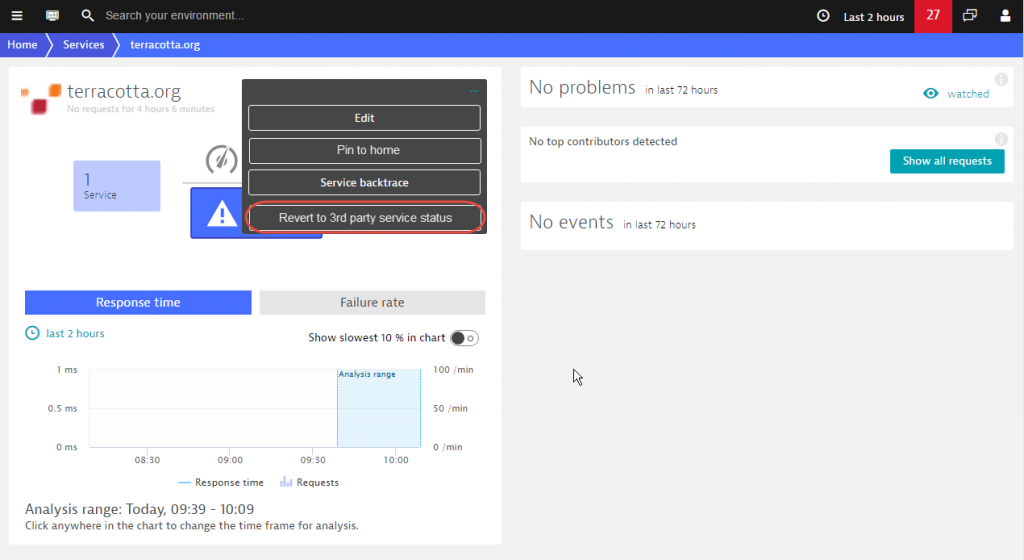
If you no longer wish to have a re-categorized 3rd party service set up as a standalone service–or you’ve extracted a certain domain accidentally–you can re-categorize the service anytime and return it to 3rd party status.


Looking for answers?
Start a new discussion or ask for help in our Q&A forum.
Go to forum