Mobile applications have become an integral part of our lives, and therefore a critical channel for organizations. Think of how you interact with your bank, for example. Many people have never even been into a branch and don’t consider going to the website. Native mobile applications have taken precedent, and organizations must have visibility into their performance.
DIY mobile app monitoring breeds complexity
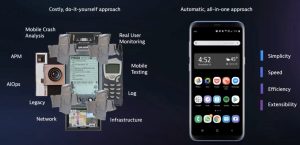
While there are dedicated tools that many mobile developers use, complex issues can arise when a mobile app ceases to meet performance expectations. In this case, mobile development teams often resort to costly do-it-yourself approaches where they attempt to put together different types of tooling to try to manage and monitor the mobile apps.
For example, they may use mobile crash analysis tools, classic APM tools, AI operations tools, or any sort of legacy monitoring for the network, infrastructure, logs, or real users. However, by tacking together disparate tools, issue complexity can increase exponentially, essentially landing mobile app development teams back at square one.
An automated, all-in-one approach to mobile app monitoring
A better solution would be a more automated, all-in-one approach that combines those different components into a single platform with multiple capabilities. For example, with the Dynatrace all-in-one approach to native mobile app monitoring, powered by deterministic AI, you can:
- Improve user satisfaction and experience
- Reduce time wasted on manual troubleshooting
- Spend time on optimization rather than looking for root causes of errors
- Gain deeper insights to make your apps perform better
This is the first of a three-part series covering different aspects of how to use Dynatrace for mobile monitoring. Watch the video below or read on to see how easy it is to get started with Dynatrace mobile monitoring.

Instrumenting native mobile apps with Dynatrace
The first thing a mobile developer needs to do is instrument their mobile application so monitoring data can be sent back to the Dynatrace platform. Irrespective of whether it is a native iOS or Android app, or a cross-platform app using technology such as React Native, Dynatrace can instrument it.
Once you sign into Dynatrace, go to the Dynatrace Hub. Here you can very simply search for or scroll down to select mobile monitoring. If you don’t have a Dynatrace account yet, sign up for your free trial for full access to the Dynatrace platform, including mobile app monitoring.
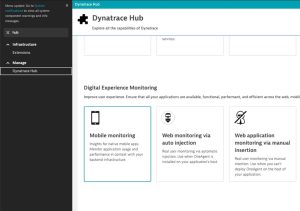
Select Mobile monitoring and enter the name of the mobile application you want to monitor. Then, go to Instrumentation wizard and select the programming language in which the app is written. From there on, select the method for instrumentation (Android) or dependency management (iOS). Then, follow the four to five steps to instrument your mobile application.
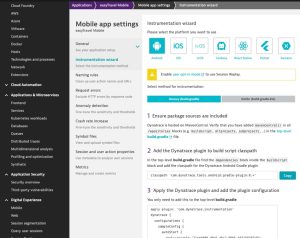
If you’re using mobile development frameworks like Xamarin, Flutter, or React Native, Dynatrace also offers instrumentation for those. Simply select the platform you use and follow the corresponding steps to instrument a mobile application that’s sending telemetry back to the Dynatrace platform.
Monitoring mobile apps on Dynatrace
Once you’ve completed the simple steps above, access your mobile application by looking for the Mobile option under Digital Experience. Click on your mobile application to see the telemetry data being captured whenever a user interacts with your application. Whether they are entering information in a form, swiping through screens, or clicking buttons, all those sessions, web requests, and possible errors will be captured automatically without a mobile developer needing to manually intervene.
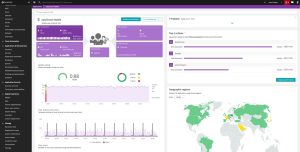
You’ve seen how easy it is to instrument your mobile application and start monitoring it in a few simple steps. In the next blog post of the series, we cover how Dynatrace gives mobile app owners visibility into everything they need to know about an app.





Looking for answers?
Start a new discussion or ask for help in our Q&A forum.
Go to forum