I’m sure there’s more than one popular meme on “Metrics, Metrics Everywhere” – because – that’s what we get from most observability platforms: a lot of metrics!
The same is true with Dynatrace. You get metrics captured by OneAgent, through the various extension options or those pushed to the Metrics Ingest API. And while it’s great to have metrics that fill our dashboards, evaluate our Service Level Objectives (SLOs), are used for baselining and anomaly detection, or used to detect root causes of problems there are a couple of questions that keep coming up in our community:
- Can I convert a metric to a different unit?
- Can I get the sum of multiple metrics split by a common dimension?
- Can I get the rate of two metrics to simplify SLO definitions?
Metric expressions answer those, and other, questions we keep hearing. But what are metric expressions? How do they work? What are some examples that we can use to learn how to use them?
At a recent internal Dev2Dev meeting I saw Philipp Stadler, Senior Software Engineer at Dynatrace, answering all those questions in one of his presentations. He explained the concepts of metrics, how they are managed in Dynatrace, how you can slice and dice the data through metrics expressions, and how everything works internally.
As I consider the information presented by Philipp so valuable for our global community I asked him to record the following video tutorial with me which you can also watch on YouTube or Dynatrace University. If you don’t have Dynatrace just sign up for a Dynatrace trial and try the same examples:
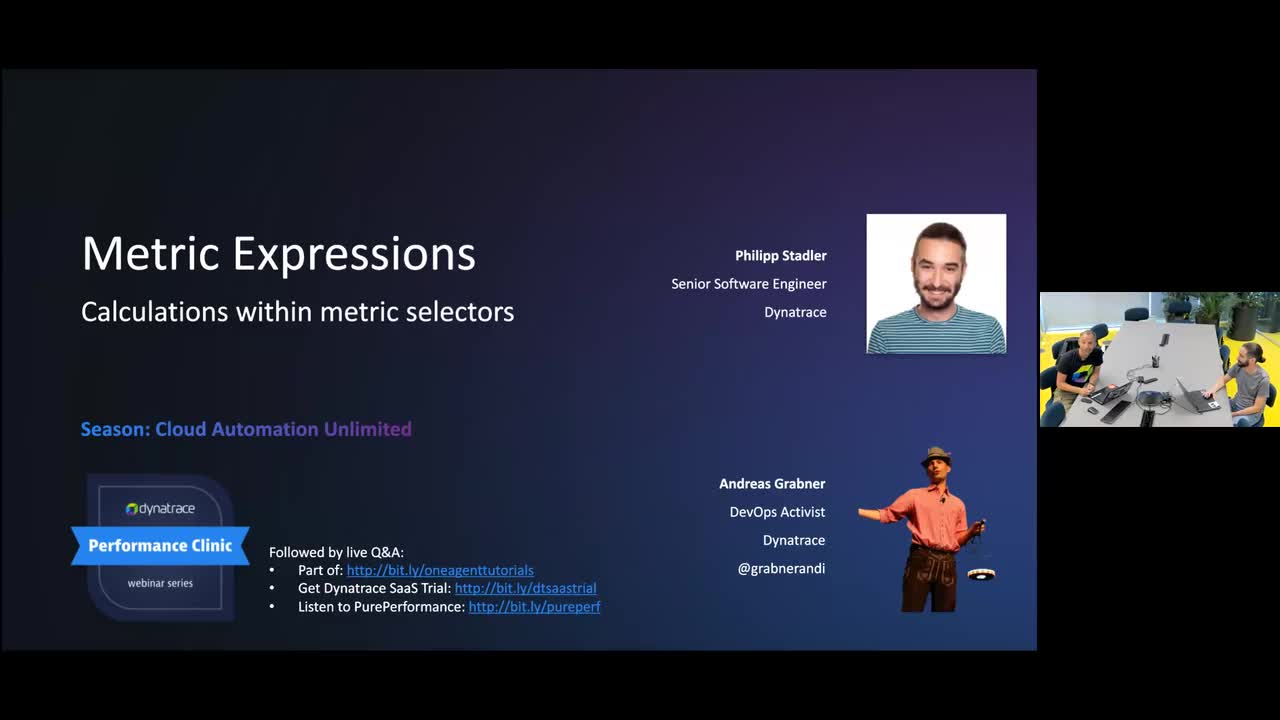
While all the information is available in the video let me quickly walk you through my biggest lessons learned, in the hope this will also help you better understand how you can leverage metrics expression in your day2day life with Dynatrace:
What is a metric made of?
While many of us may have a good understanding of what a metric is and what it’s made of, I really liked the way Philipp walked us through a simple real-life scenario of a metric capturing room temperature in different offices. In his example he used the Dynatrace metric ingest protocol and explained that a metric value is always a compound of a metric key, dimension, value, and timestamp:
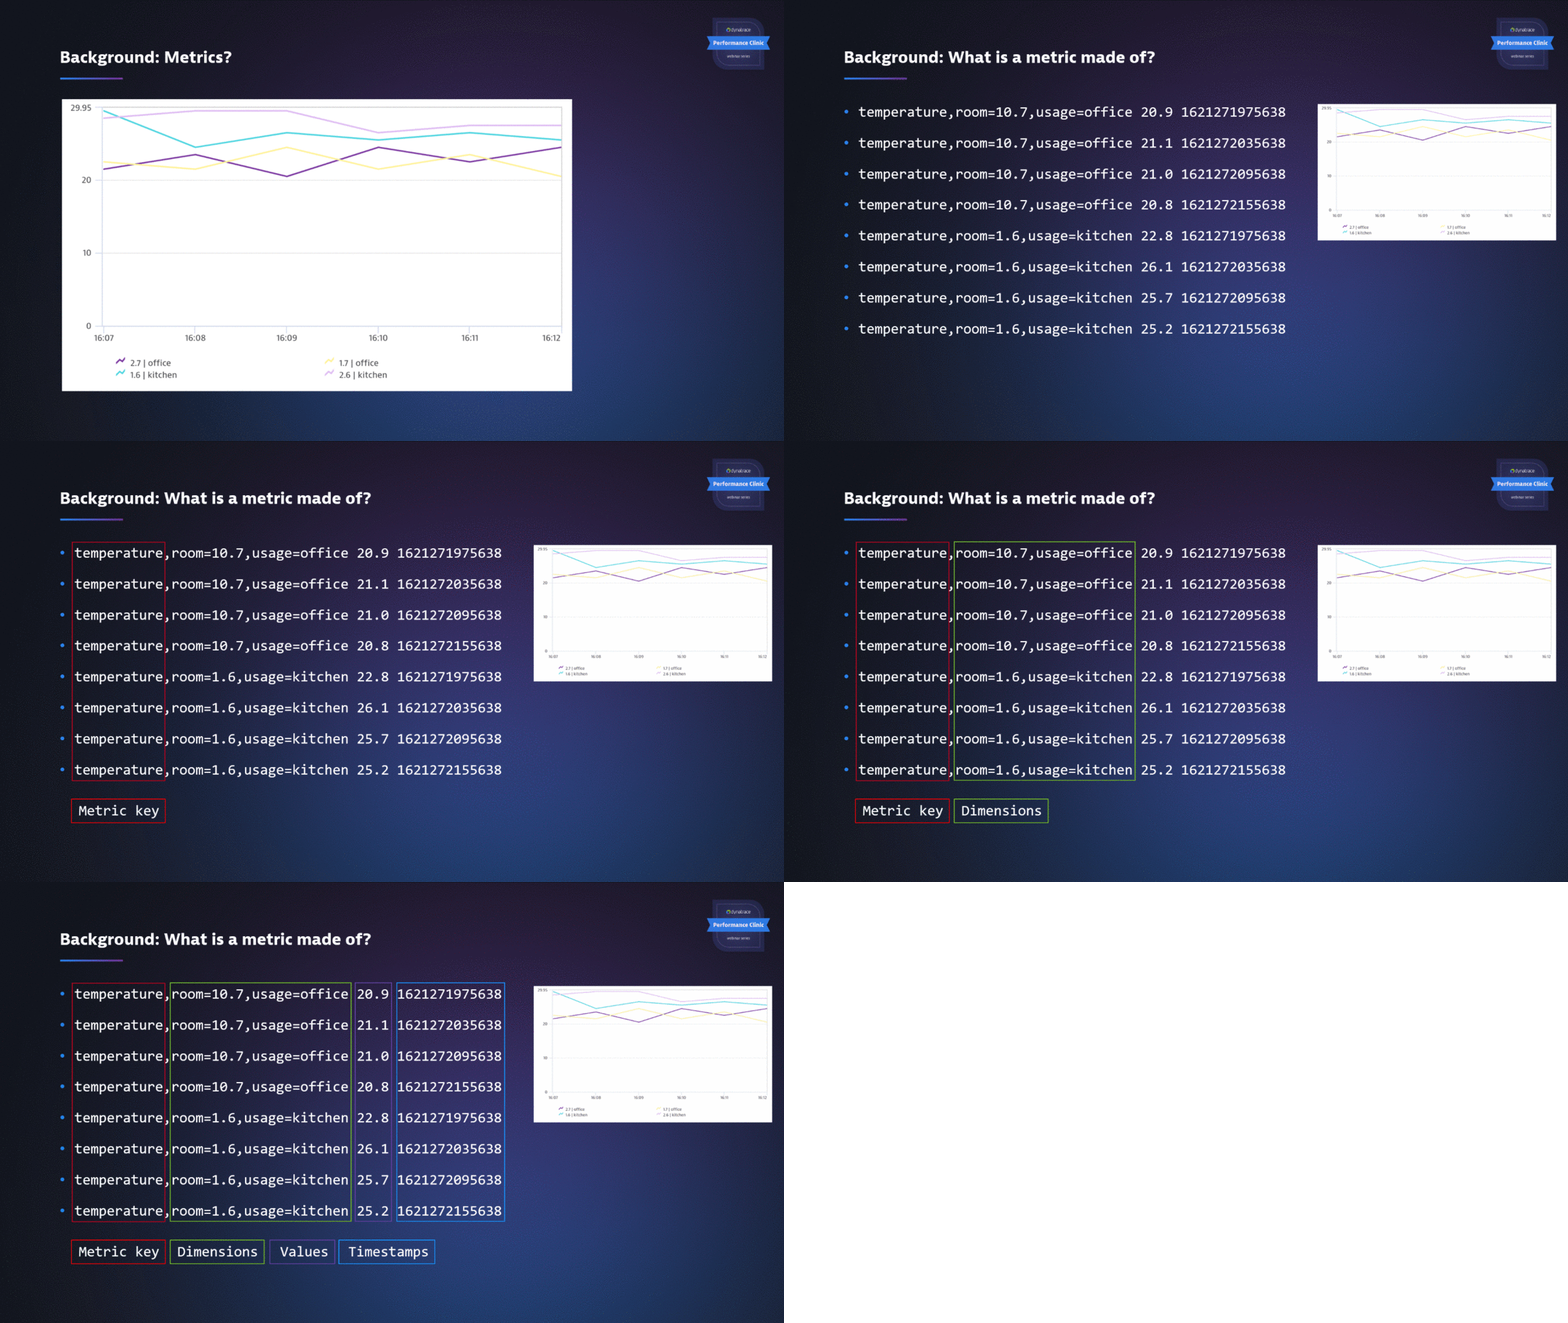
Now we know what a metric is made of and how the individual metric data points can be defined with multiple dimensions and for a certain timestamp, the question is: How can we select specific metrics, aggregations, and dimensions?
What is a metric selector?
The metric selector is there to select what values we want to query for a metric. Philipp built on his temperature example and showed what is returned when specifying metric key, operator, and dimension as part of a metric selector:
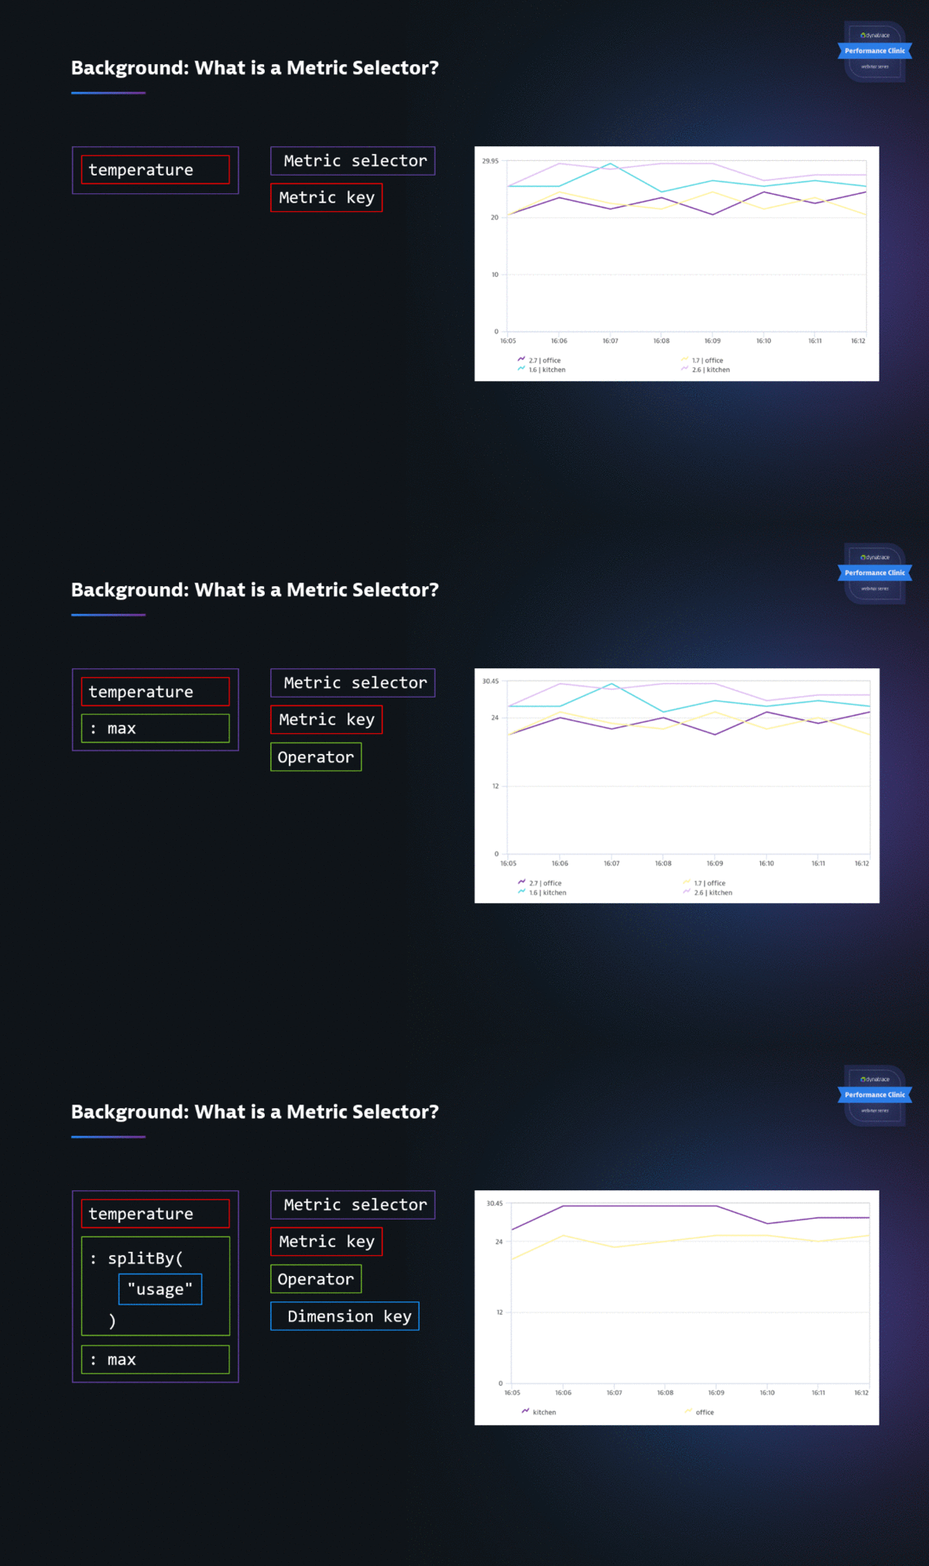
The example above just covers the very basics. I suggest you look into the metric selector documentation where you see all available transformations (e.g: aggregation, filters, merge, split, rate …)
From metric selector to metric expressions
While the metric selector is already powerful on individual metrics, metric expressions give you the option to derive new metric results from existing metrics. Here are three examples Philipp brought up that are available through metric expressions:
- Calculate the number of inactive users by subtracting active from users total
- Convert revenue from USD ($) to PLN (zł)
- Invert the percentage in builtin:host.cpu.idle to get a CPU utilization percentage
This is possible with metrics expressions. In his live demo Philipp walked us through several examples like converting Celsius to Fahrenheit or calculating transaction rate metrics:
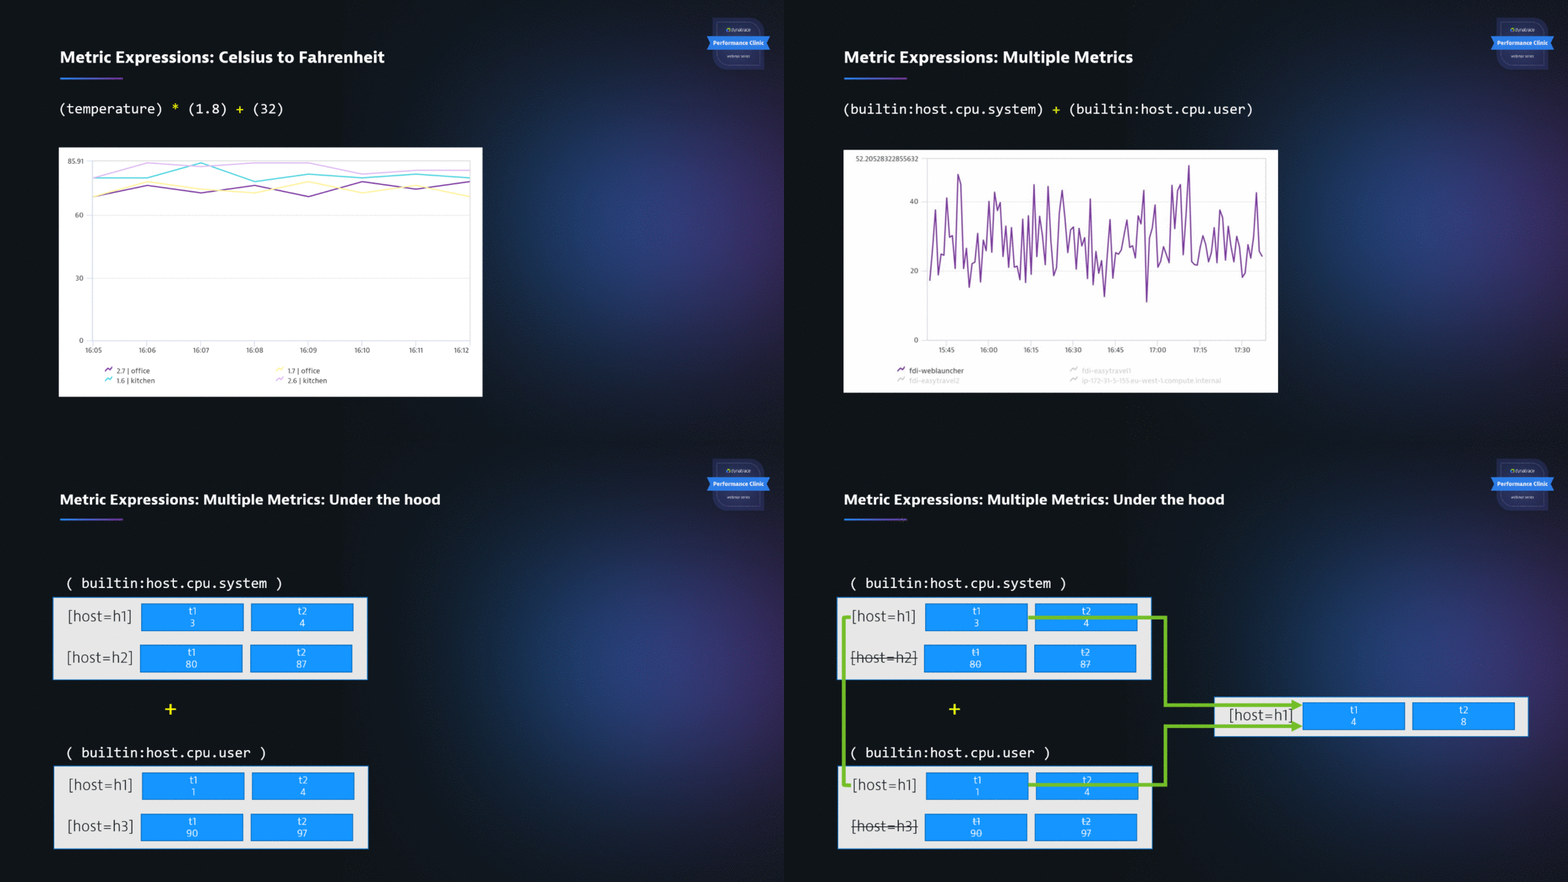
Make sure you watch the live demo and see for yourself how powerful metrics expressions are.
Where to start?
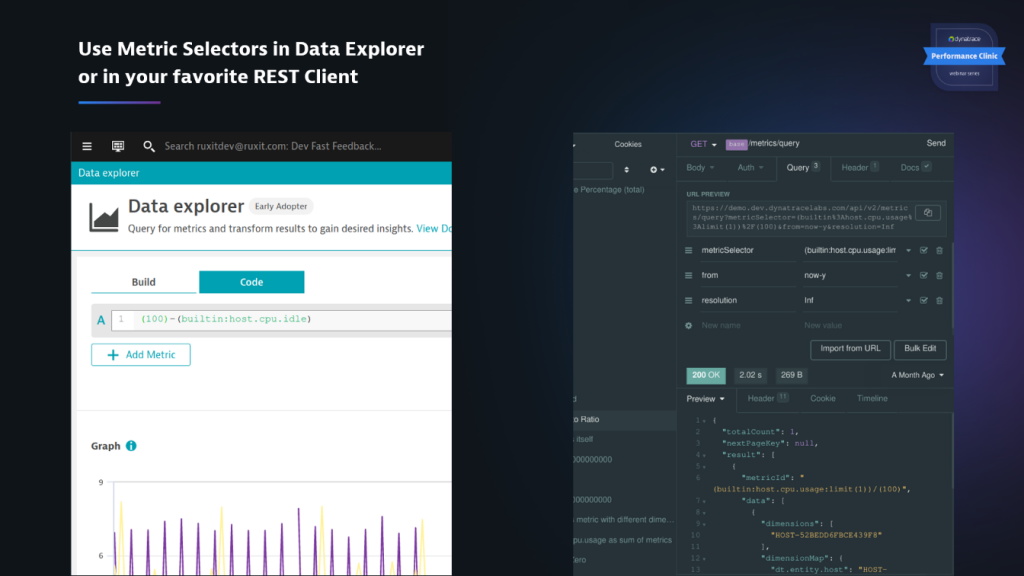
A great way to start is the Data Explorer. It provides a code tab where you can use the smart text field to guide you through creating your metric expressions. In his demo, Philipp used the data explorer to create a metric expression and then use that expression to query the data through the Dynatrace Metrics API v2.
There is so much more Philipp demoed in the 30 minutes tutorial, so be sure to watch it on our YouTube channel or through Dynatrace University. If you don’t have Dynatrace simply sign up for a Dynatrace trial and try those examples yourself.
And, there’s more to come! Soon, we will be digging deeper into all the filter options as they are very powerful to query metric data based on data conditions. Stay tuned!
A special thanks to Philipp who didn’t shy away from my request to show his work in a video tutorial. I encourage other Dynatracer’s or community members to show what they love about Dynatrace. Sharing how you think Dynatrace makes working with data easier will benefit our global community.




Looking for answers?
Start a new discussion or ask for help in our Q&A forum.
Go to forum