In part one of this series I’ve covered the automatic roll-out of the OneAgent to thousands of hosts and the autonomous setup of Dynatrace environments in a large global Dynatrace Managed installation.
A quick recap: I’ve managed a global Dynatrace Managed installation consisting of several clusters, each hosting up to thousand individual environments. All of these environments were monitored and fully managed, standardized in configuration and setup, and integrated with a service providers landscape and operational tools.
In this part, I want to cover how I managed to consolidate all the API endpoints of all these Dynatrace environments under a single entry-point. I wanted to leverage Dynatrace’s Environment APIs, for example to export timeseries data, get problem stats, or change configuration settings, like enforcing a certain data privacy setting. To do that, we need an easy and efficient API access to all of our Dynatrace Environments, without having to create and maintain API access tokens of individual tenants.
Consolidating the APIs
For a number of reasons, I didn’t want to manage each tenant’s API access individually, or every integration which needs access to a tenant’s API had to maintain its own token management. I also wanted to enable simple use cases like fetching a “global” problem view across all tenants in real-time, like the screenshot below. (I’ll cover the details of the implementation in the third part of this series)
It was pretty clear something like this wouldn’t work by simply iterating through all individual tenant APIs, fetch the problem status of one environment and then move on to the next. It wouldn’t scale and it wouldn’t perform either.
Instead of that, I was thinking of creating a single API point that is:
● Easy for me to get API responses from multiple tenants with only one request
● Able to span multiple Dynatrace Managed Clusters
● Self-maintaining the rotation of Dynatrace’s API tokens
● Highly parallel and performant for any API call and doesn’t introduce much overhead
● Independent of any changes to the original Dynatrace APIs and mimics them
● Able to detect and adopt any new or removed Dynatrace Environment automatically
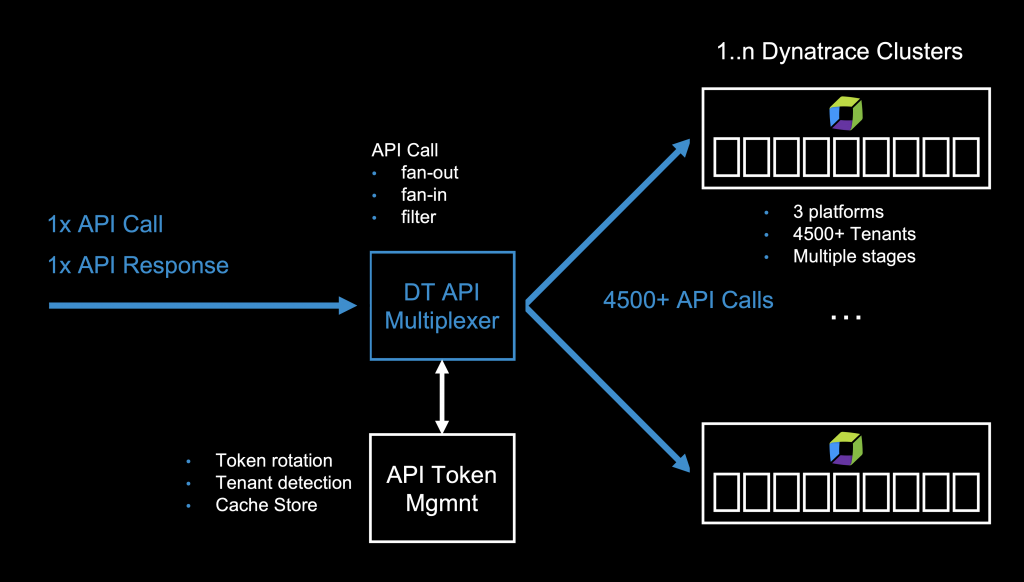
This “API Multiplexer” (or consolidated API) would be the foundation for maintaining my large Dynatrace Setup. It would definitely make my life easier! One call to this API would distribute the call to many tenants, execute and collect responses in parallel and then return only one result. This is called a fan-out/fan-in approach.
The functional requirements for such a fan-out/fan-in service are simple:
1. Receive a HTTP request (incl. parameters and payload)
2. Replicate and execute the request to multiple endpoints in parallel
3. Collect the responses of all endpoints
4. Combine the responses into one and return it to the caller (add additional meta-info)

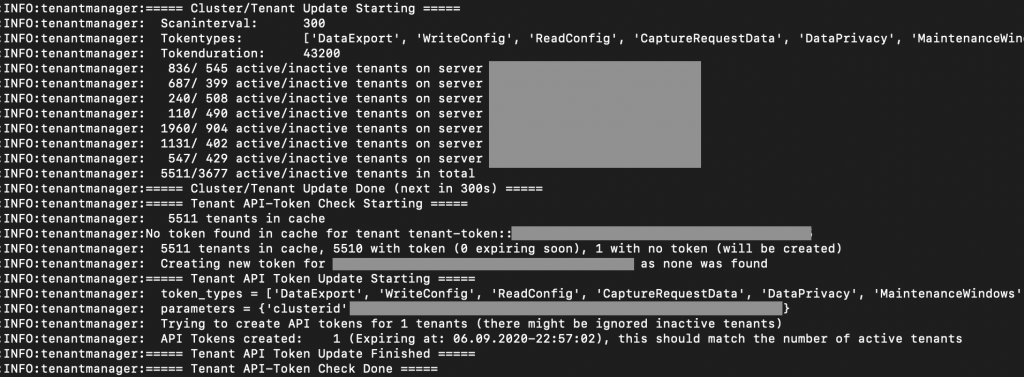
To make this work, I needed to find a way to manage the individual API tokens of every Dynatrace Environment. And, the API multiplexer must be able to use the right tokens for the right tenant API endpoint. This would also mean I need a service that detects any new environments, creates API tokens for them, refreshes API tokens on expiry and ensures that there is always a valid API token available.
I wanted a rather lightweight design that is yet versatile. So, I came up with four services that will be needed:
● TenantManager: responsible for detecting all/new/removed Dynatrace environments on multiple Dynatrace Managed clusters
● TenantCache: a cache to store tenant information and API token information and semi-permanent data to avoid unnecessary roundtrips
● ApiGateway or multiplexer: the logic for distributing requests and collecting responses from the actual Dynatrace APIs
● ApiProxy: a http proxy which would handle SSL encryption and authentication/authorization
TenantManager: Managing API tokens by the thousands
For security reasons you should change your API tokens from time to time. This is the task of the TenantManager service, and it scans all my Dynatrace Clusters every five minutes for any active tenants and then creates or refreshes tokens for these tenants. These API tokens are then stored in a local cache (the TenantCache using Redis), alongside with other rather static information of the environments:
● tenant-url: on which Dynatrace Cluster the tenant is located
● tenant-token the current API token to use

I also needed an efficient way to get information only for a subset of tenants, so I decided to use structured Redis keys that will allow me to do some filtering of queries when retrieving data. e.g. querying the TenantCache with wildcard keys would only return all the endpoints of all staging environments in our DC1 clusters.
127.0.0.1:6379> keys tenant-url::*::dc1::*::staging::*
1) "tenant-url::v10::dc1::abc-s1::staging::abc"
2) "tenant-url::v10::dc1::def-s4::staging::def"
3) "tenant-url::v10::dc1::ghi-s1::staging::ghi"
4) "tenant-url::v10::dc1::jkl-s1::staging::jkl"
5) "tenant-url::v10::dc1::mno-s1::staging::mno"
6) "tenant-url::v10::dc1::pqr-s1::staging::pqr"
7) "tenant-url::v10::dc1::stu-s1::staging::stu"
A high performance API gateway multiplexer
With those services in place, we can dynamically create requests to our tenants’ API with the right authentication token by just requesting it from the cache, depending on which tenant we want to access.
For the ApiGateway service the non-functional requirements of high parallelism and high performance led me to the decision to implement this in golang.
Go has parallelism built in, it natively brings support for accessing API and it’s quite fast. Although there are tons of API gateway libraries for golang out there, most of them are designed for a different use case. So, for simplicity I decided to go with the native net/http support in go and purpose-build my own API multiplexer.
Concurrency, fan-out, fan-in
The key for high performance is concurrency. Go brings built-in support for that and has concepts for distribution, synchronization and communication. If you want to know more, I can recommend to take a look at Concurrency in Go.
The Fan-Out/Fan-In pattern is nowadays found when building serverless functions for high scalability. You might also call it divide and conquer which has been around even before serverless existed. I found a good read here.
Using channels for communication/synchronization and the concurrency of the “go” statement I was able to create the API multiplexer with less than 500 lines of code. In fact, go’s concurrency was so efficient that I ran into a few pitfalls I didn’t think of first:
● When doing massive-parallel HTTP calls, it’s really easy to “kill” a linux-kernels TCP stack with concurrent open connections. As I’m running everything in docker containers, I had to increase the soft and hard limit for open files within the container to allow enough TCP connections.
● Changing the default maximum connections for the go http client (net/http) to a higher number of MaxIdleConnsPerHost of 8000
● The high concurrency in executing requests also means a high number of concurrent connections to Redis (to get API tokens). I had to tweak the Redis client (redigo) settings a bit to find the best settings (for MaxIdle, IdleTimeout and MaxActive)
Once these limits were raised, it was an easy and quick implementation and the multiplexer was working well. I almost couldn’t see a difference between calling a single tenant Dynatrace API endpoint directly or many via the Consolidated API!
Filtering API endpoints
Of course, you don’t always need/want to distribute every API call to the ApiGateway to all Dynatrace tenants. So, I added some parameters to selectively filter out endpoints/tenants. This is where the Redis key structure I mentioned above comes into play.
By providing http parameters, the ApiGateway can filter the list of tenant endpoints it will distribute the requests to. That way I can even call a single tenant or a specific subset of tenants.
A request to the API gateway would – besides the standard parameters of the Dynatrace API – also accept these additional parameters: type, clusterid, tenantid, stage.

These parameters are then combined into the cache key to query the TenantCache. The filtered result-set returned by Redis is then used for creating the “fan-out” requests to the Dynatrace APIs.
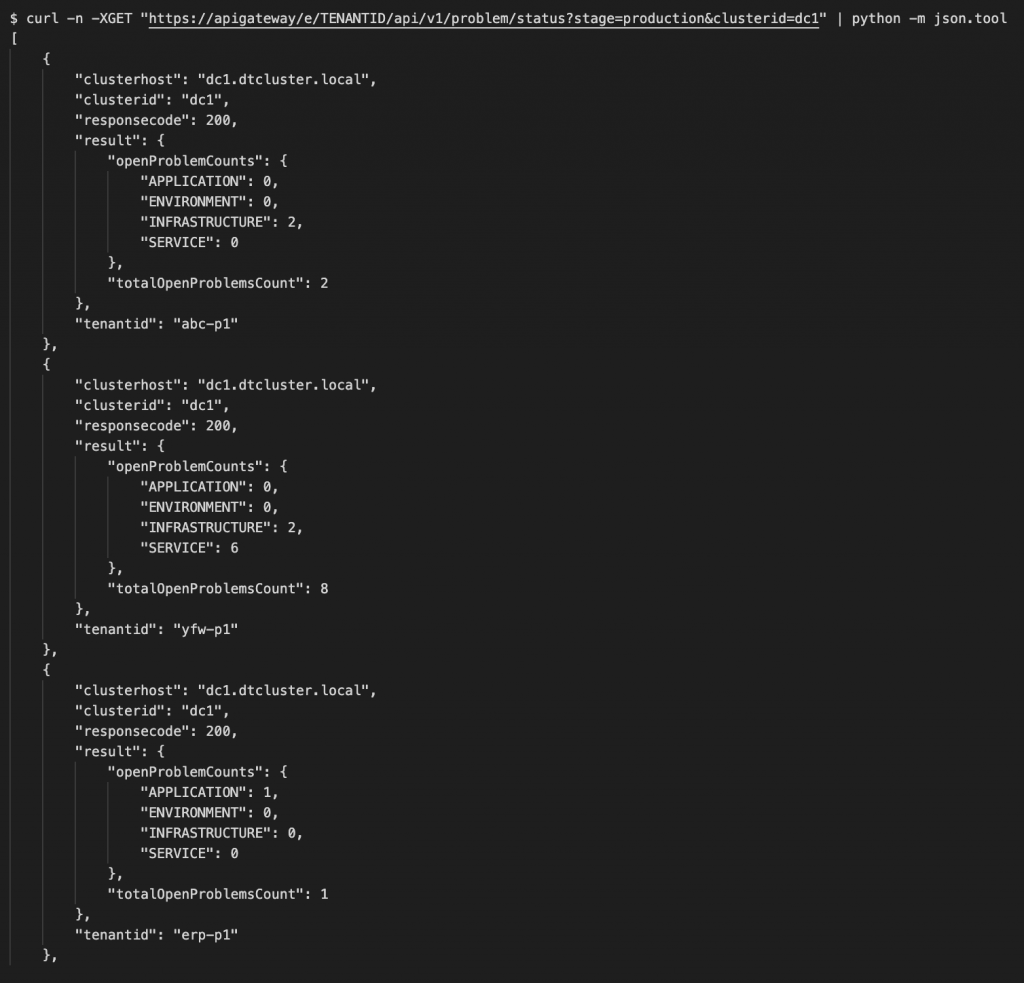
For example, to call the problem status API endpoint I can do a single request, filter it by clusterid and tenant stage and I will get all the problem status responses of all my staging tenants on this cluster’s tenants:

Are there any caveats?
Now the big question is – does it really scale? Is it really performant? Are there any side-effects? Will the Dynatrace API get overloaded/trashed by so many parallel calls? Could I kill the Dynatrace API with one call that is replicated a thousand times?
No, I didn’t break the Dynatrace API with too many requests. But I also implemented some limits in the ApiGateway’s parallelism to not request more than thousand requests in parallel.
When you look at the above API call result you will notice that the response looks a bit different:
1. The response is always an array; every tenant-response is encapsulated.
2. The ApiGateway adds additional fields (clusterhost, clusterid, tenantid, responsecode) to the original response – required to be able to identify later where the response came from and if it was successful.
As we need to provide a status of the individual tenants (HTTP status code) we can’t simply return that on the original HTTP status response – this will only use HTTP 200 (OK) or HTTP 207 (multi-status) if some tenants returned a different code than others.
If you’ve already implemented API clients that talk to the original Dynatrace API, you would need to change them a bit to handle the different response.
How performant is it?
It’s incredibly performant. If you’re already managing 10s or 100s of environments, I wouldn’t want to live without this way of accessing the APIs – it made my life a lot easier! For example, fetching the problem status of almost 1,000 environments, from seven Dynatrace Clusters, distributed across the globe takes a second:

This made way for some interesting ideas like the screenshot I showed you in the beginning – visualizing the problem status across all Dynatrace environments and even more …
Food for thought
I’ve gone through some very technical aspects of the Dynatrace APIs and details of my architecture, which allows me to manage a large Dynatrace Managed Setup. Although this has been a long read, it’s the prerequisite for a lot of cooler things that we can do now with this in place.
Stay tuned for the other parts of this series, where I will go through some examples how the consolidated API enables me to keep track of all my environments and how it helps me to create some fascinating integrations, like implementing a meta-analysis on top of Dynatrace’s event API, anomaly detection configuration tweaking or a full-blown configuration management stack and configuration auditing.


Looking for answers?
Start a new discussion or ask for help in our Q&A forum.
Go to forum