Get the most out of all your dashboards with our newly added features and gain full control over your dashboard's underlying schema with the advanced JSON editor.
Dashboards are an important tool for effectively monitoring diverse IT ecosystems and for reporting your key performance indicators. But the more components you monitor and the more reports you build based on those insights, the harder it becomes to maintain oversight over the number of dashboards needed to perform all these tasks.
Dynatrace helps you with this in a few ways. For one thing, you can rely on the Dynatrace Davis® AI causation engine for effective monitoring (rather than manually checking dashboard tiles). Davis automatically monitors your IT ecosystem for you. If something goes wrong, Davis will tell you exactly what happened. But if you still want to use dashboards for more detailed insights, as of version 1.192, Dynatrace now also provides you with a revamped dashboard overview that comes with a number of important improvements so you can effectively use all your dashboards:
- Rich filter capabilities give you a better overview of your dashboards.
- Tags help you better segment, find, and understand the purpose of any dashboard.
- The JSON editor gives you full control over your dashboard’s underlying JSON schema.
Get a better overview of your dashboards by filtering
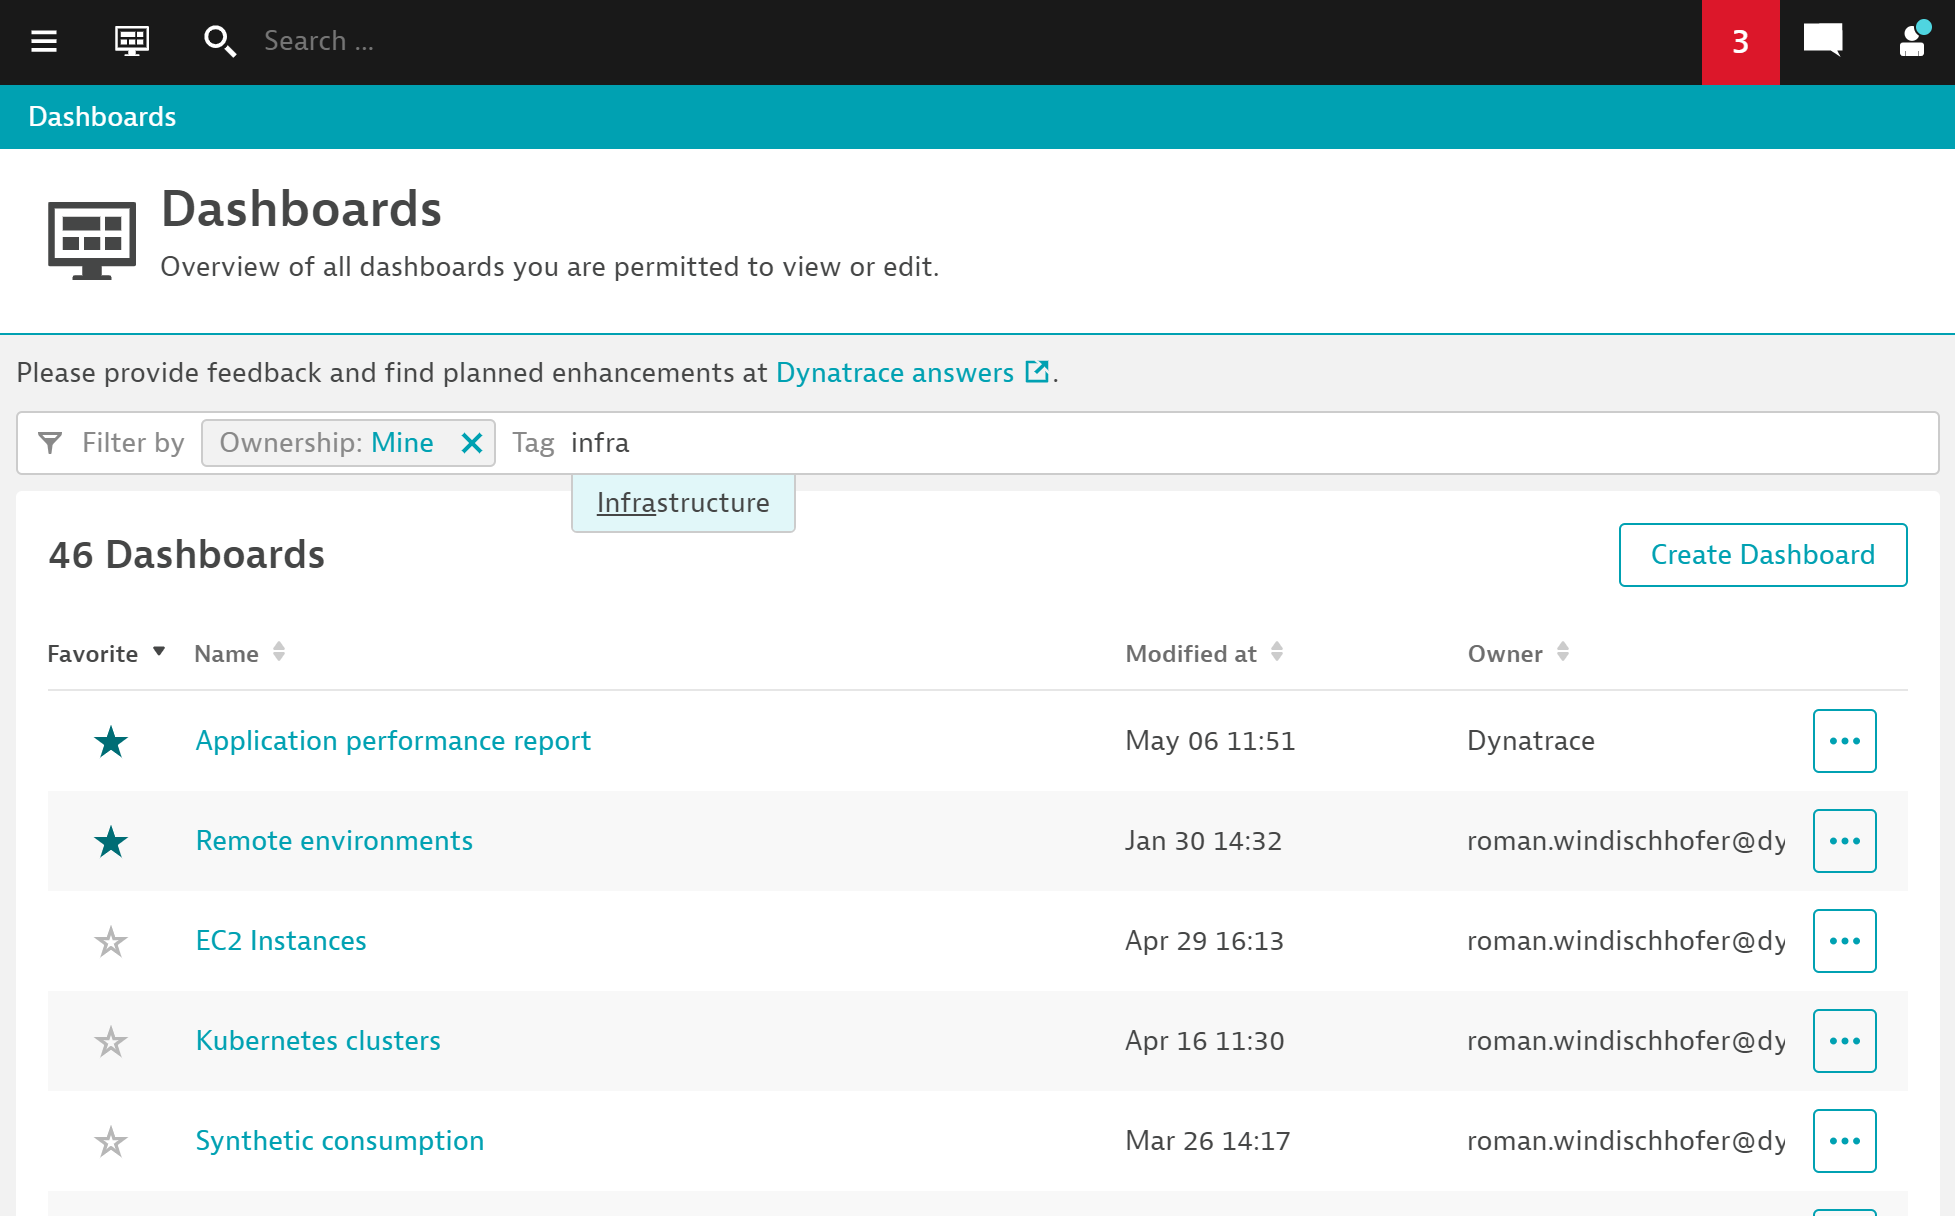
The new dashboard overview supports rich filter capabilities. Each filter, whether on its own or in combination with other filters, helps you find and manage dashboards any way you like.
- Name: Filter for any dashboard name that contains the filter expression.
- Ownership: Filter for Mine or Shared with me.
- Favorite: Filter for favorites or other dashboards.
- Owner: Filter for dashboards of a specific user.
- Tag: Filter for dashboards that have a specific tag.

Easily find dashboards by tagging and marking them as favorite
In order to give dashboards a little more context, we’ve introduced dashboard tags. Tags help tremendously in better segmenting dashboards for easy searching and retrieval. Every tag on any dashboard in your list is available for filtering (see image above). You can even filter for a combination of tags by applying the Tag filter repeatedly. Your search becomes more precise as you provide more filter criteria.
Adding tags is as simple as editing your dashboard. Add any reasonable information that will later help you and your colleagues to better understand your dashboard’s purpose.

Another tool you should make use of for important dashboards is the Favorite option. Now you can mark your dashboards as favorites by selecting the star button next to a dashboard name on the list or on the dashboard itself. Favorite dashboards always show up at the top of your list by default. Favorites are a per-user setting and are therefore helpful for ordering the dashboard list based on your personal preferences. The Favorite criterion is also available as a filter expression.
Gain full control with the advanced dashboard JSON editor
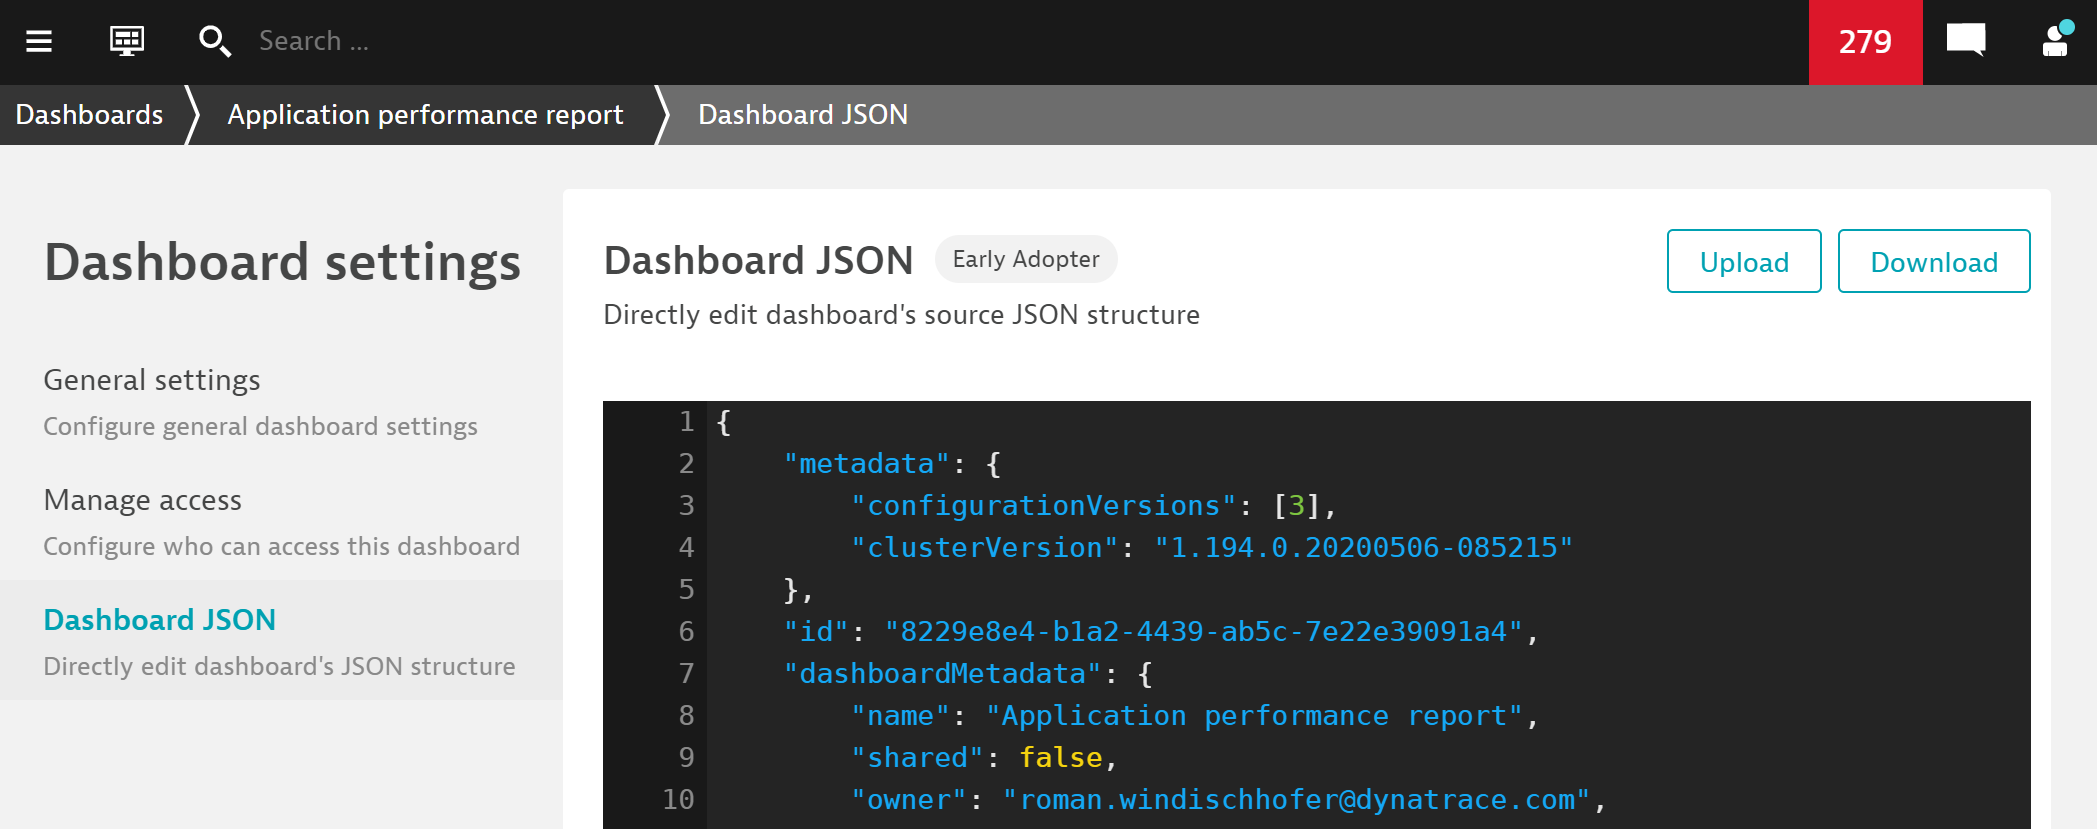
As dashboard management is continuously evolving towards automation, we wanted to give our rich dashboard API capabilities more visibility. In the Advanced settings section of your dashboards, we’ve now added a powerful JSON editor. With this, you can now:
- Perform live changes on a dashboard’s underlying JSON schema.
- Directly edit dashboard tile configurations like titles or filter expressions.
- Copy/paste entire blocks to and from any dashboard.
- Download the dashboard’s JSON structure to a file, and, in reverse, Upload a JSON file to overwrite your dashboard’s current configuration.

All these things (and more) are also available via the Dynatrace Dashboards API. The JSON editor simply bridges the gap between interactive dashboard manipulation in the UI and automation over the API. To access the dashboard JSON editor, navigate to your dashboard’s Advanced settings, as shown below:

Things to keep in mind
- The dashboard JSON editor doesn’t allow you to change a dashboard’s owner, as that could lock you out of your own dashboards by accident.
- The dashboard JSON editor doesn’t allow you to change a dashboard’s ID. When updating a dashboard as a whole by uploading a JSON file, the
IDandownerproperties aren’t overwritten.
What’s next?
We continuously invest and work on improving our dashboard offering in Dynatrace. To remain up to date, make sure to check out our pinned discussion post for planned dashboard enhancements in our Dynatrace community forum. Here’s a brief glimpse of what’s ahead:
- Dashboard templates for easier out-of-the-box monitoring and reporting
- Improved chart query capabilities for more flexible charting options
- Dashboard filters to filter tiles on a dashboard by tags and other expressions


Looking for answers?
Start a new discussion or ask for help in our Q&A forum.
Go to forum