
Fast and efficient log analysis is critical in today’s data-driven IT environments. For enterprises managing complex systems and vast datasets using traditional log management tools, finding specific log entries quickly and efficiently can feel like searching for a needle in a haystack.
Dynatrace segments simplify and streamline data organization in large and complex IT environments, providing pre-scoped data without compromising performance.
In addition to adding segments, we’ve overhauled the filter capabilities of the Logs app, introducing a new advanced filter bar.
In this blog post, we’ll explore how these features boost productivity and accelerate access to the right data sets using shortcuts like segments. We’ll also take a closer look at how the improved filter capabilities can be combined to differentiate segments.
What are Dynatrace Segments?
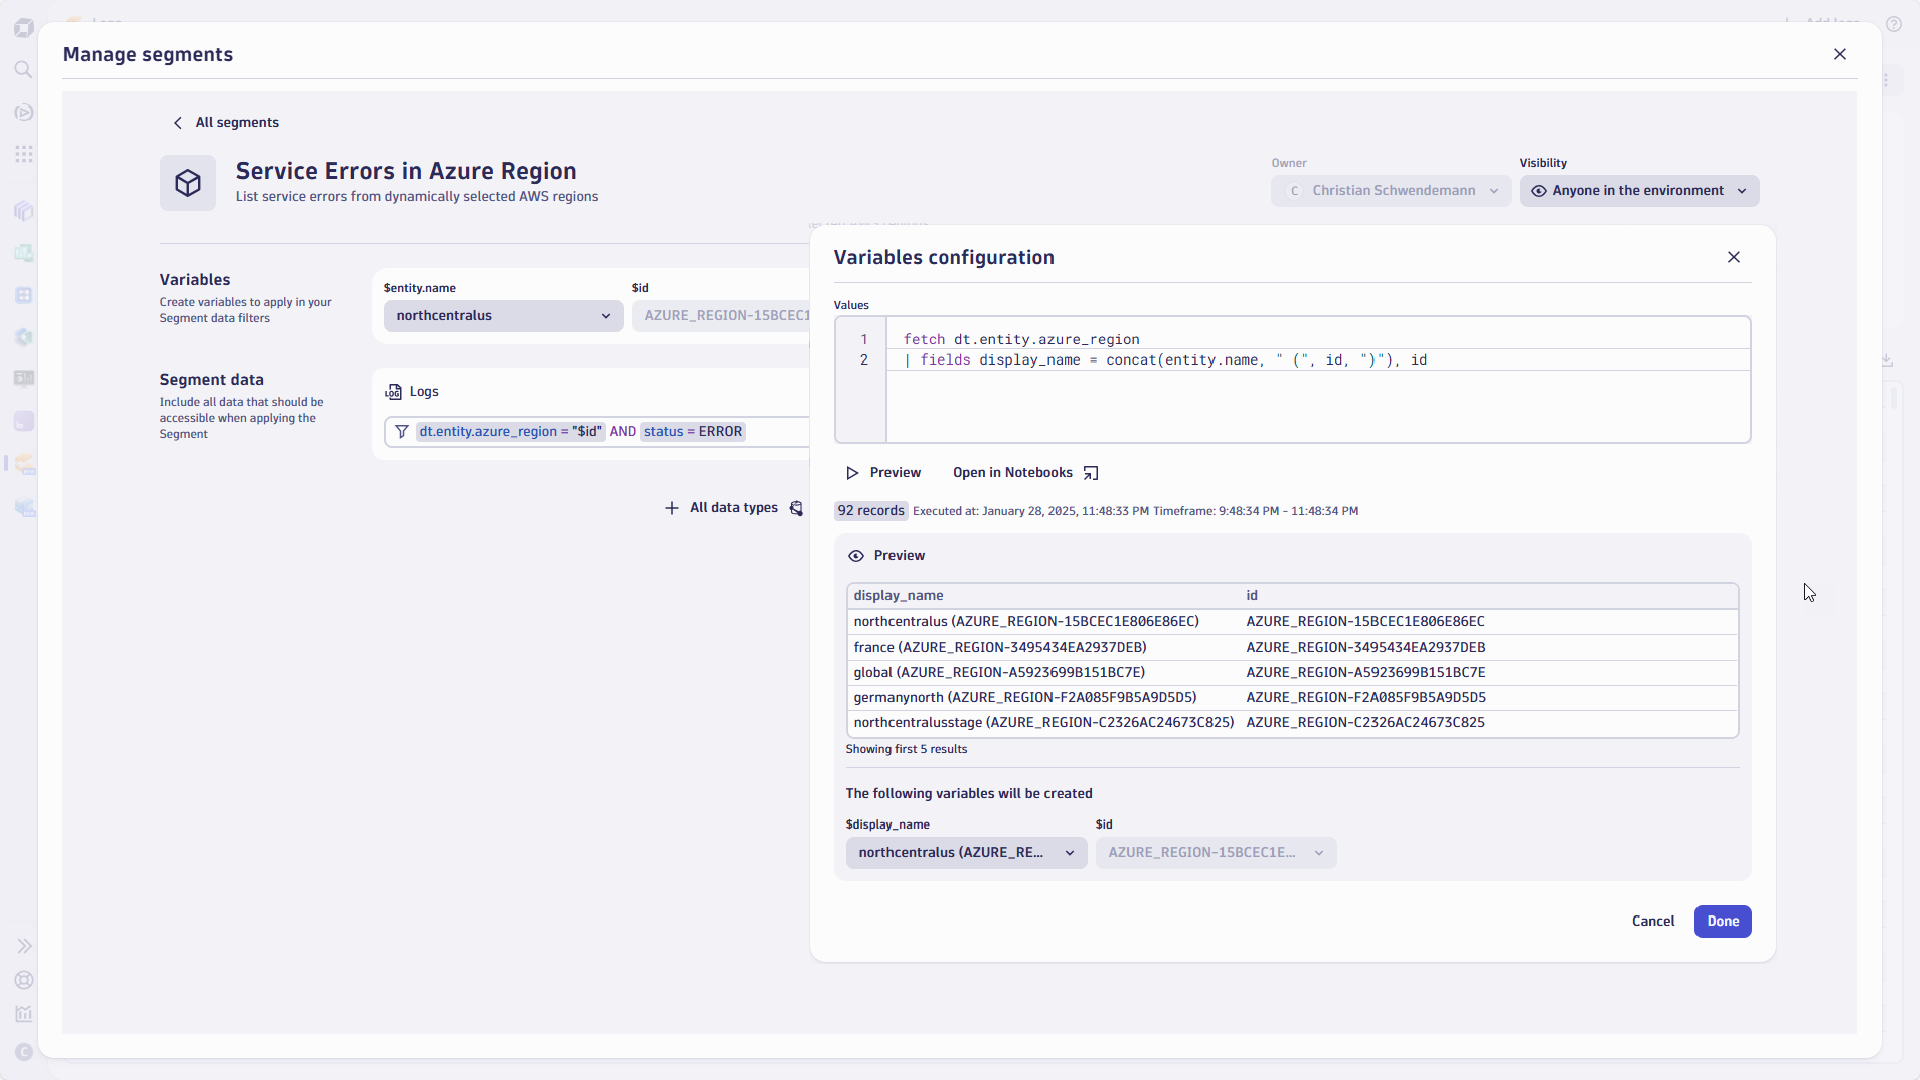
Segments are reusable, pre-defined filter conditions powered by the Dynatrace Query Language (DQL). Segments can implement variables to dynamically provide, for example, a list of entities to users, such as available Kubernetes clusters, for unmatched flexibility and dynamic segmentation.
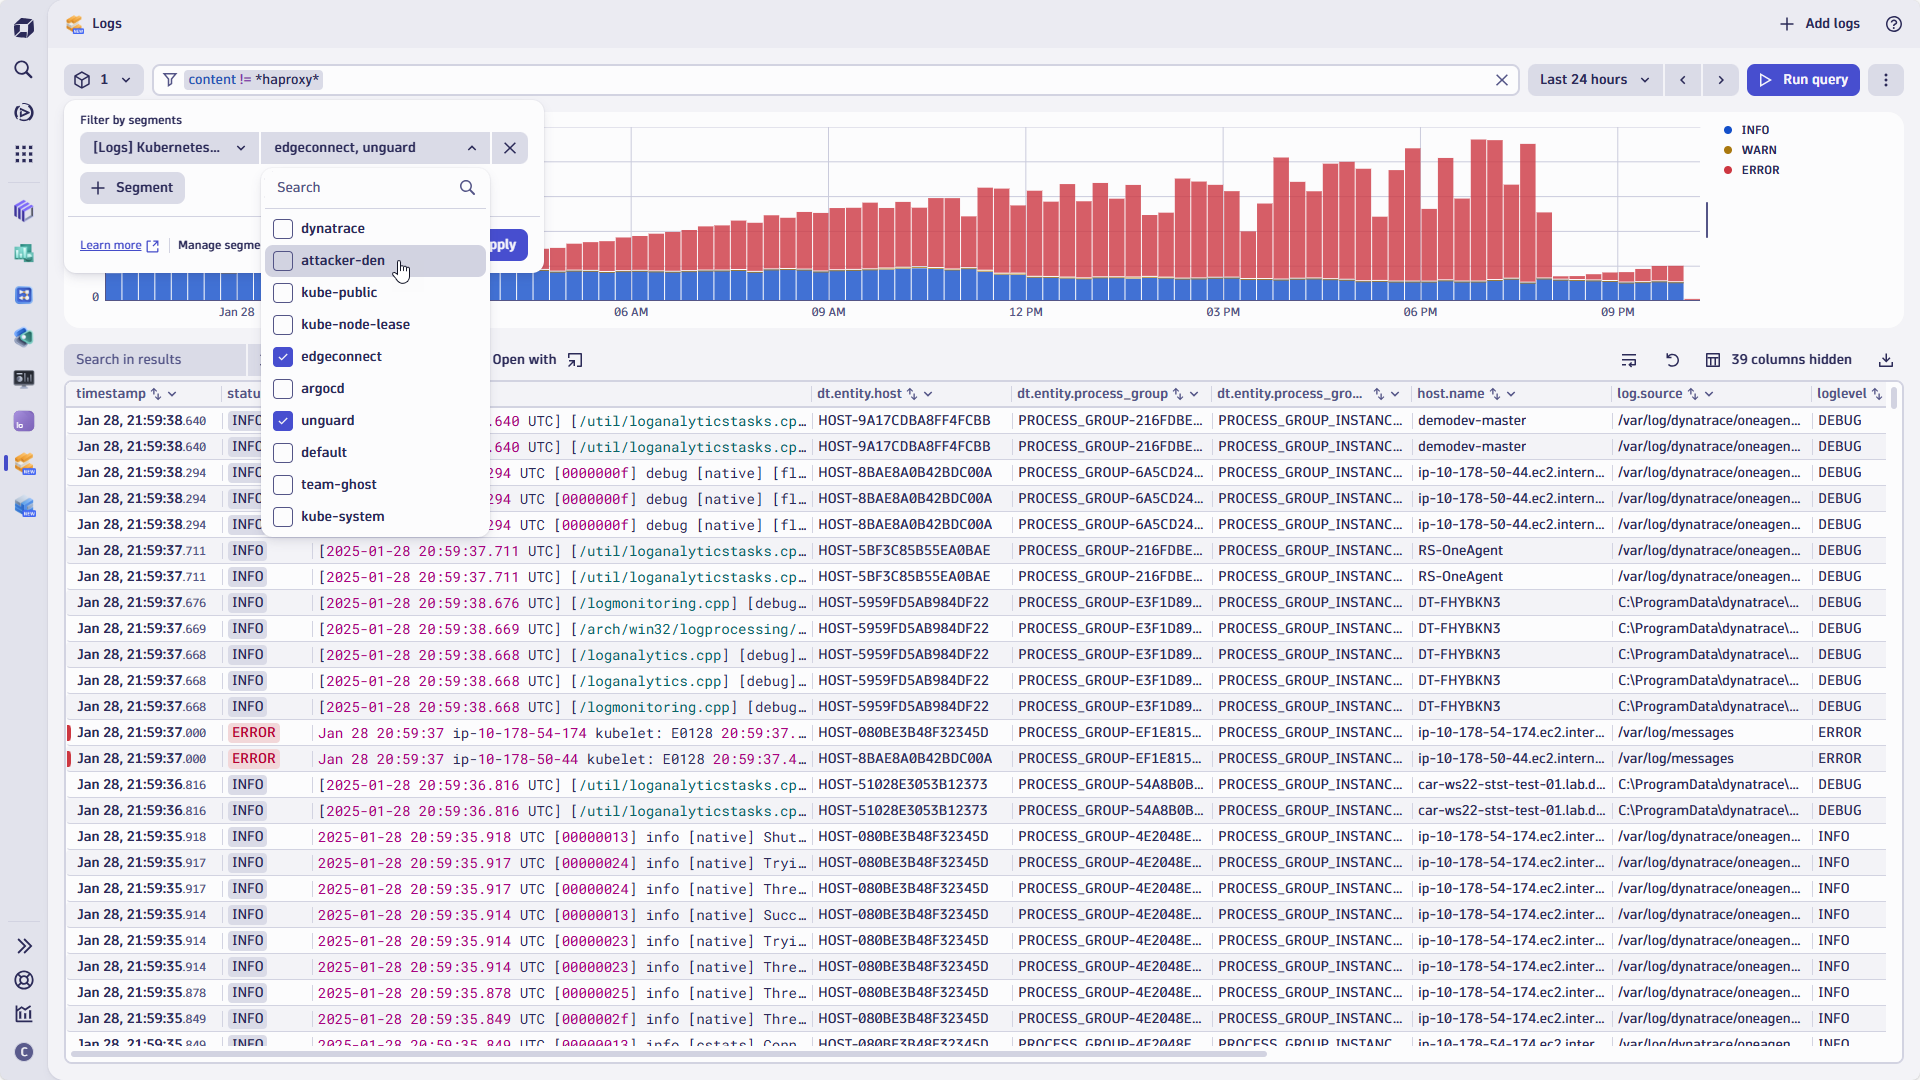
Segments focus on specific, relevant data sets across apps and data types as they’re available and applied across the Dynatrace platform. Think of segments as a feature that allows you to create views for teams, departments, or application owners—or just for yourself. With segments, you can isolate particular OpenPipeline™ log sources, resource entities, cloud regions, or even certain buckets your developers use.
Segments allow you to provide a platform-wide pre-filtered and restricted data set on which you can execute and refine additional queries using the advanced filter bar.
Here’s what Dynatrace customers love about using segments in their daily work:
- Time savings with reusability
Segments save you from manually re-applying filters for every new task, or when switching between Dynatrace Apps. For example, a segment for Service Errors in Azure Region can be applied instantly by selecting it from the dropdown. - Dynamic and flexible conditions
Segments can leverage variables (e.g., $bucket, $region, $entity_name) to adjust the context dynamically. This eliminates the need to create multiple static segments or filters for varying conditions using the filter bar.
For example, the Service Errors in Azure Region segments can provide a dynamic list of available regions instead of creating multiple fixed region segments.
Unsure if your team would rather use unique IDs or region names? Don’t worry; with the power of the DQL commands like concat you can easily address this for your users with a single line of code.
Simplified collaboration
Individual users and teams can share segments to ensure consistent filtering logic across apps, dashboards, or even business observability use cases. This fosters collaboration and alignment across departments and teams.
Optimized query performance
Segments narrow the available data scope in real time, improving query speed, reducing overhead, and helping to optimize consumption.
Use case from the field: Data segmentation and filtering Kubernetes cluster logs
Imagine your team frequently troubleshoots errors from specific Kubernetes deployments within your production environment. Instead of defining and applying filters manually each time you launch the Logs app, you can now create segments with predefined filters for:
- Environment: Create and define a segment to narrow the scope to your Production environment using specific cloud subscriptions or tags.
- AWS region: Using a variable, you can dynamically limit the scope to AWS regions selected from the dropdown.
- Cluster: Instead of combining the K8s cluster as an additional DQL filter statement within the AWS region segment, you can create another segment for the Kubernetes cluster.
The obvious benefit is that you can reuse the Kubernetes segment and combine and apply it independently or with other segments and filters.
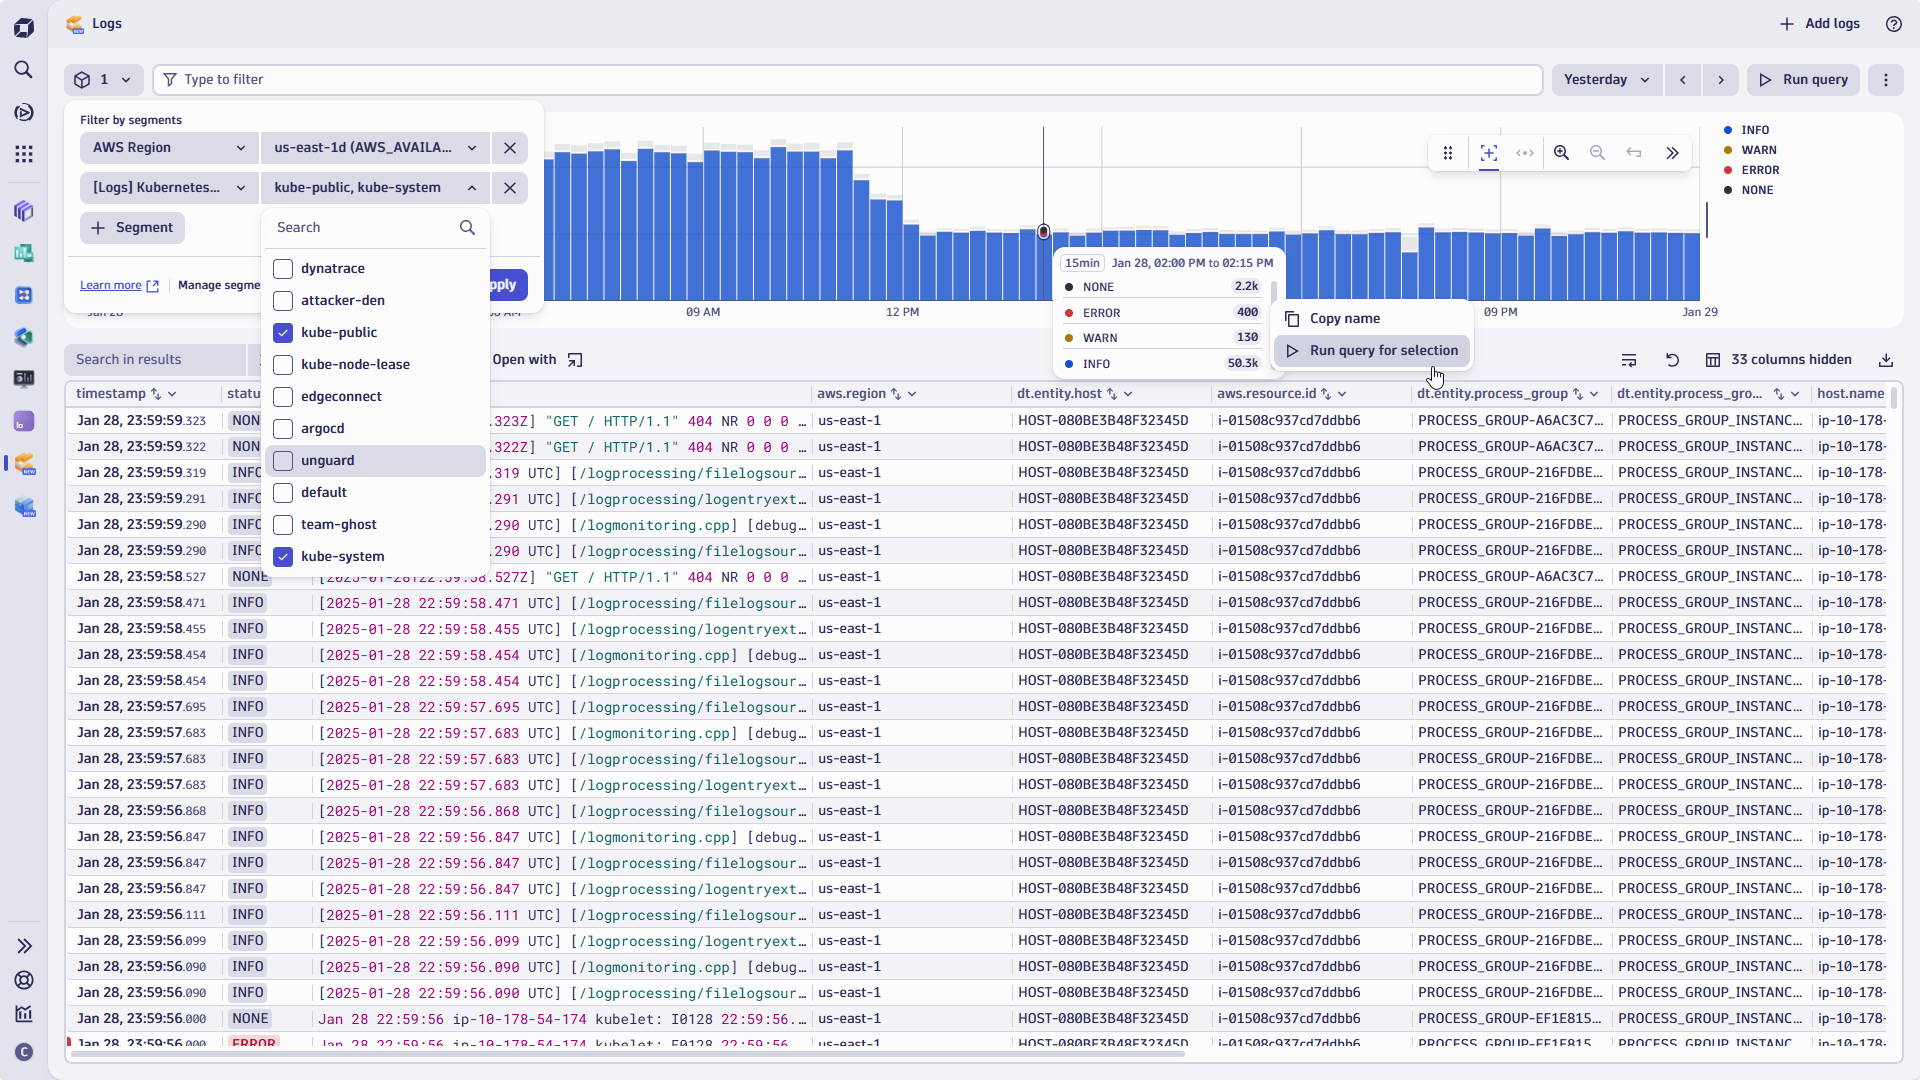
- Log level: When you and your team only want to see status = error messages for the clusters in question, you can add this to the segment’s DQL statement.
It’s easy to apply the status level as a dynamically applied filter using the filter bar or by selecting the status levels within the histogram.
If you want to learn more about the required steps, Dynatrace Documentation provides a detailed step-by-step guide to getting started with segments and logs.
Advanced filter field: Precision meets simplicity
Dynatrace offers an improved filter bar with powerful operators and dynamic suggestions for available entities. The filter field and entity value suggestions allow you to refine your search precisely, building even the most complex queries quickly.
Why Dynatrace customers love the new filter field
Logical operators (AND, OR, NOT)
You can combine multiple conditions with Boolean logic for complex queries.
For example, if you operate Kubernetes clusters in multiple AWS regions, but don’t want to see the US-based regions:
loglevel = "ERROR" AND log.source = "kubernetes" AND aws.region NOT IN ("us-east-1a","us-west-1b")
Dynamic suggestions
The filter bar provides real-time suggestions for entity parameters such as Kubernetes nodes, virtual machine names, or log pipelines provided by OpenPipeline.
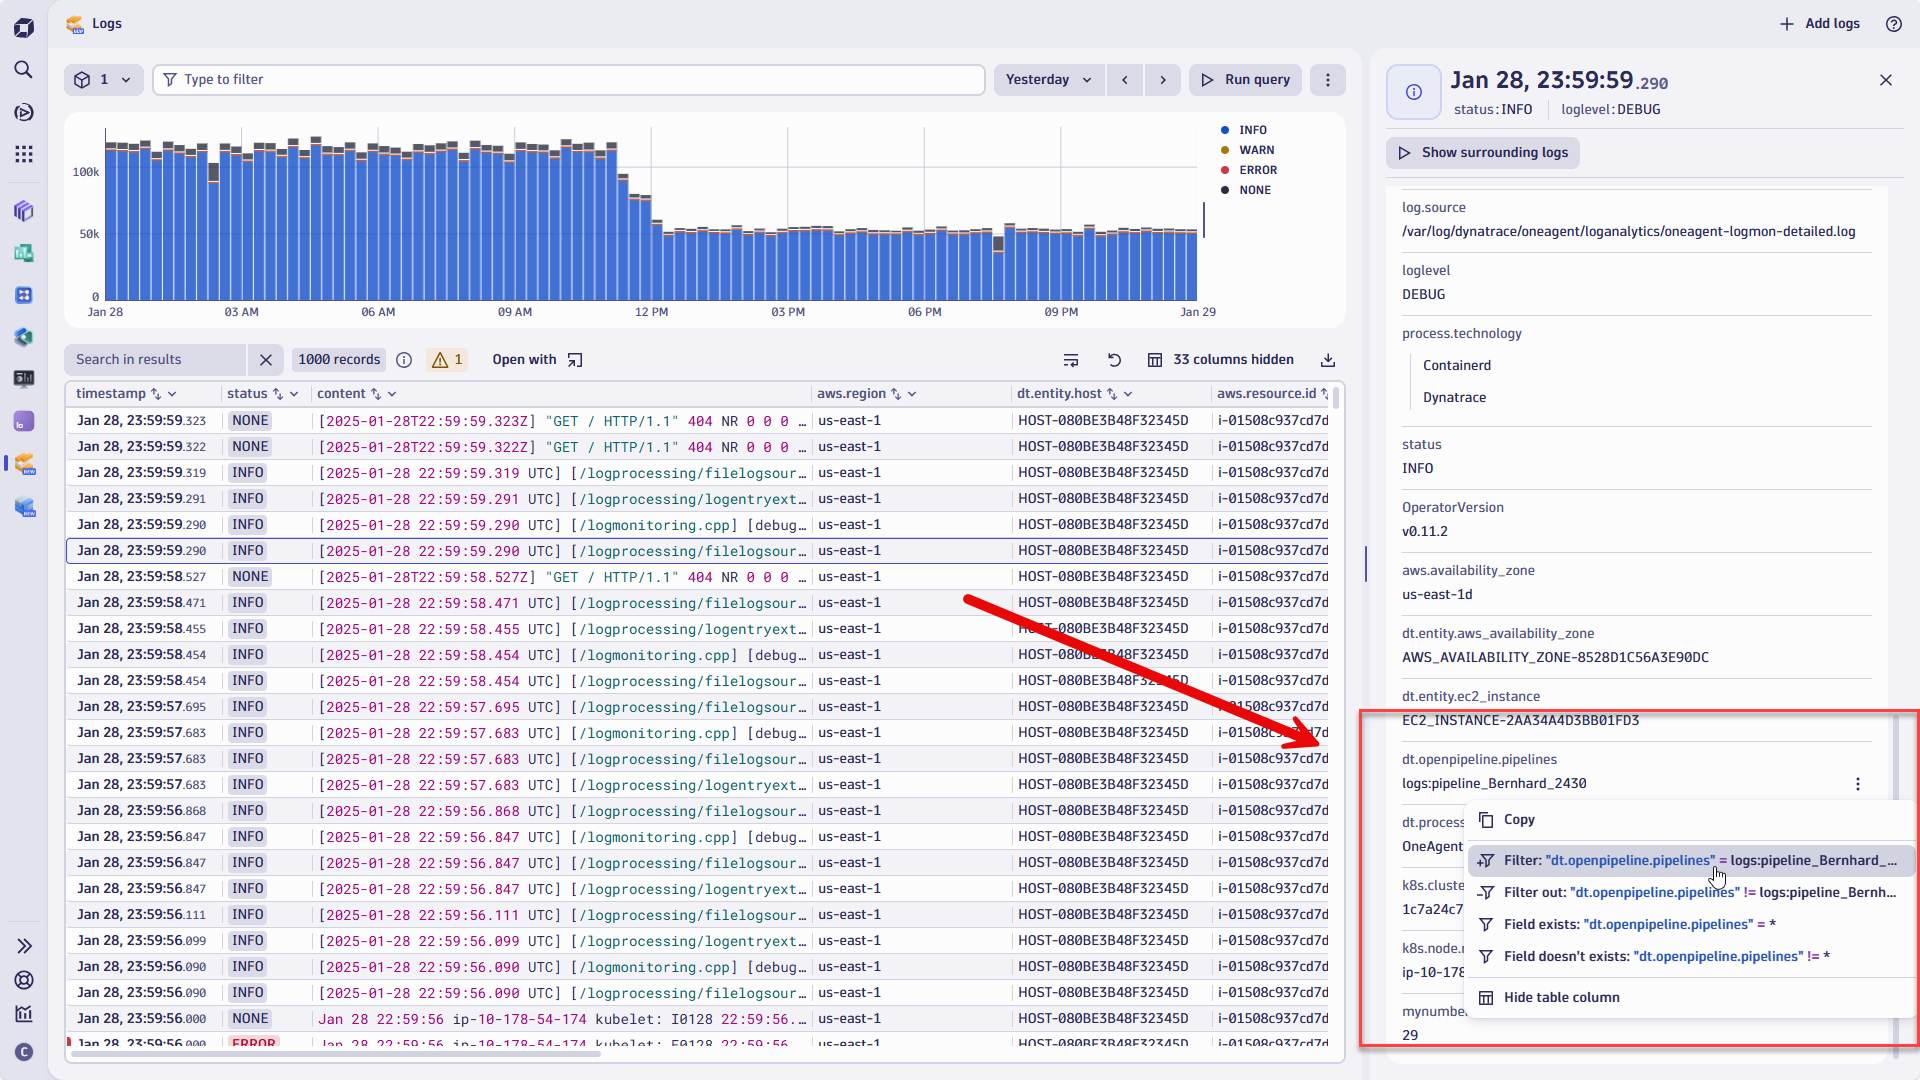
These filters can be added by typing or selecting a field and choosing whether to include or exclude it.
Entity searches
The namespaces of Kubernetes clusters and nodes can be quite lengthy. In addition to automatically suggesting results, the filter bar will suggest a list of results while also acting as a wildcard operator, so you can match multiple entities with a single query.
Field-specific operators
You can use advanced matching options, such as for tags:
host.tag in ("production", "critical", "region-x")
Use case from the Field: Filter field in action
Suppose you’re investigating an issue in a Kubernetes cluster in a dev-staging environment. The dev-staging cluster isn’t monitored regularly or included in an existing segment.
Watch this scenario in action.

Figure 5. The filter bar provides instant precise suggestions, helping you find relevant entities and resources and boosting productivity.
Combining filter fields with suggestions of available entities and values saves time and ensures accuracy in even the most detailed analyses.
Segments vs. filters: Finding the perfect balance
While both segments and filter fields help streamline log analysis, they serve distinct purposes:
Segments are usually pre-defined by power users or Dynatrace administrators and shared across teams. While any individual user can build segments, not all users have permission to share segments.
Segments provide reusable, pre-defined views that can be applied ad hoc when running queries in the Logs app. They’re available across all applications on the Dynatrace platform. On the other hand, individual users apply the Filter field on demand when they model queries.
As a best practice, you can combine segments to initially narrow the search scope to a bucket, cloud platform, region, or cluster, and then use the filter bar to run a focused query within that sliced data set.

Conclusion: Simplified, focused, and faster log analysis
Dynatrace segments and advanced filter fields bring unparalleled efficiency to log analysis while enabling an even broader set of users to make meaningful and powerful use of your data.
Segments help you ensure data consistency across teams and departments, all backed by DQL and Grail.
By enabling predefined, reusable views combined with granular real-time queries, these features empower teams to:
- Spend less time configuring filters when they use the Logs app.
- Focus on identifying and solving critical data faster.
- Ensure consistent analysis across use cases and departments.
Ready to transform how you work with log data?
Start using segments and filters in Dynatrace today to experience faster, smarter, and more collaborative log analysis.
For a deeper dive into these features, visit Dynatrace Documentation.


Looking for answers?
Start a new discussion or ask for help in our Q&A forum.
Go to forum