By defining metric-based custom events, you can leverage the power of Davis AI for your specific use cases.
Dynatrace Davis® automatically analyzes abnormal situations within your IT infrastructure and reports all relevant impacts and root causes.
Davis relies on a wide spectrum of information sources, including a transactional view of your services and applications and the monitoring of all events that are raised on individual nodes within your Smartscape topology map.
There are two main sources for individual events in Dynatrace: (1) Events that are triggered by a series of measurements (i.e, metric-based events) and events that are independent of any metric (for example, process crashes, deployment changes, and VM motion events).
This blog post focuses on the definition of events that are triggered by measurements (i.e, metric-based events) within your Dynatrace monitoring environment.
Create custom events for time-series measures that trigger Davis problem analysis or provide context for Davis-analyzed situations
By defining metric-based events, you can leverage the power of Davis AI for your specific use cases. For example, you can:
- Define your own service metric for revenue generation and define a metric-based event that will alert you if your generated revenue drops below a critical level within a given observation period.
- Annotate any of your hosts, applications, or services with an info-level event that indicates an interesting metric level, such as an unusually high number of users or service calls. Info-level events don’t trigger alerts. They are however monitored and reported by Davis in case a related problem is detected.
- Collect your own custom metric, such as the number of reports processed and written to a local folder, and raise an event if the number of processed reports falls below a specific threshold.
How to set up custom events
Custom metric events are configured globally at the environment level. This means that an event, once defined and raised, will be visible to all Dynatrace users within your environment.
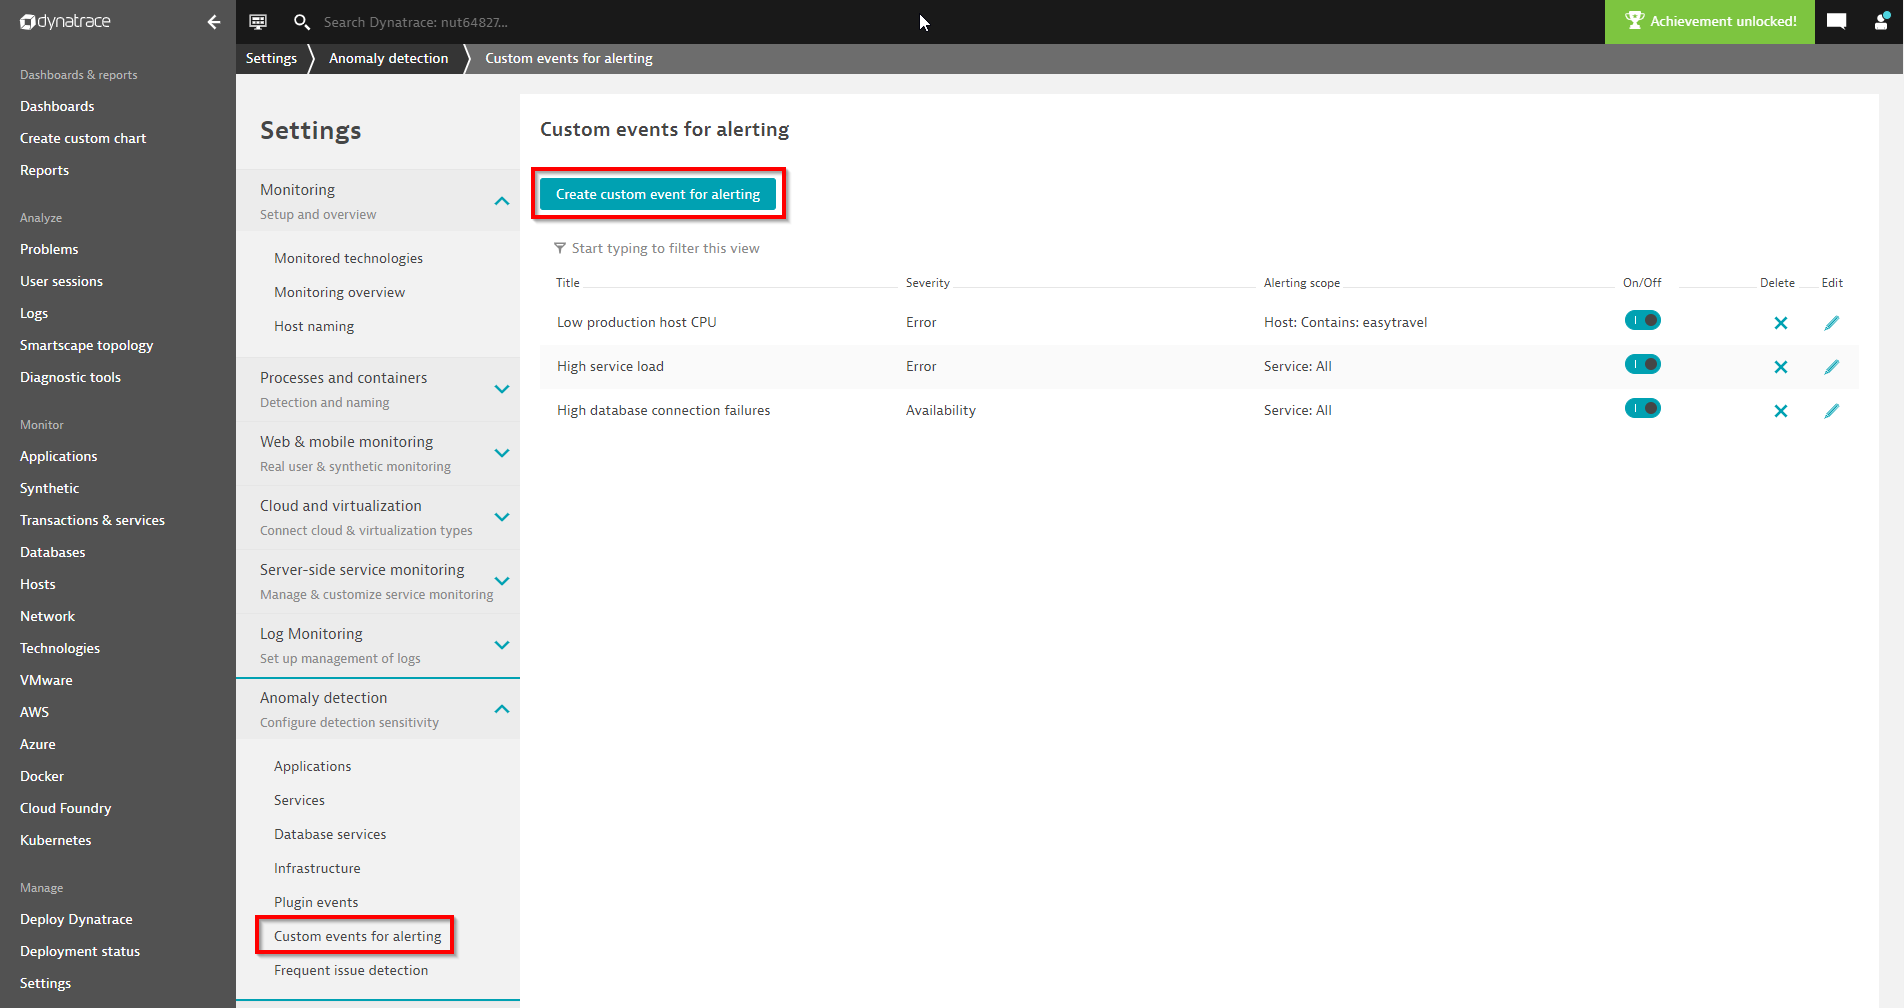
Open Settings > Anomaly detection > Custom events for alerting to define a new custom metric event, as shown below.
Click Create custom event for alerting to open the configuration screen that allows you to define a metric-based event in a step-by-step process.
Choose the title and severity of your event
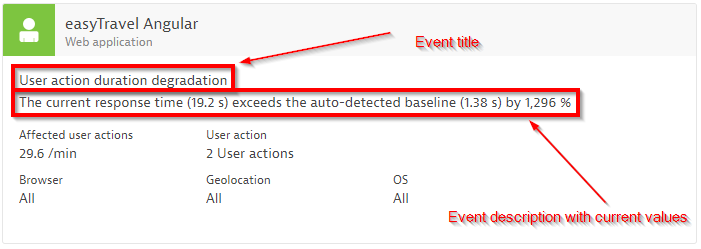
The event title is a short, human-readable string that describes the situation in an easily comprehensible way. Examples here could be, “High network activity” or “CPU saturation.” Event titles are used throughout the Dynatrace UI as well as within problem alerting.
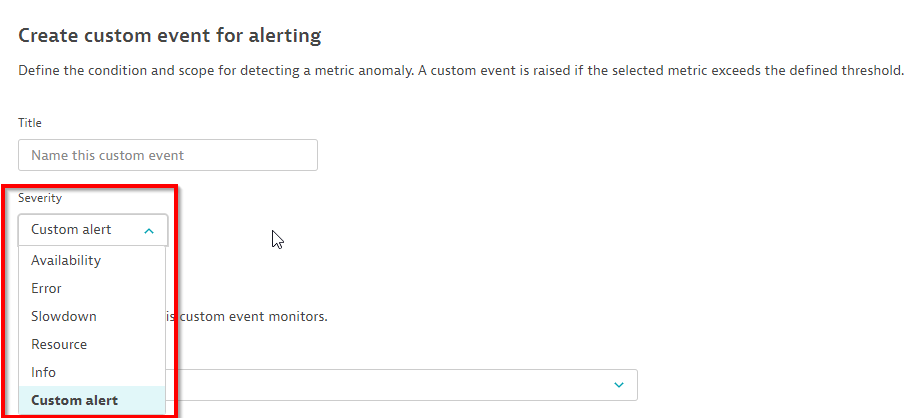
After assigning a proper name for your custom event, you must specify its severity. The severity of an event determines if a problem is raised or not and if Davis AI should try to find a root cause of the event.
The following table summarizes the semantics of all available event severities that trigger problems and are analyzed by Davis:
| Severity | Problem raised? | Davis analyzed? | Description |
| Availability | Yes | Yes | Indicates an outage situation |
| Error | Yes | Yes | Indicates a degradation of operational health |
| Slowdown | Yes | Yes | Indicates a slowdown of IT services. |
| Resource | Yes | Yes | Indicates a lack of resources |
| Info | No | Yes | Informational only |
| Custom alert | Yes | No | Alert without correlation and Davis logic |
Read more about built-in events and their severity levels in our Event types documentation.
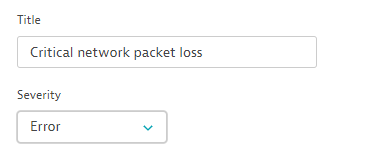
In the example below, we’ll call a new event called Critical network packet loss that has the severity level Error:
Choose the metric to monitor
One of the most essential aspects of configuring a new metric-based event is the selection of the metric and, optionally, the metric dimension that is to be monitored.
The metric picker offers a structured list of all available metrics within your Dynatrace monitoring environment. The structure of the metric categories is the same as that used when creating a custom chart on a dashboard or when requesting a metric through the metric API. For more details, see our blog post about metric selection in custom dashboarding and when using the Dynatrace API.
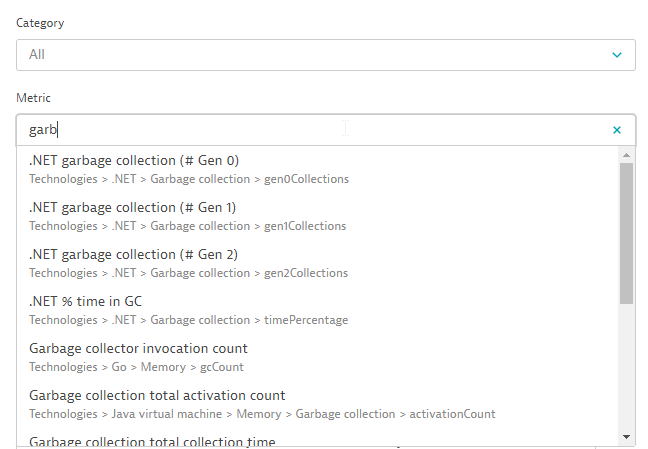
Within the metric picker, you either search for a metric in all categories or you select a category and search within it. The image below shows a metric search across all categories.
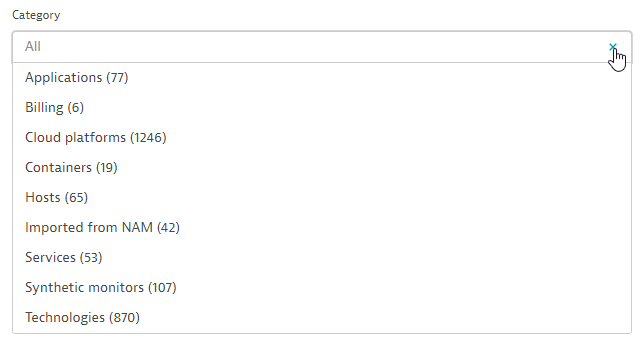
Alternatively, you select a category and browse the metrics that Dynatrace offers in that category:
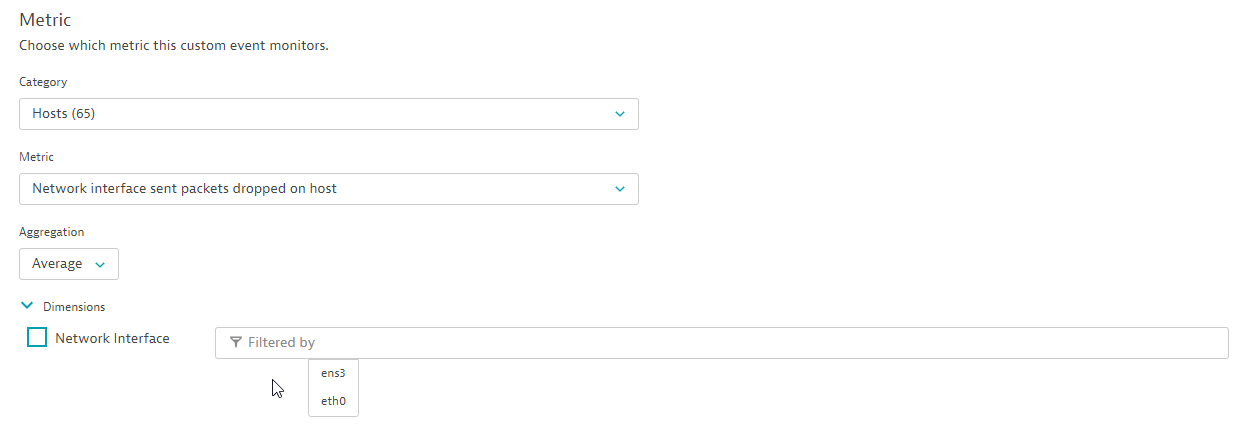
For our example event, we’ll select the Network interface sent packets dropped on host network metric, as shown below. We don’t want to filter for a specific metric dimension; in this case, the dimension represents all network interfaces on the selected hosts.
Define the event scope
The next step is to define the event’s scope as a subset of all the hosts you’re monitoring within your environment.
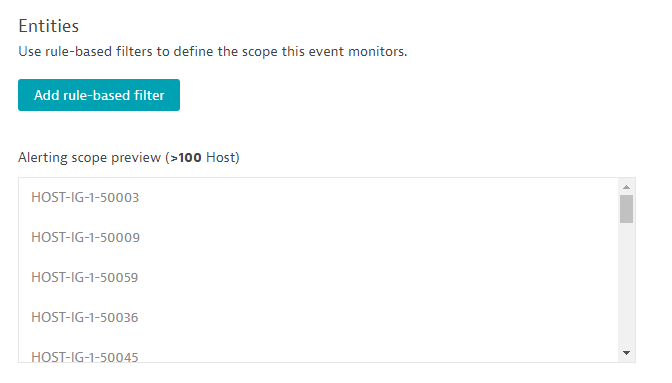
After selecting a metric, all entities that supply that metric are counted and shown in the preview section. In our monitoring environment, there are more than 100 hosts that supply the selected metric.
The preview presents a maximum of 100 entities. We don’t recommend defining a shared threshold on a huge and heterogeneous collection of entities as this typically results in a high number of alerts.
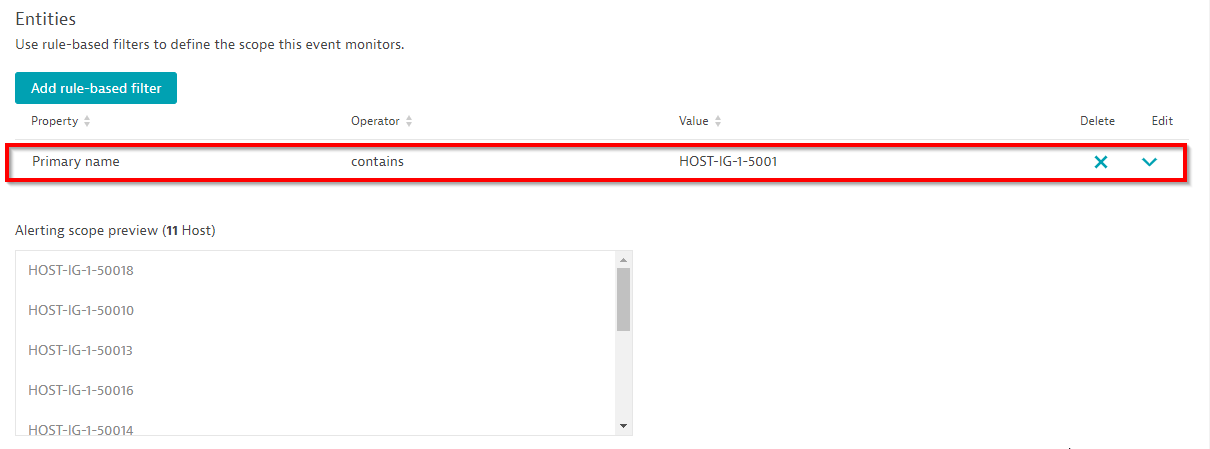
Use convenient scope filters such as host group, management zone, name, and tag filters depending on how you organize your entities. In many cases, a naming convention used for all your hosts along with a dedicated name filter is effective for defining alerting scope, as shown below:
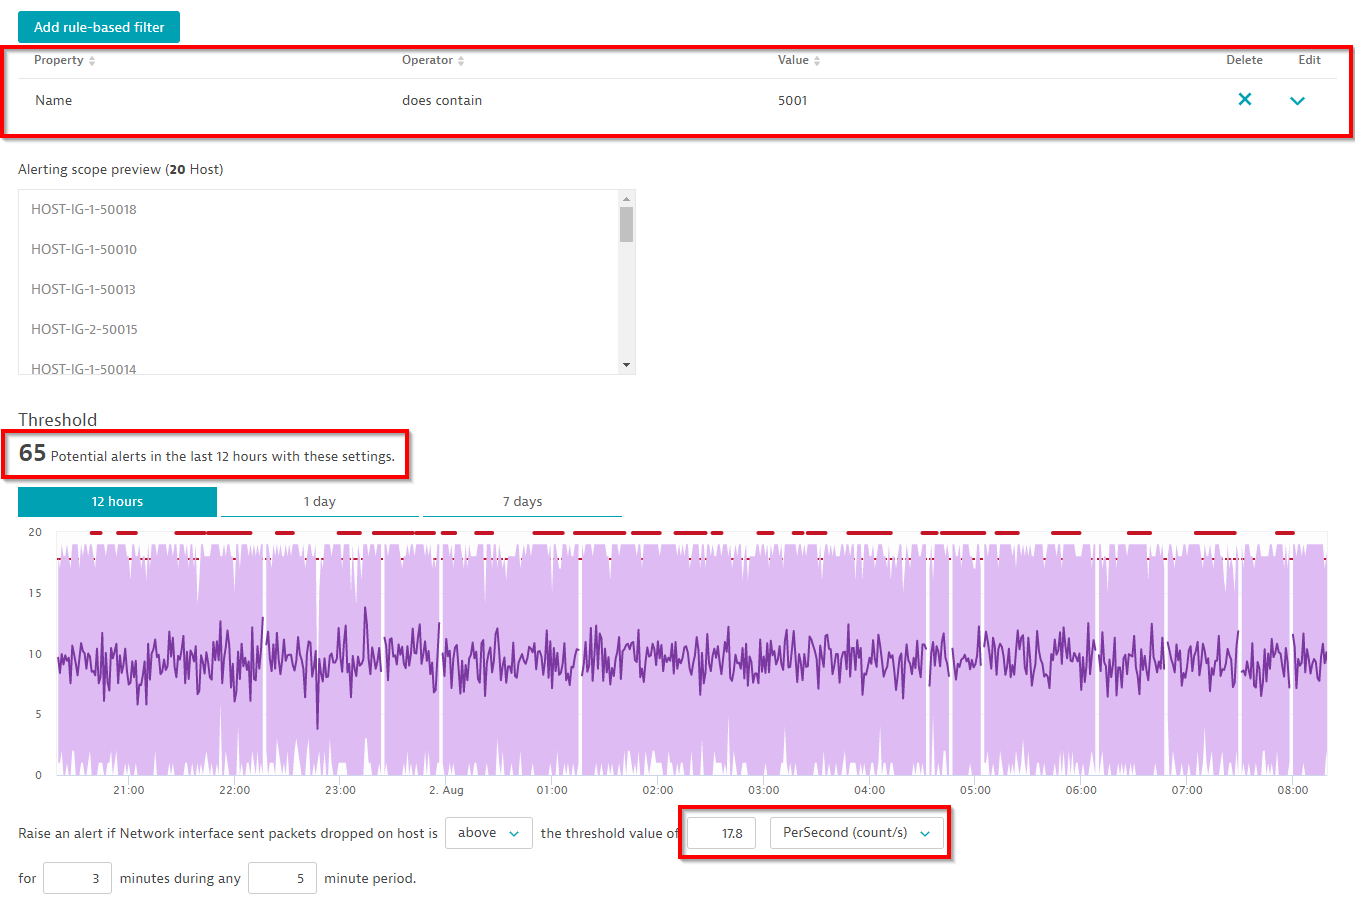
When the number of entities within your alerting scope is fewer than 100, Dynatrace offers a convenient preview of how many alerts would’ve been triggered over the last 12 hours based on the defined scope. Alternatively, you can select and analyze the last day or the last seven days to see how many alerts you would’ve received with historic measurements. The configuration page even provides a baseline threshold suggestion for the selected group of hosts:
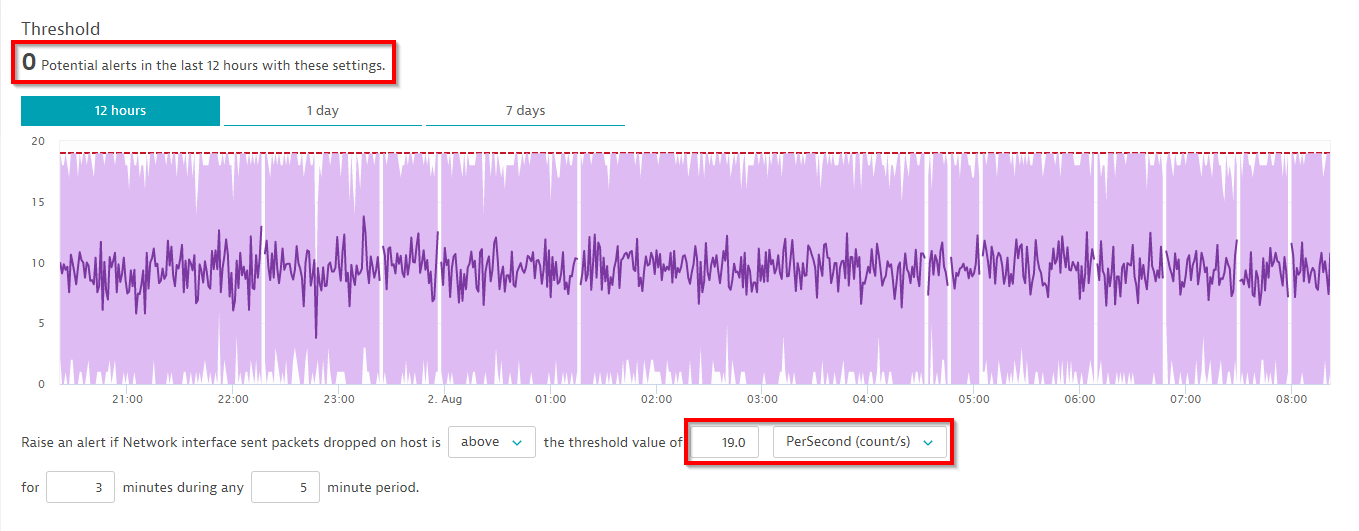
In the example above, the configured threshold of 17.8 packet errors per second still results in the quite high number of 65 events during the last 12 hours. To reduce alert spam, you can either increase the threshold baseline to 19 errors per second and/or specify a larger sliding window of 5 out of 10 minutes. Let’s see how that change works in our example:
The last step before you go live with your newly created event is to review the description message. Use the four placeholders {metricname}, {severity}, {alert_condition}, and {threshold} to fill the text message with the actual values.
Configure a description message
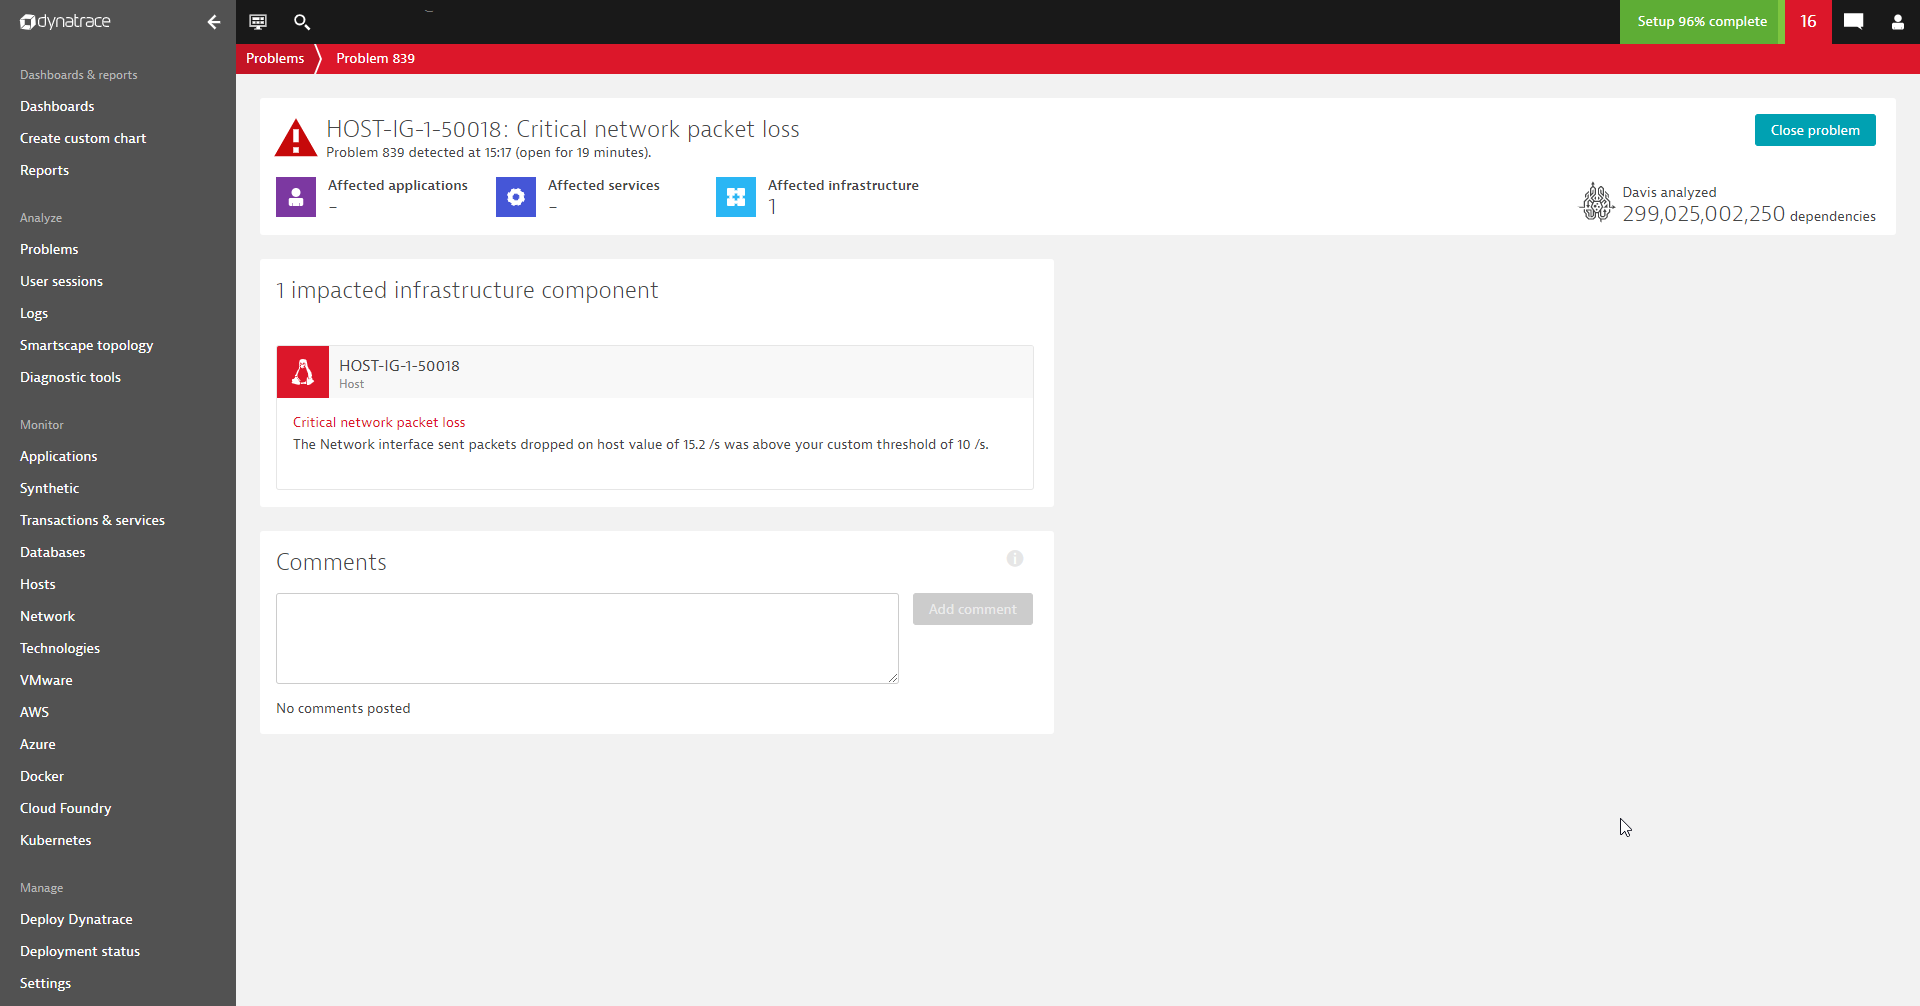
Once your event is triggered, this description message will read, for example, as “The Network interface sent packets dropped on host value of 24 was above your custom threshold of 19.” Adapt the event description to your own needs and then save the custom event definition.
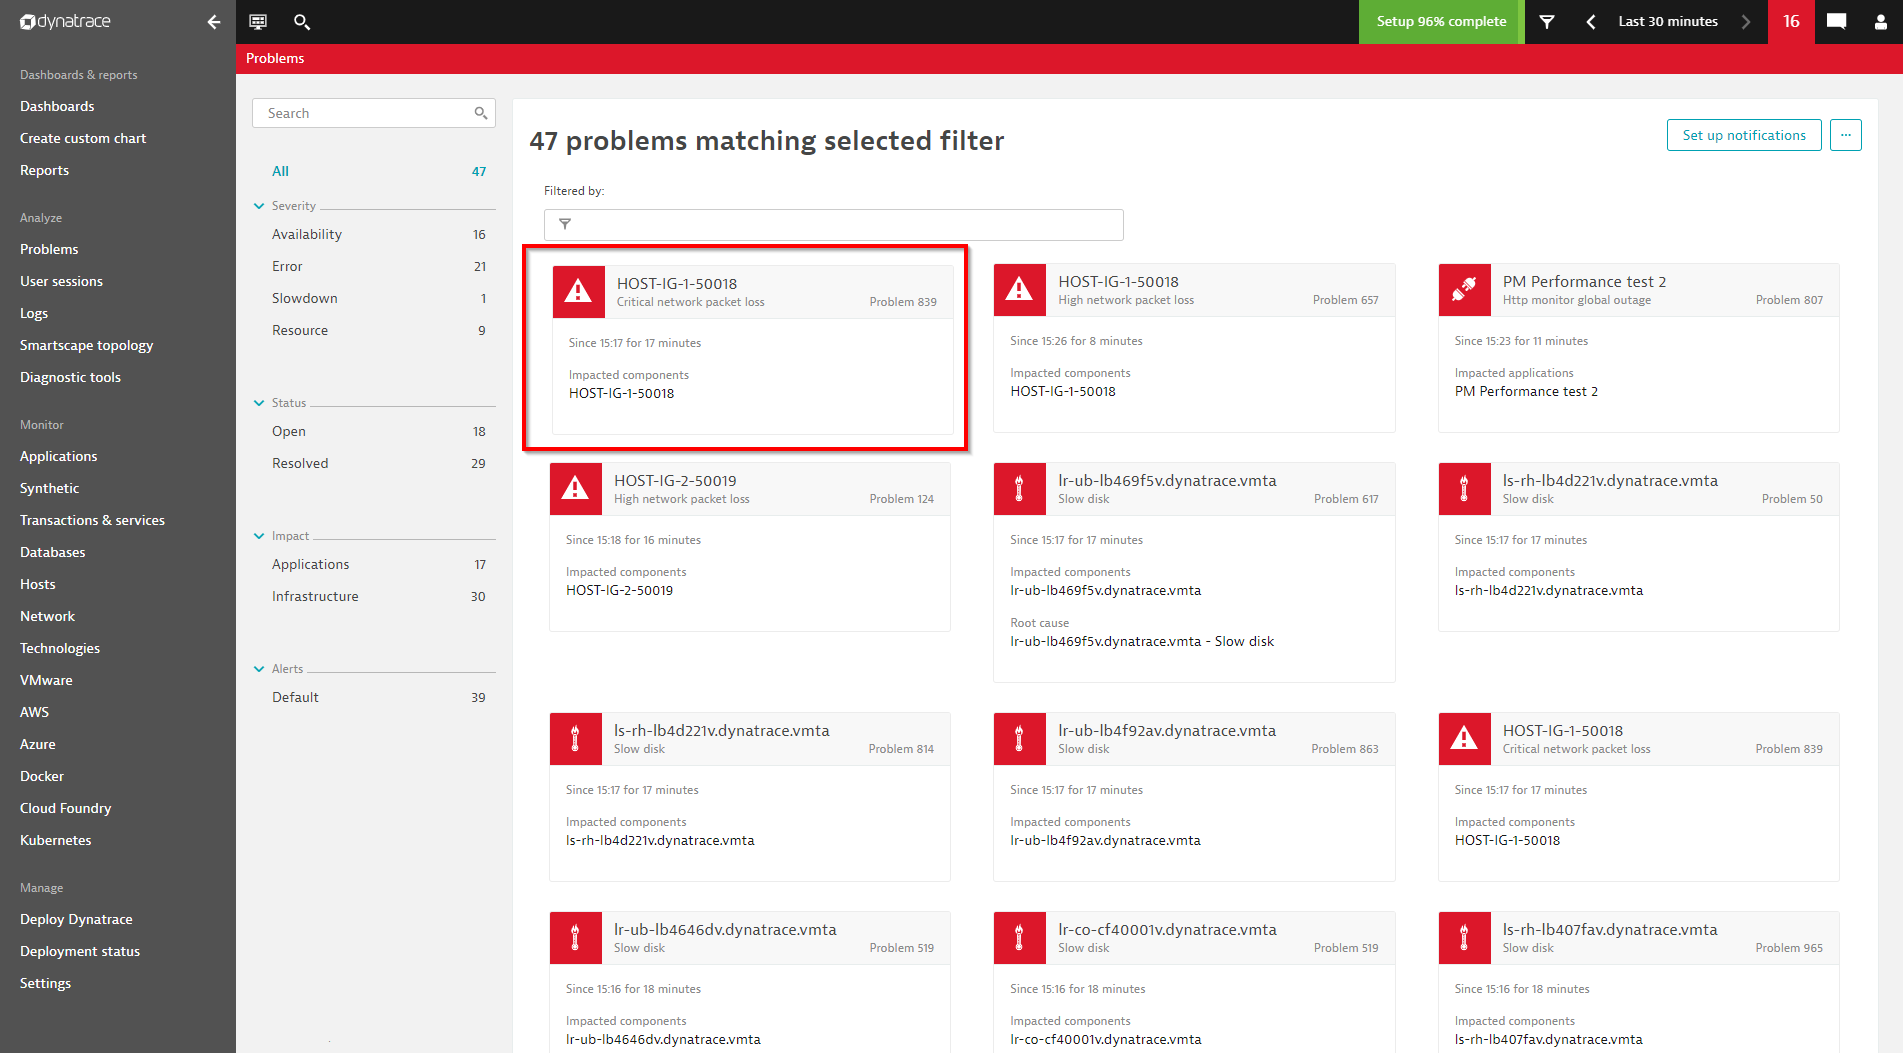
See the screenshots below of how our configured event is visualized in the Dynatrace problem feed:
Summary
Our improved configuration workflow for custom event alerting offers a lot of power in terms of defining additional metric-based events for your Dynatrace environment. Additional flexibility in selecting event severity adds the power to decide if a problem should be raised, if the Davis AI should look at it, or if you are fine with just a single alert or info event.
The newly introduced threshold baseline recommendation helps to define reasonable thresholds. A dry run with data taken from the last seven days helps you identify the number of alerts that would’ve been raised with specific custom settings.





Looking for answers?
Start a new discussion or ask for help in our Q&A forum.
Go to forum