We’re happy to announce the latest enhancements for monitoring your Google Cloud Platform (GCP) environment. In addition to the metadata for each Google Compute Engine instance, Dynatrace OneAgent now also automatically reports the GCE project information of each instance. You can use this information to organize your monitored components in Dynatrace.
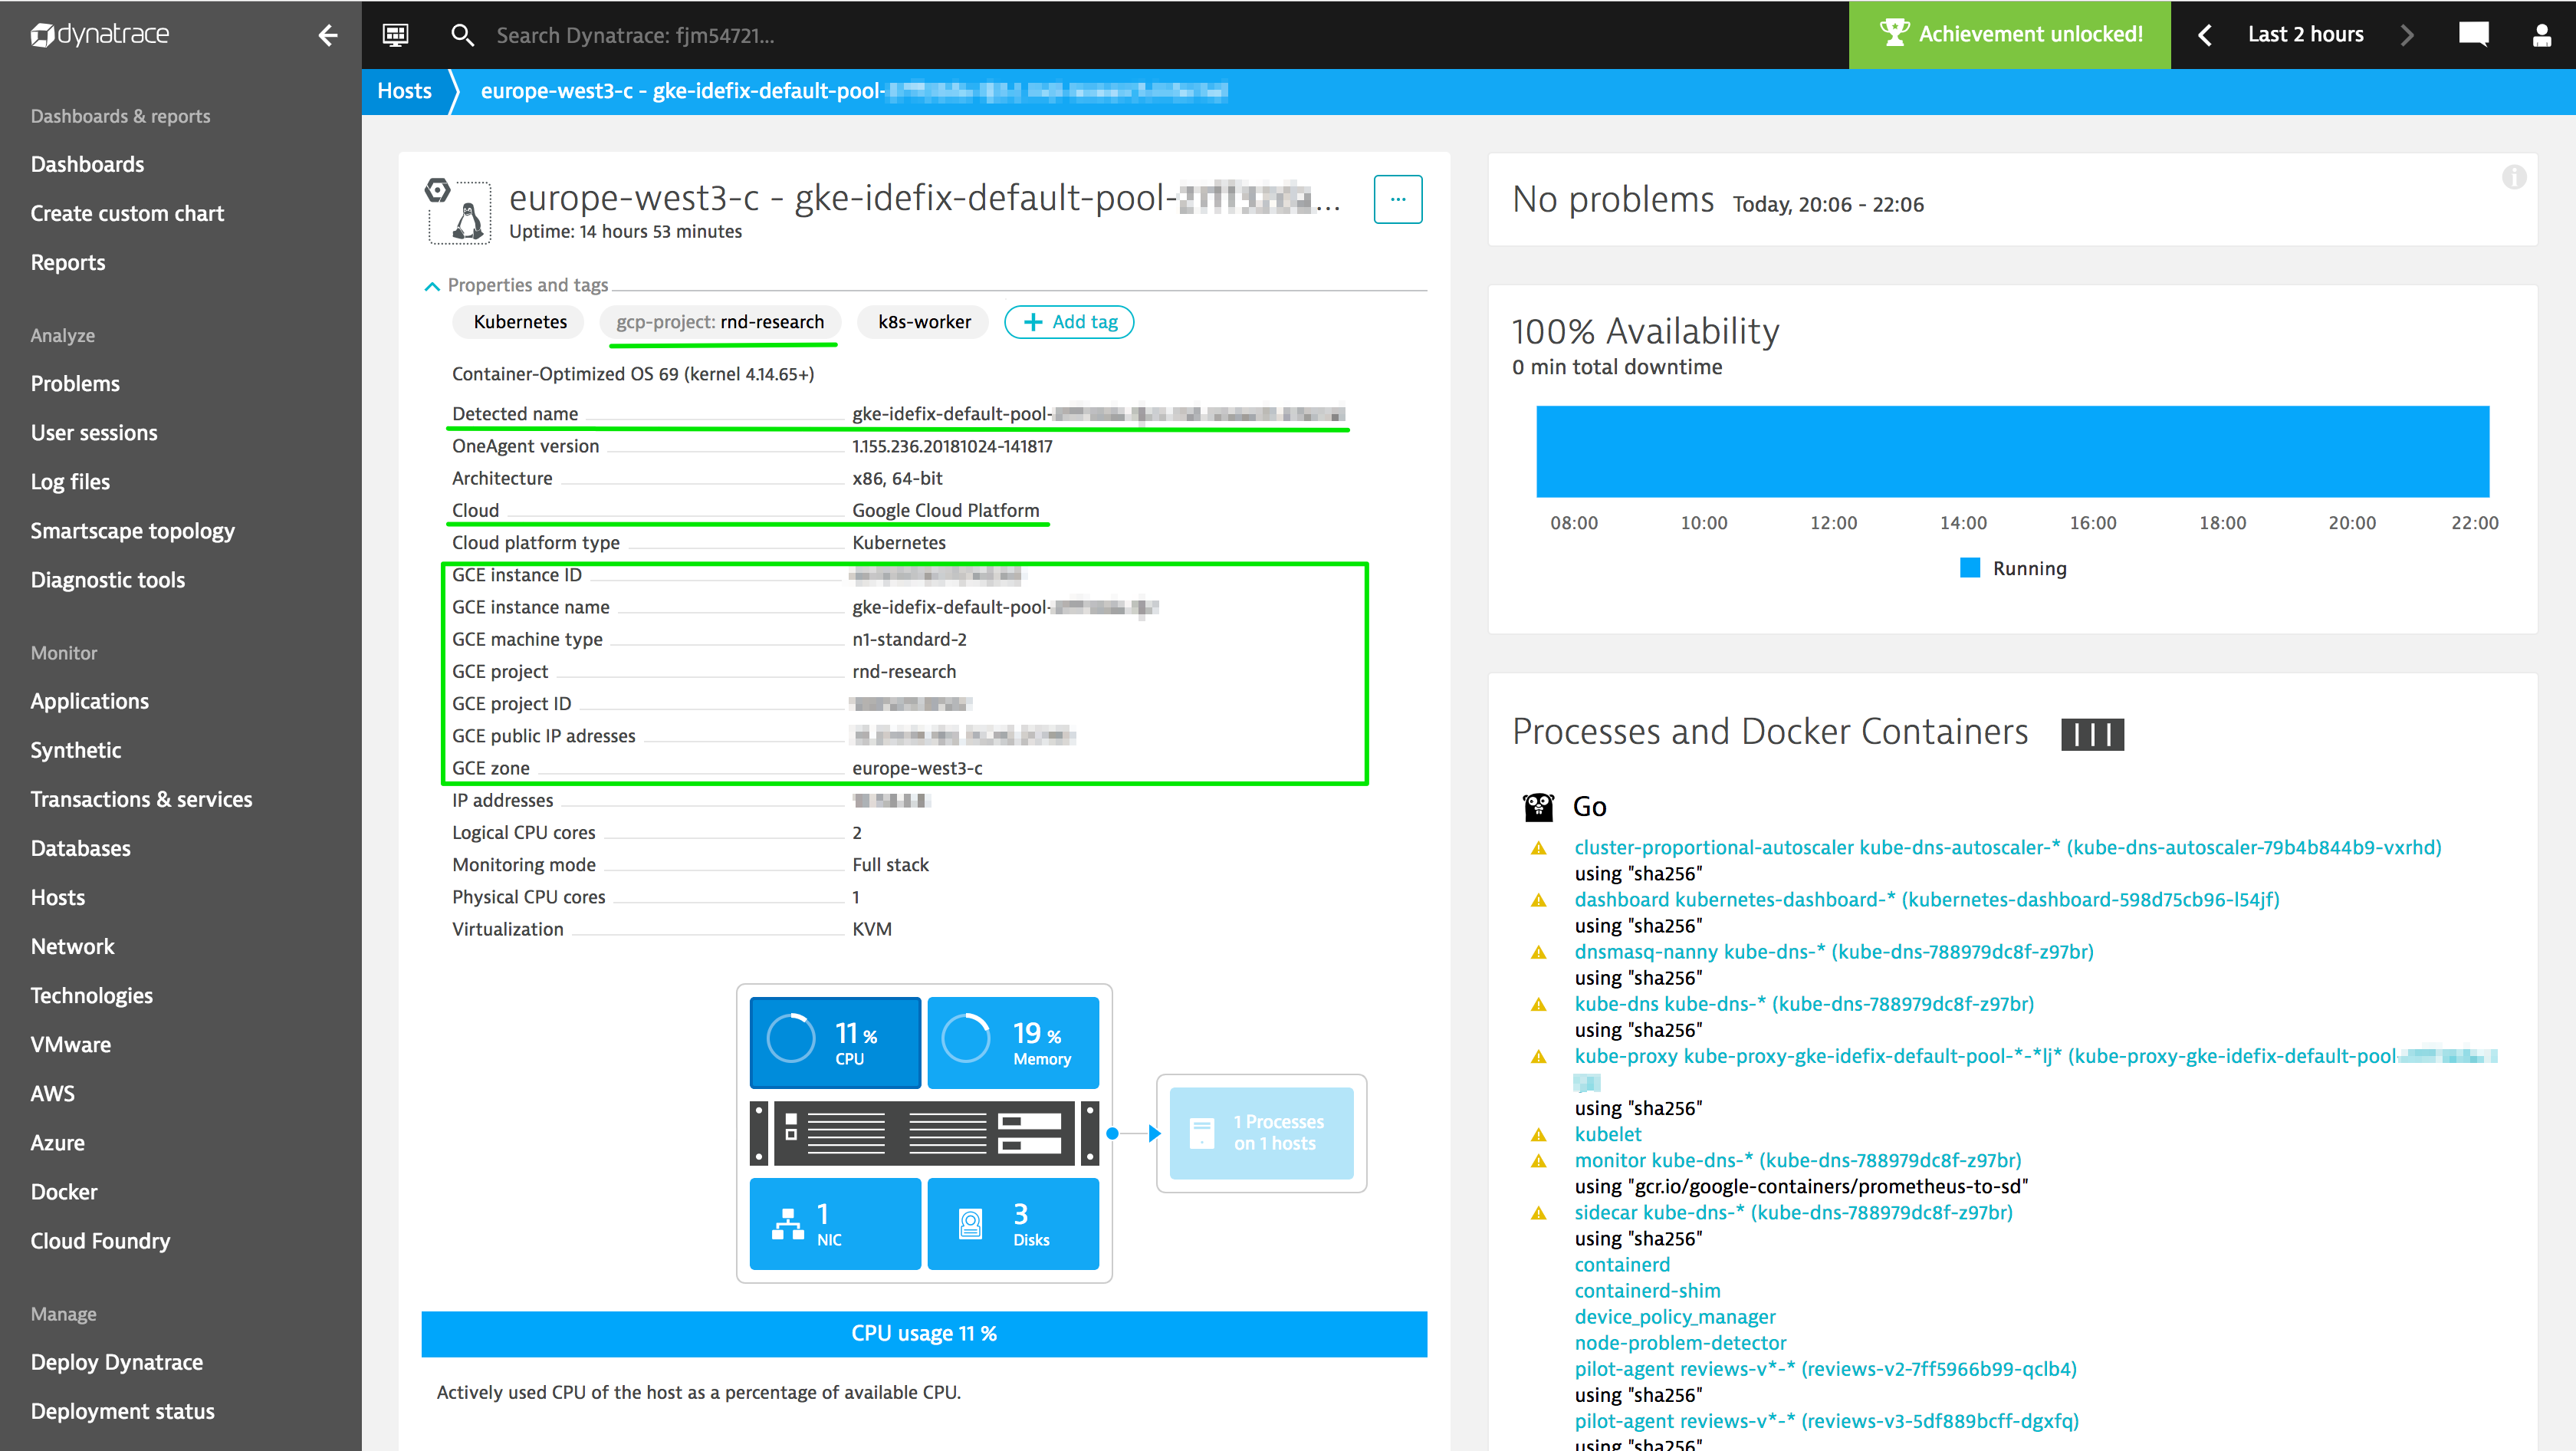
With OneAgent version v1.155, Dynatrace detects and reports the following properties for Google Cloud at the host level:
- GCE instance ID
- GCE instance name
- GCE machine type
- GCE project
- GCE project ID
- GCE public IP addresses
- GCE zone
Use GCP properties for tags, rules, and management zones
All GCP related properties that are detected by Dynatrace can be used for
- Rule-based automated tagging of hosts, process groups, and services
- Rule-based automated renaming of hosts, process groups, and services
- Definition of management zones
For example, you can set up management zones for every Google Cloud Project.
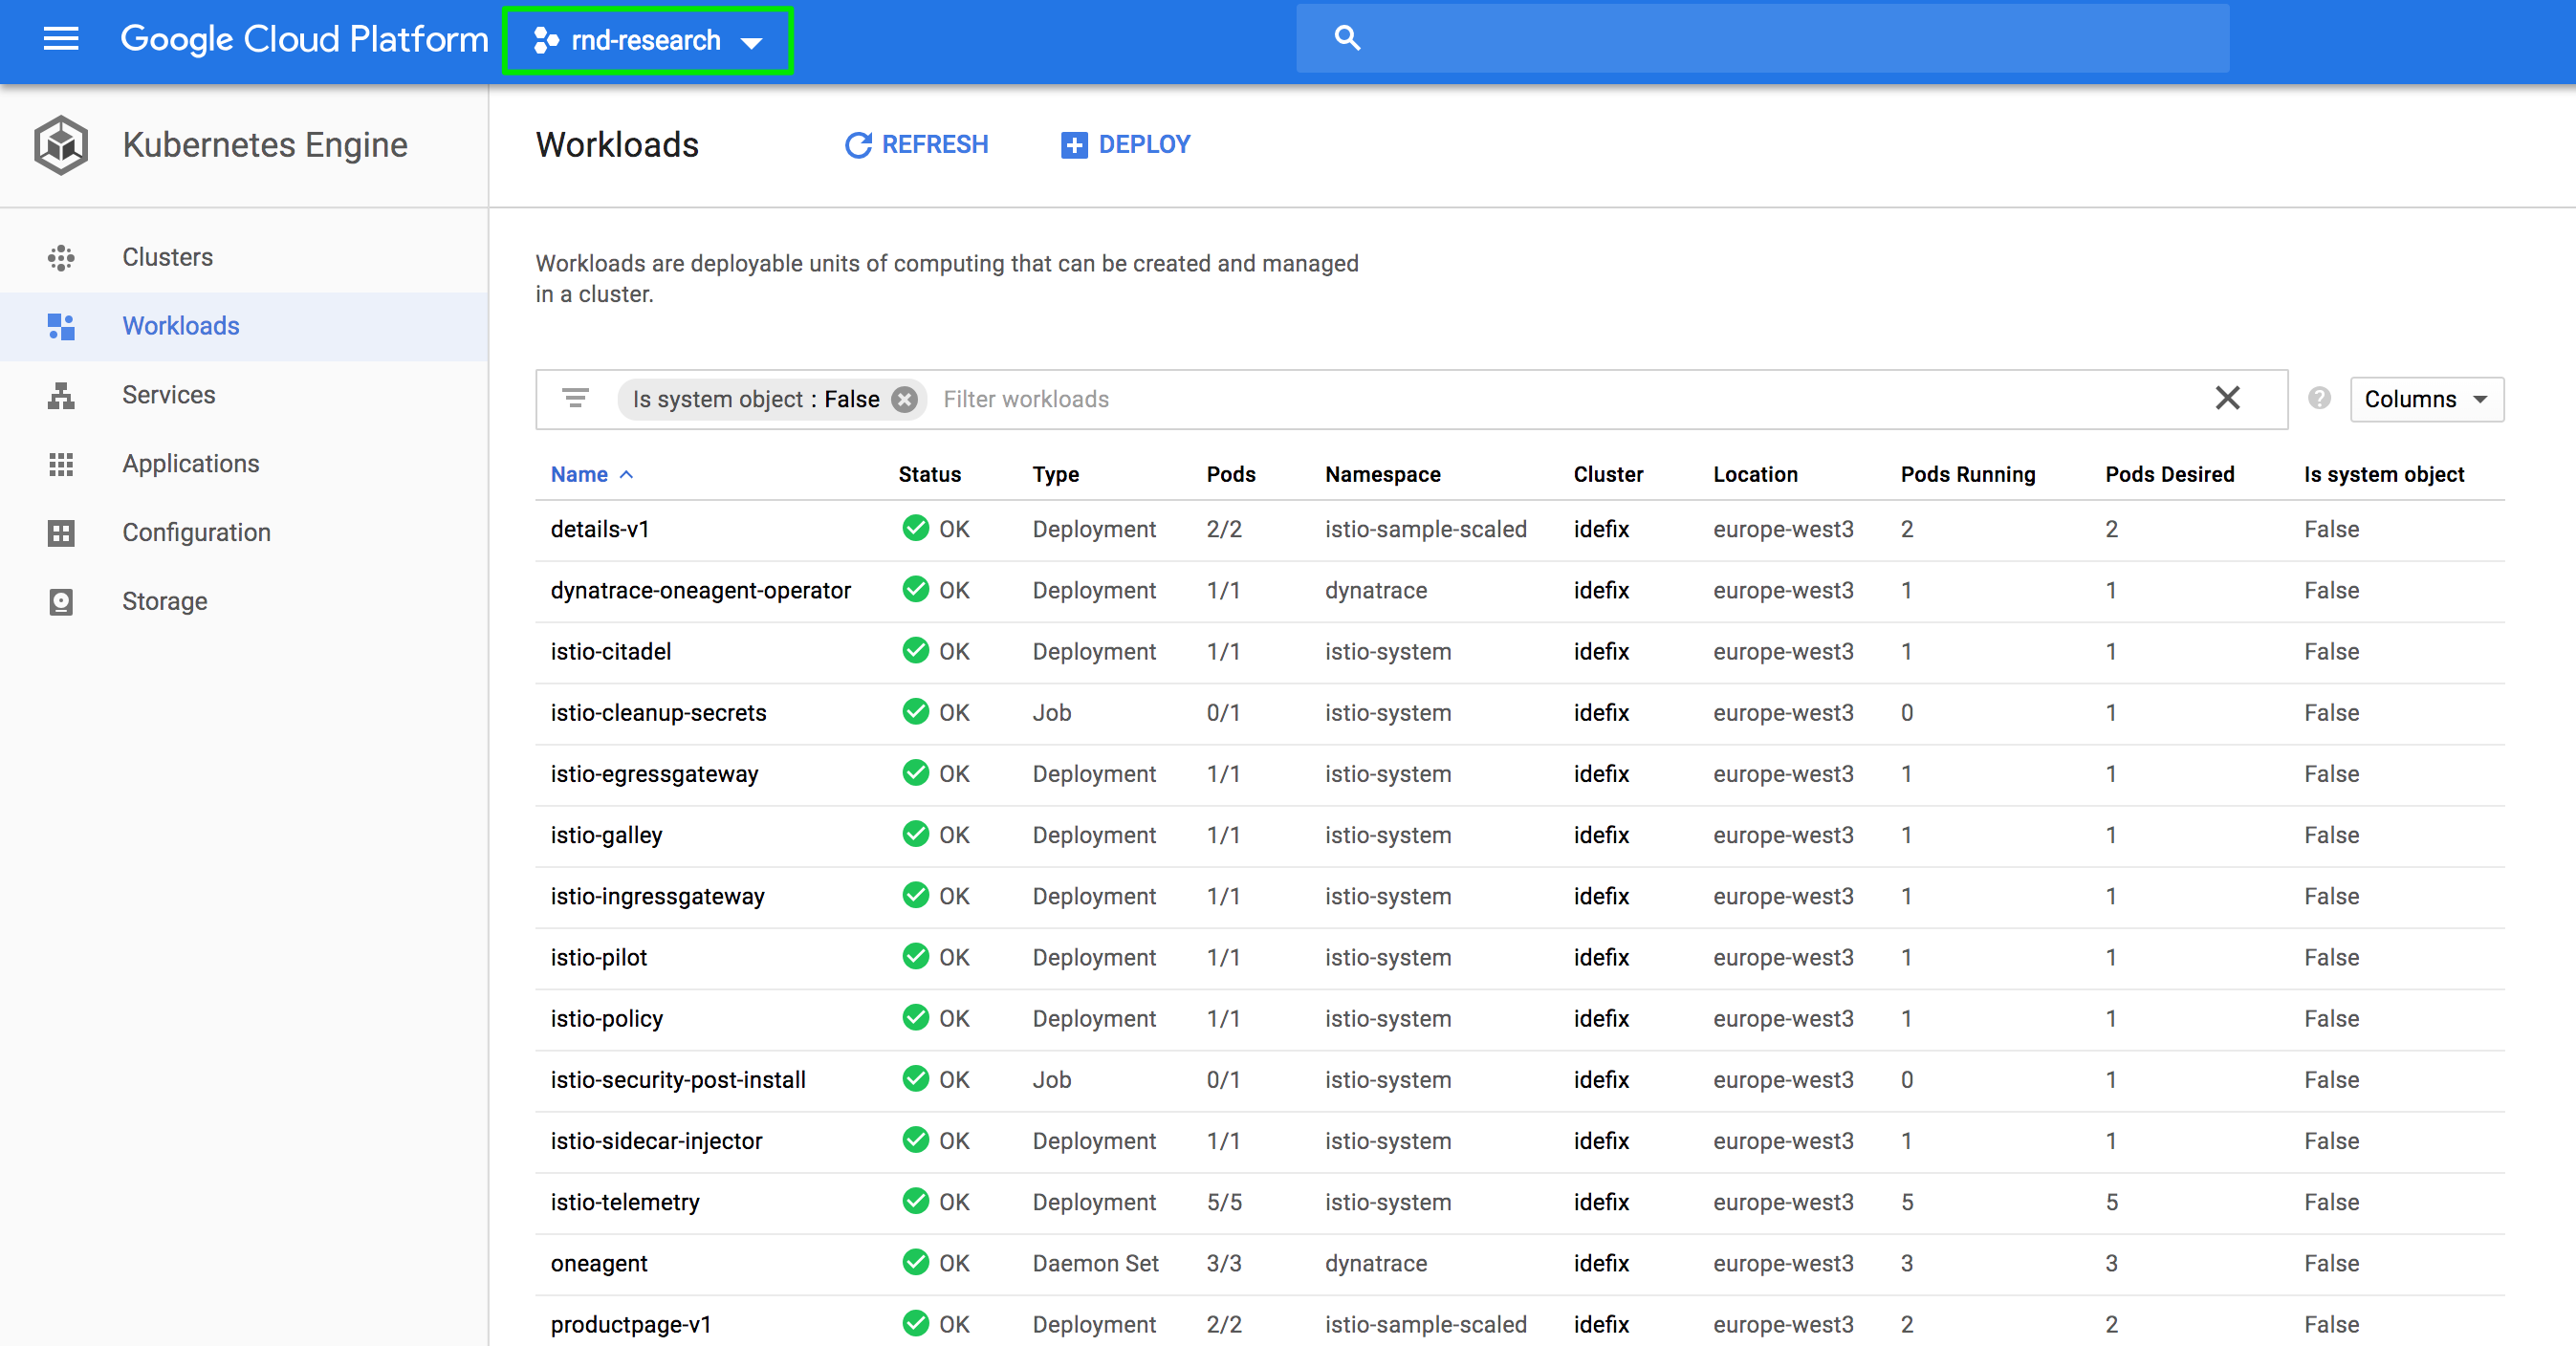
In the following example, we define a management zone for one of our internal projects in GCP. Management zones enable you to provide view access to specific groups of entities to specific user groups based on flexible rules.
In this example, we create a management zone that covers all hosts, process groups, and services that are running in the GCP project with the respective project ID.
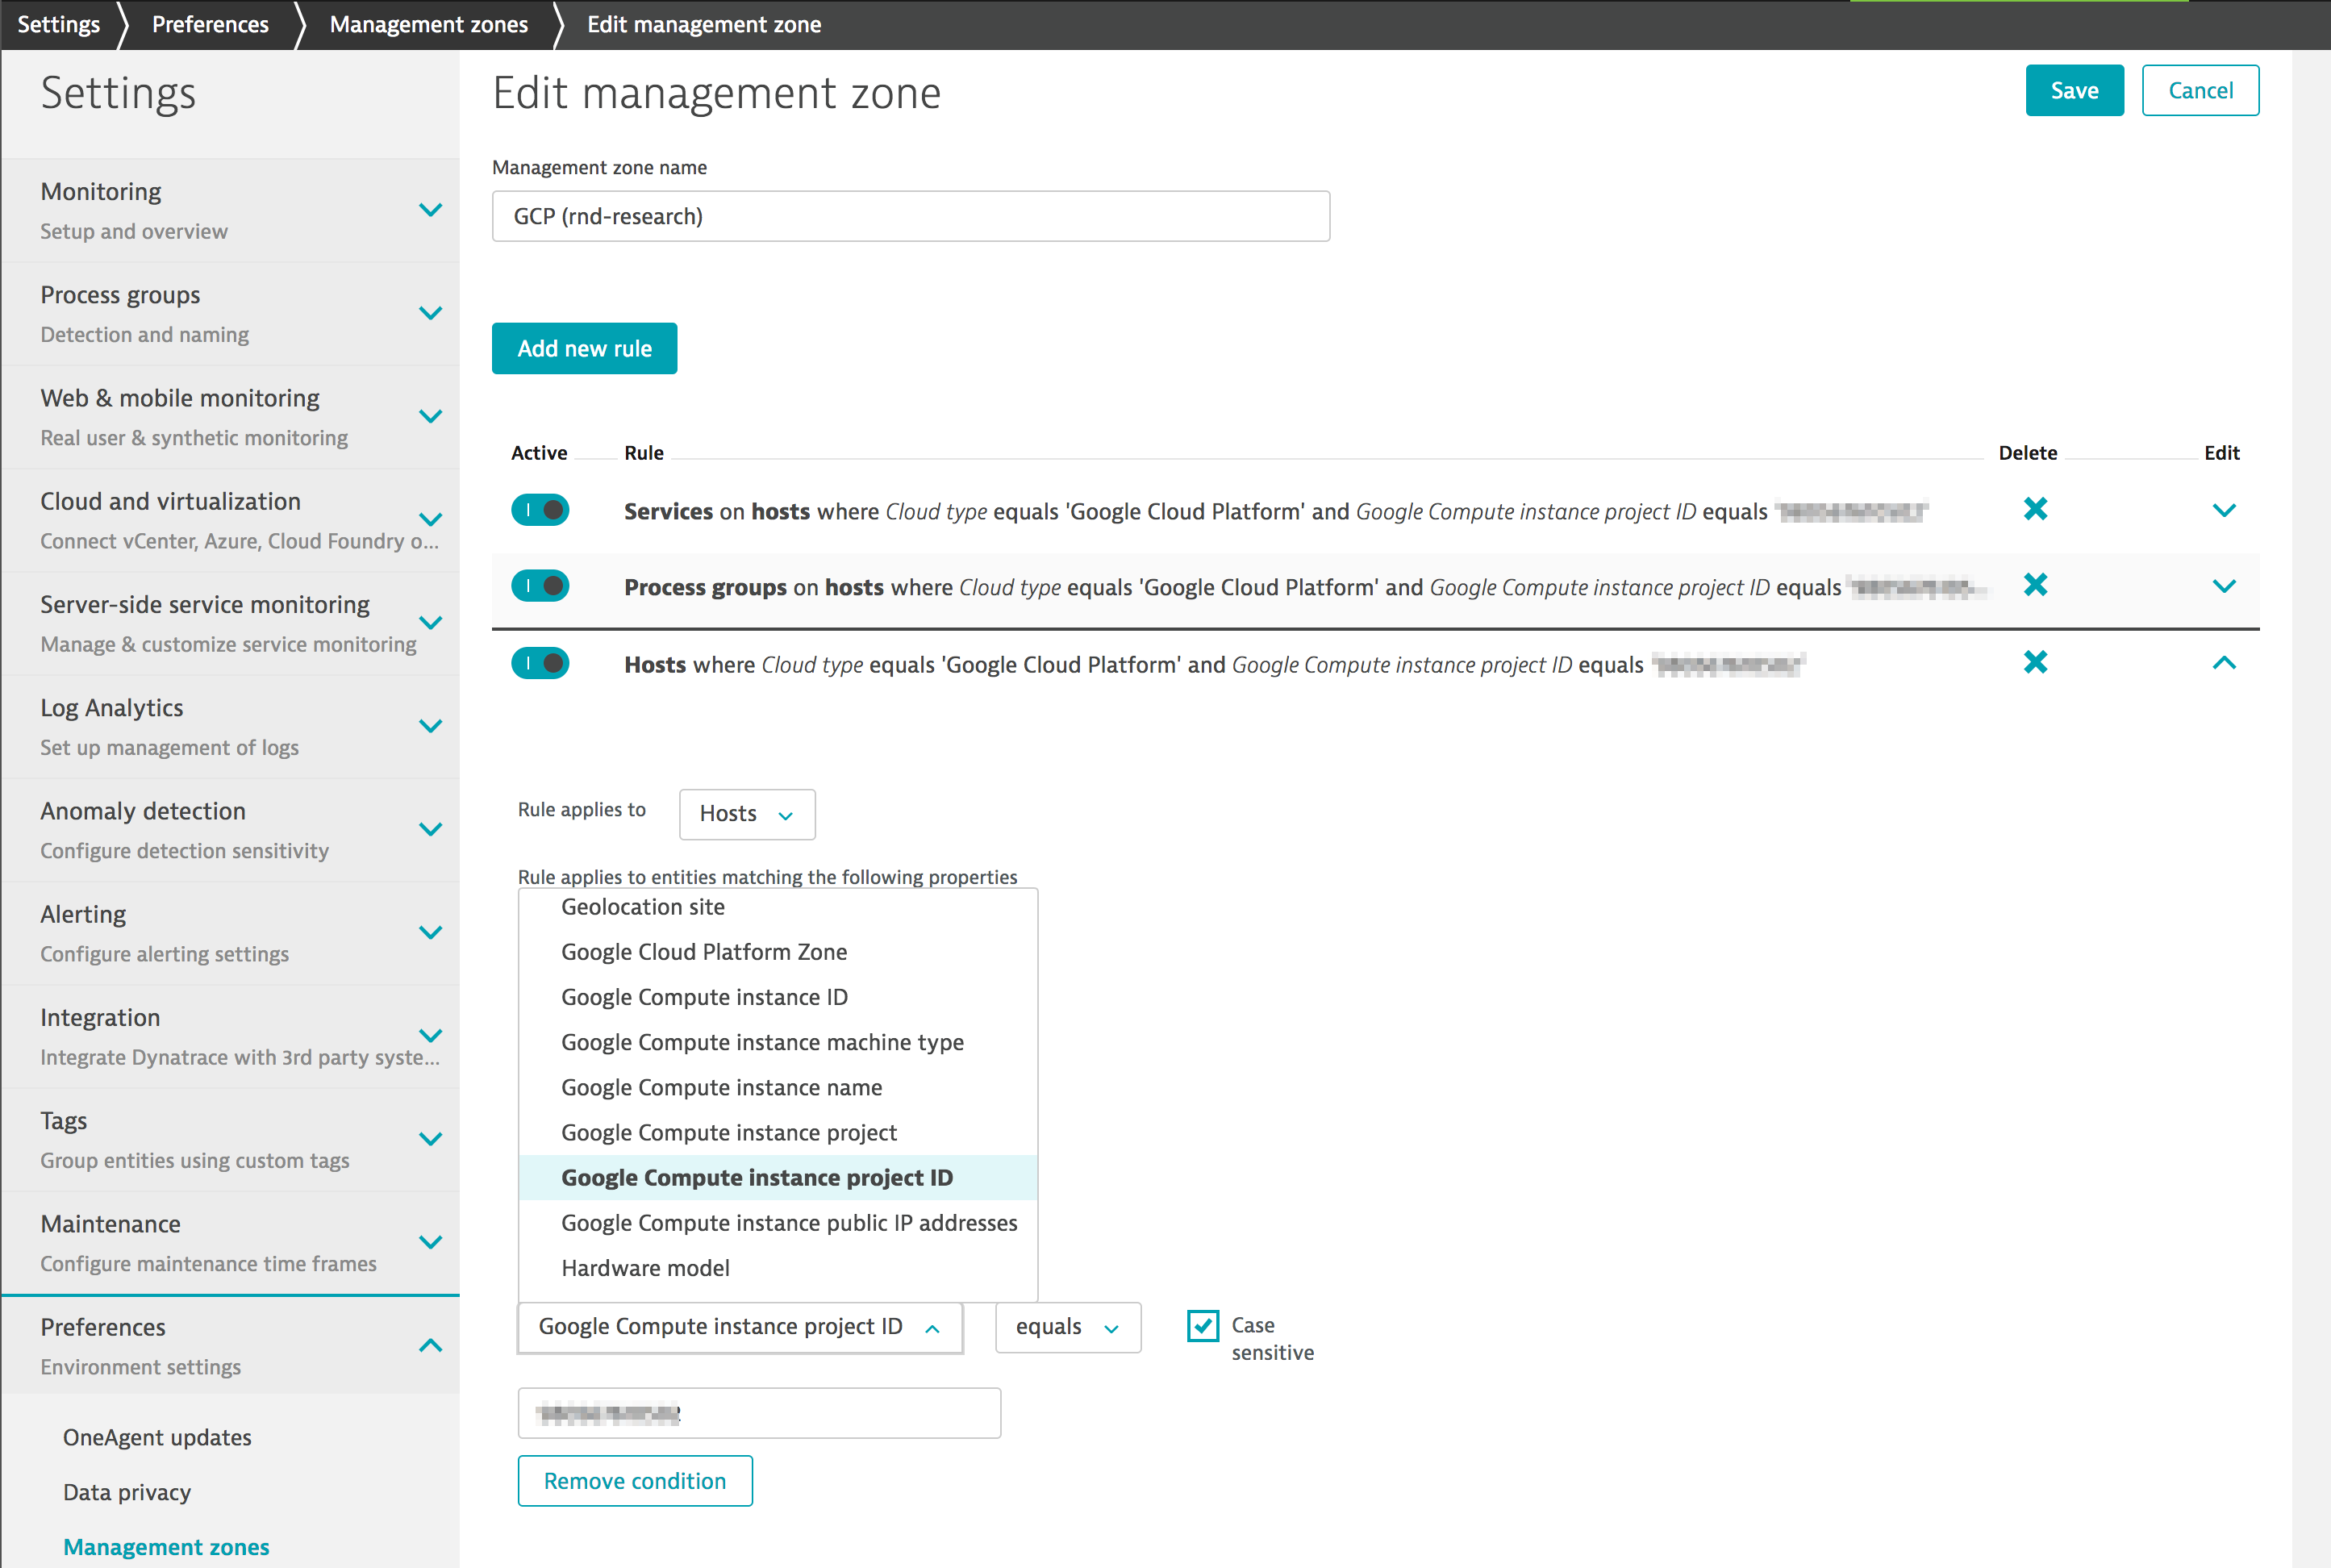
This management zone limits user access to the monitoring of entities for this specific GCP project only. To learn more, please refer to management zone documentation.
Kubernetes workload distribution across Google Cloud zones
Google Compute instances and zones are first-class citizens in Dynatrace and are perfectly integrated with Smartscape.
In this example, we run a small 3-node Kubernetes cluster in GKE and we deploy the Istio sample application. With Dynatrace Smartscape, we can easily understand the actual deployment stack of the reviews service from the Istio sample app.
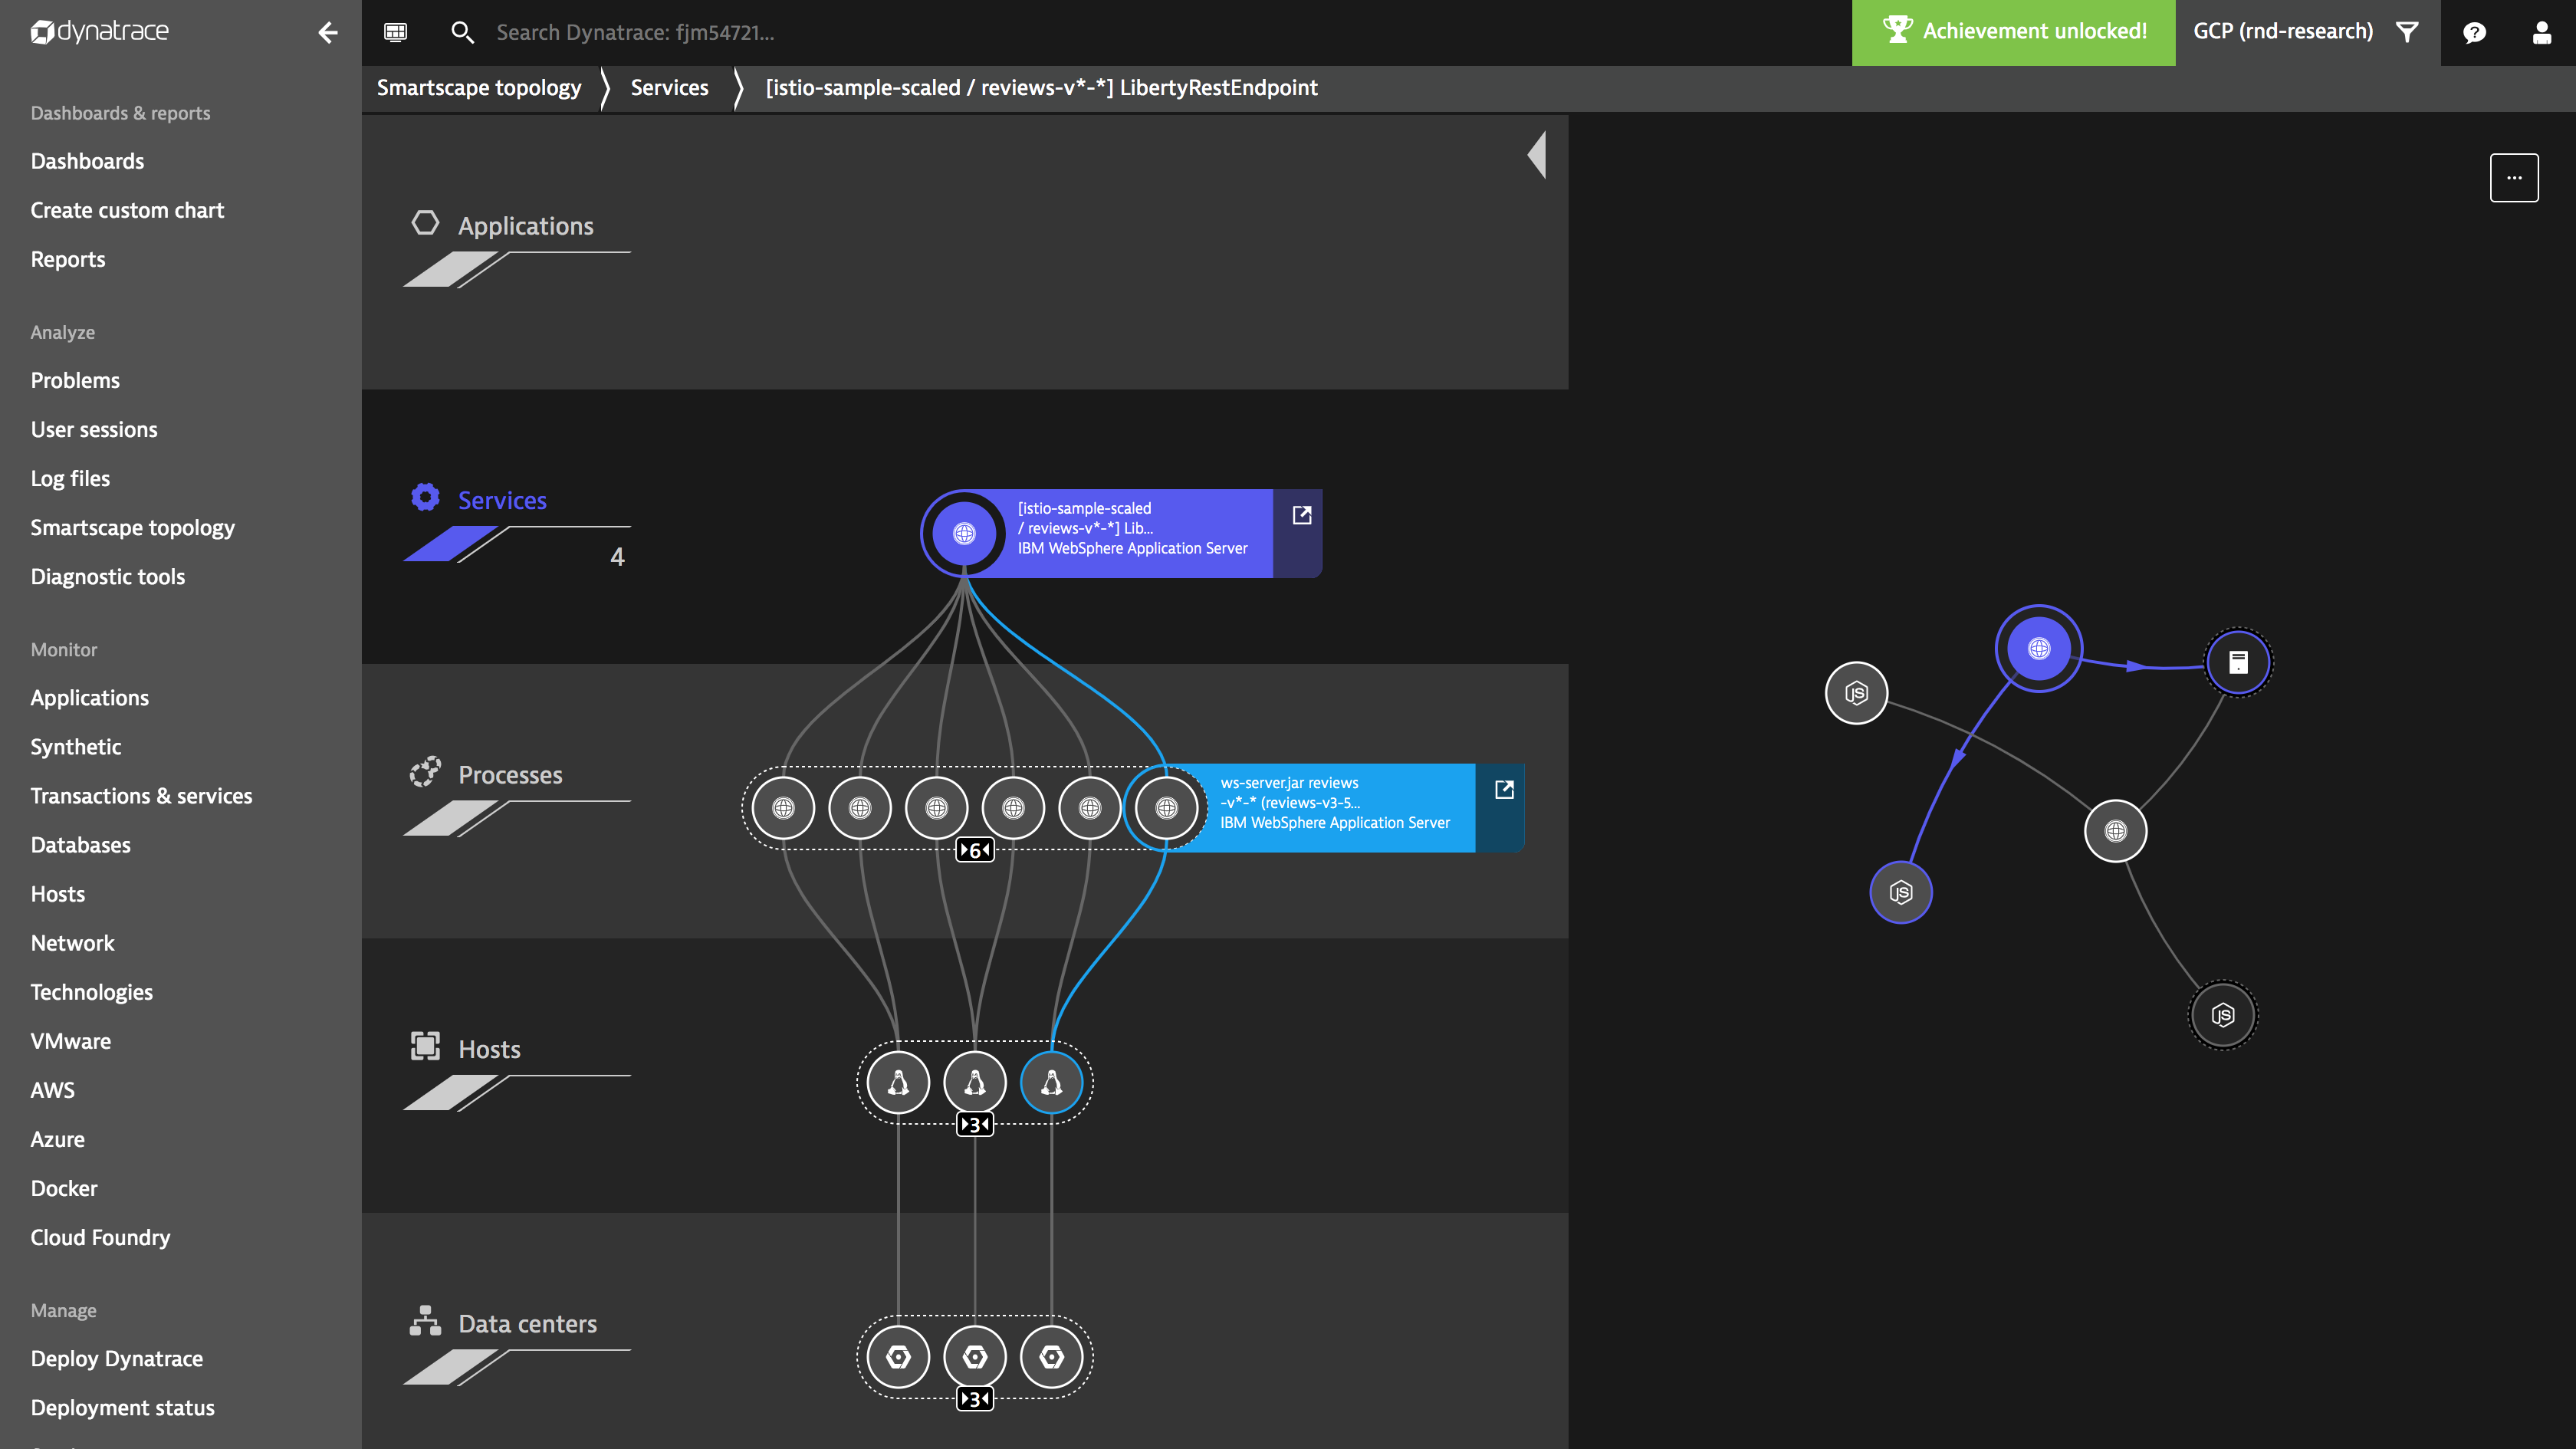
We run two instances of each reviews-v1, reviews-v2, and reviews-v3 deployment, and Kubernetes distributes the workload across all three cluster nodes in the three zones.
The reviews service in Dynatrace shows us how the ingress traffic (that is, requests to the reviews service) has been distributed across all the reviews deployments and pods. Each service instance shown in the screenshot reflects a running pod for either the reviews-v1, reviews-v2, or reviews-v3 deployment.
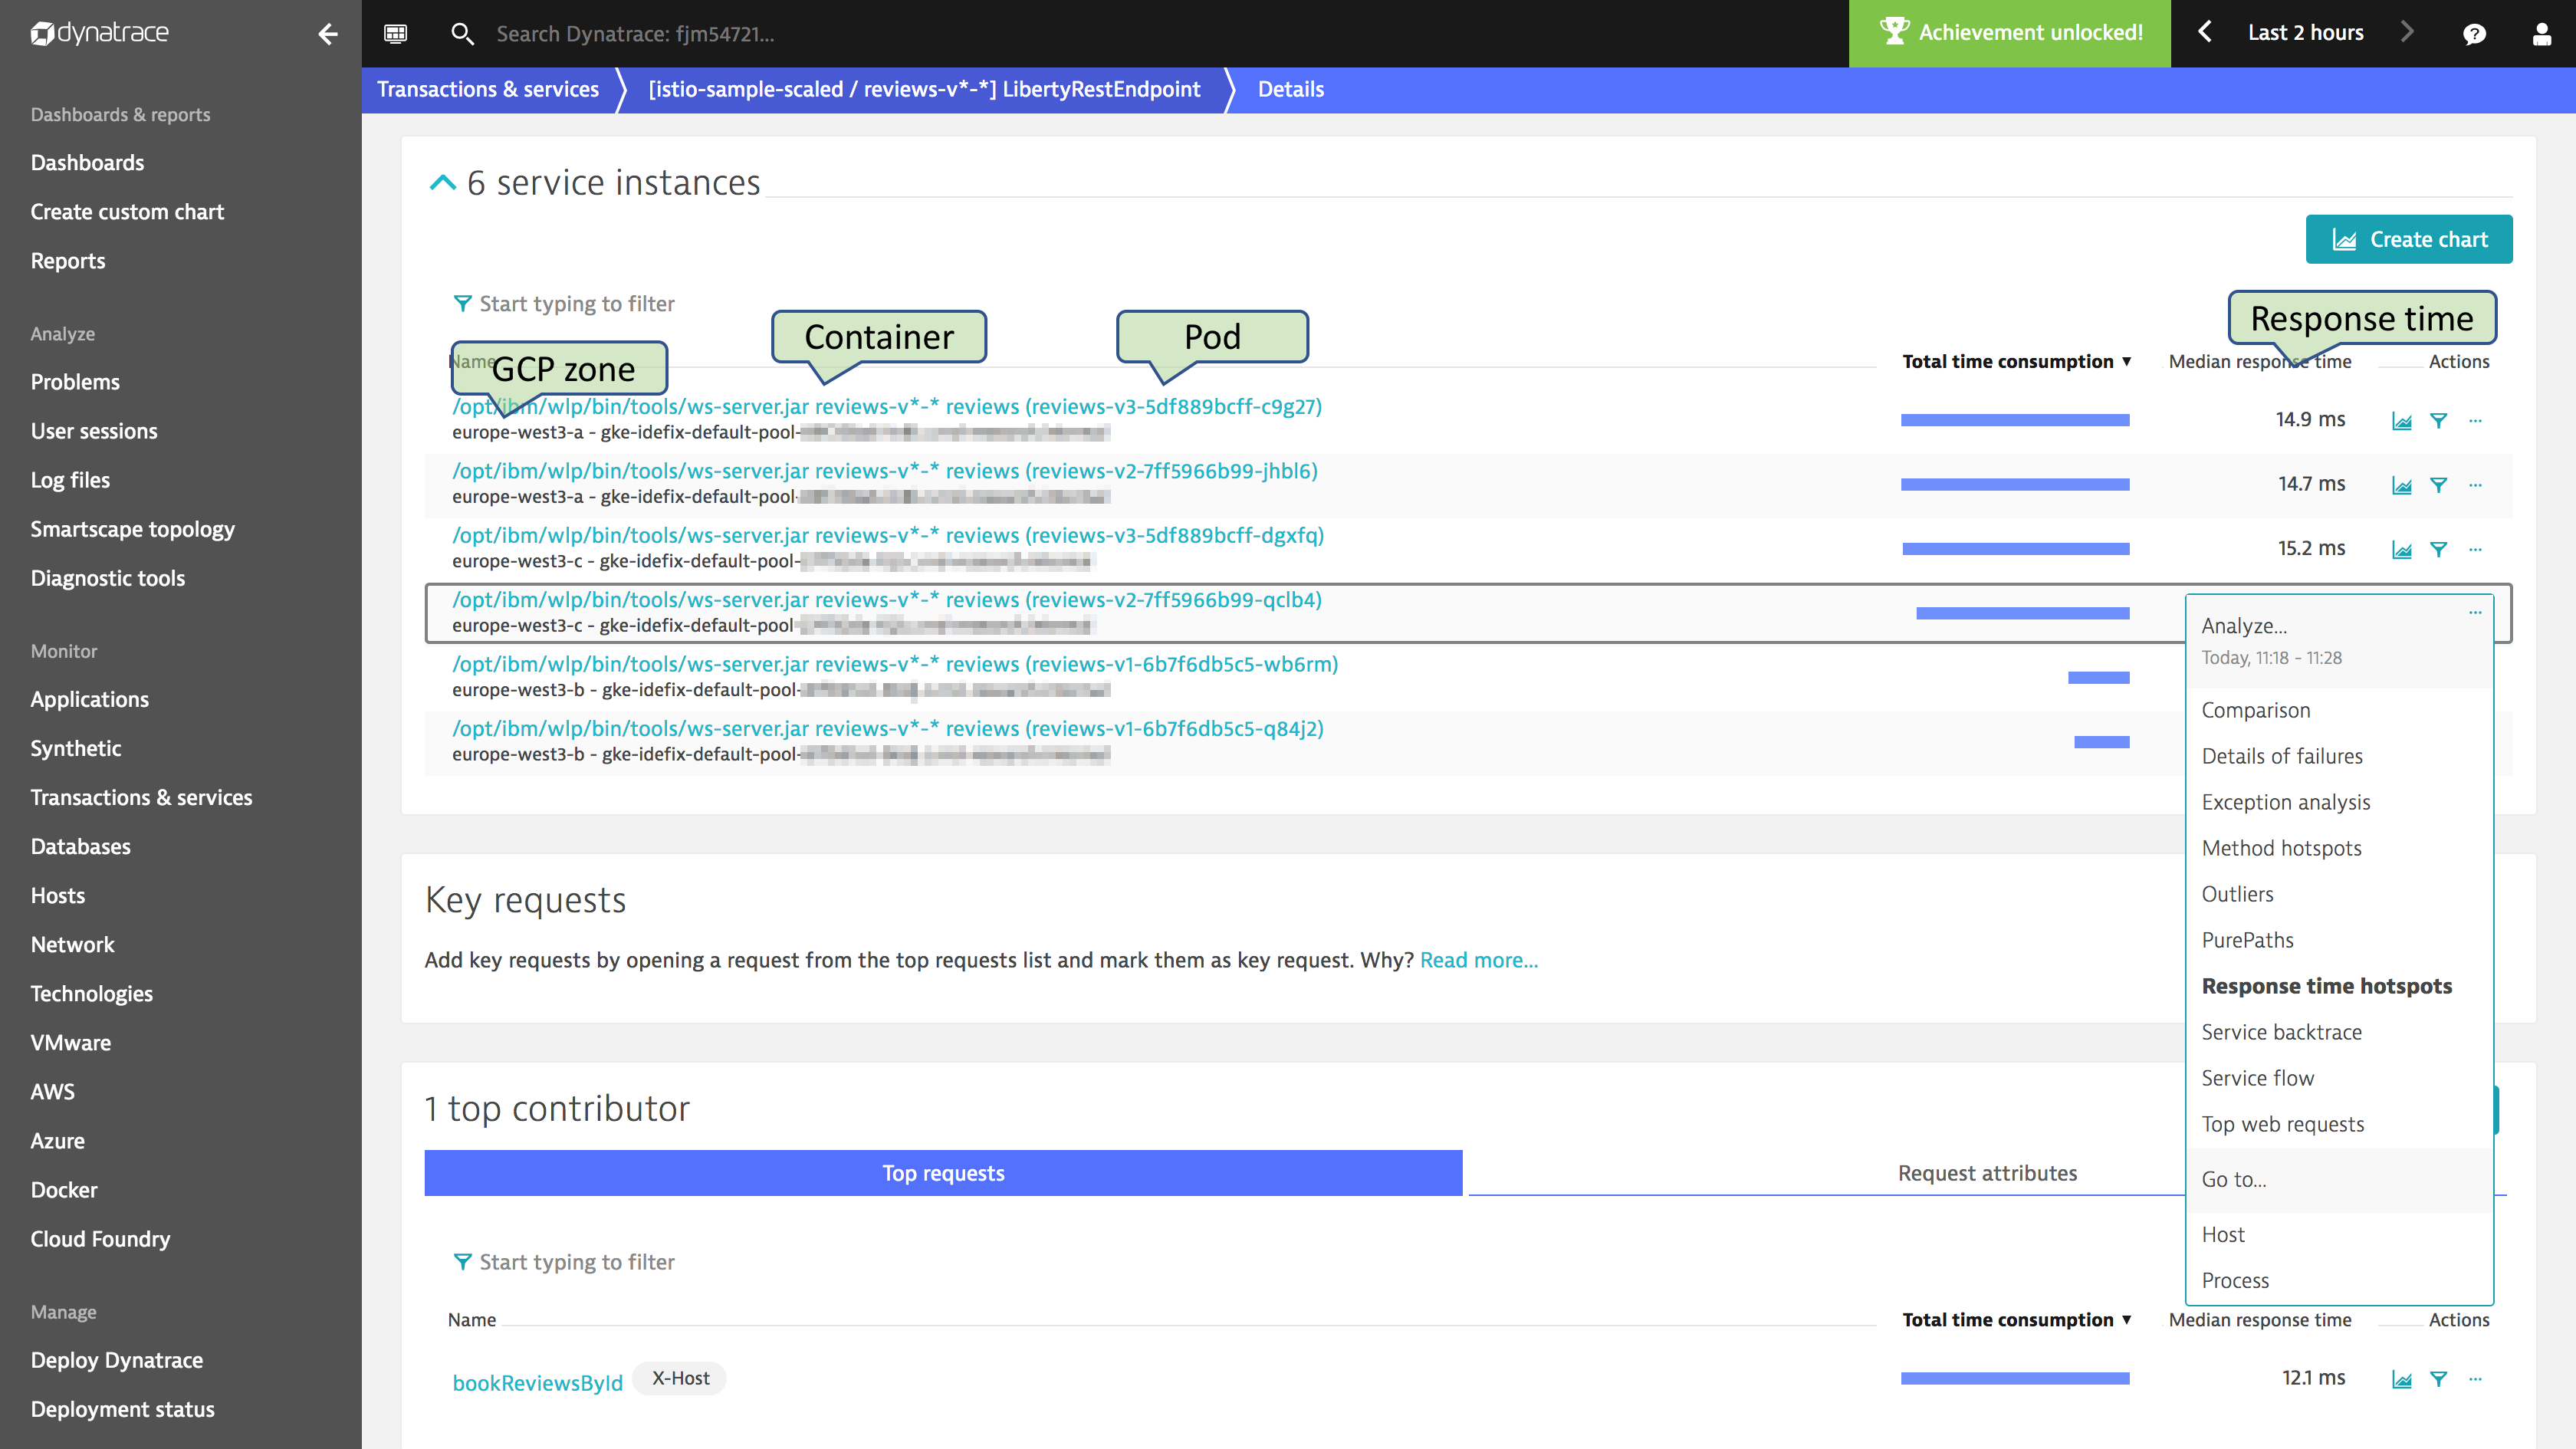
For each service instance, Dynatrace shows where the instance actually runs as well as the response time metric and the total time consumption of requests for the instance. The names of the pod, container, process, and the actual host that run the instance are encoded with the service instance name.
In settings, we configured a host naming rule that factors the GCP zone into the hostname. With this host naming rule, we can also identify the zone that the pod and service instances are running in.
What’s next
There are many great new capabilities ahead for monitoring cloud platforms in general. For Google Cloud Platform specifically, Dynatrace will soon integrate labels and tags from Google Compute Engine instances and make them available in all filters.
In the meantime, let us know what you think about GCP monitoring. Please share your feedback with us at Dynatrace Community.


Looking for answers?
Start a new discussion or ask for help in our Q&A forum.
Go to forum