In today’s data-driven world, businesses across various industry verticals increasingly leverage the Internet of Things (IoT) to drive efficiency and innovation. IoT is transforming how industries operate and make decisions, from agriculture to mining, energy utilities, and traffic management.
Agricultural businesses use IoT sensors to automate irrigation systems, while mining and water supply organizations traditionally rely on SCADA to optimize and monitor water distribution, quality, and consumption.
Mining and public transportation organizations commonly rely on IoT to monitor vehicle status and performance and ensure fuel efficiency and operational safety.
As businesses increasingly embrace these technologies, integrating IoT metrics with advanced observability solutions like Dynatrace becomes essential to gaining additional business value through end-to-end observability.
Dynatrace offers a feature-rich agent, Dynatrace OneAgent®, and an agentless open source approach perfectly tailored for edge-IoT use cases, leveraging OpenTelemetry. Both methods allow you to ingest and process raw data and metrics.
In the following sections, we’ll explore how aircraft monitoring fits into this broader IoT landscape and how to implement OpenTelemetry and Dynatrace to enhance the monitoring and management capabilities of IoT data in aviation.
Get started with IoT: Aircraft monitoring
Have you ever wondered how services like flightradar24 or FlightAware collect aircraft location details and report them live?
Each aircraft equipped with an Automatic Dependent Surveillance-Broadcast (ADS-B) transponder broadcasts ADS-B data packets at a frequency of 1090 MHz that include GPS-derived position, altitude, velocity, and other information.
These broadcasts occur periodically and are received by ground stations and other aircraft equipped with ADS-B receivers. They enable real-time tracking and enhanced situational awareness for air traffic control and collision avoidance systems.
The ADS-B protocol differs significantly from web technologies. While web technologies use the internet and HTTP for data transfer, enabling communication between web clients and servers, ADS-B relies on radio frequency broadcasts for direct, real-time communication. ADS-B transmits structured data packets containing specific aviation-related information such as position and velocity. Unlike web technologies, which support a wide range of applications from webpage serving to API interactions, ADS-B is designed explicitly for real-time physical tracking and monitoring in aviation—just like any other IoT monitoring solution in the earlier mentioned verticals.
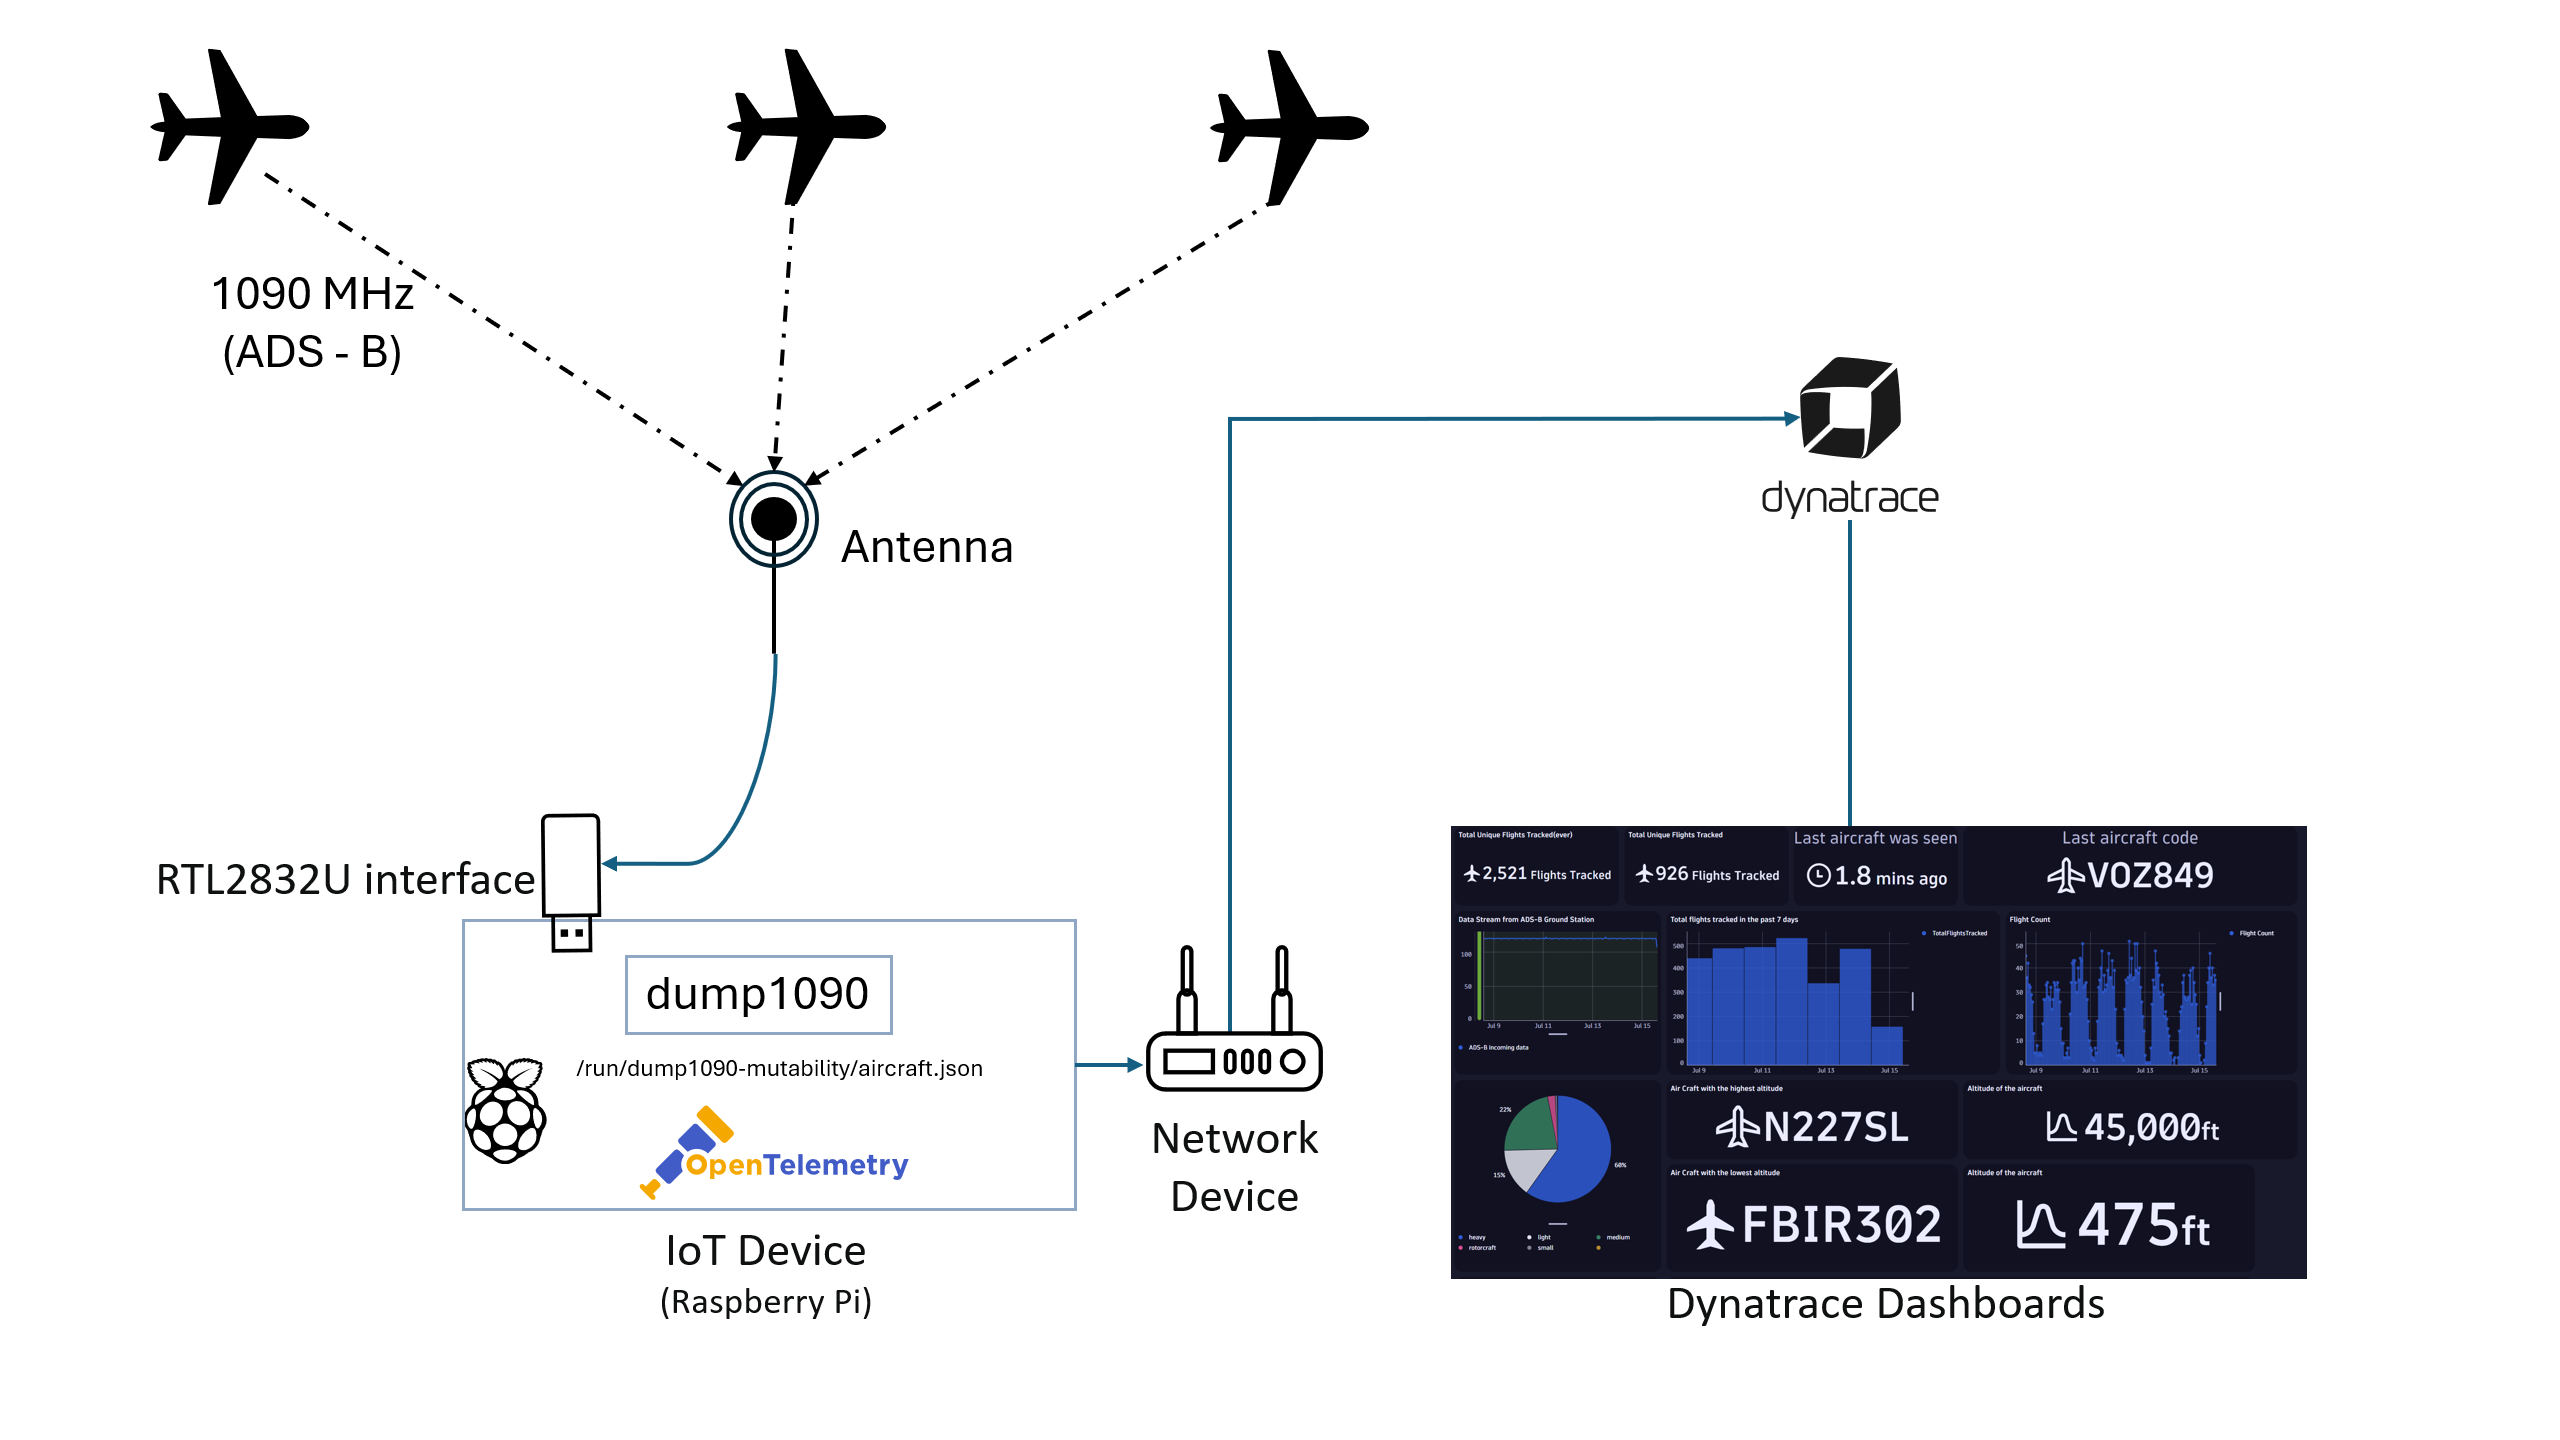
The hardware
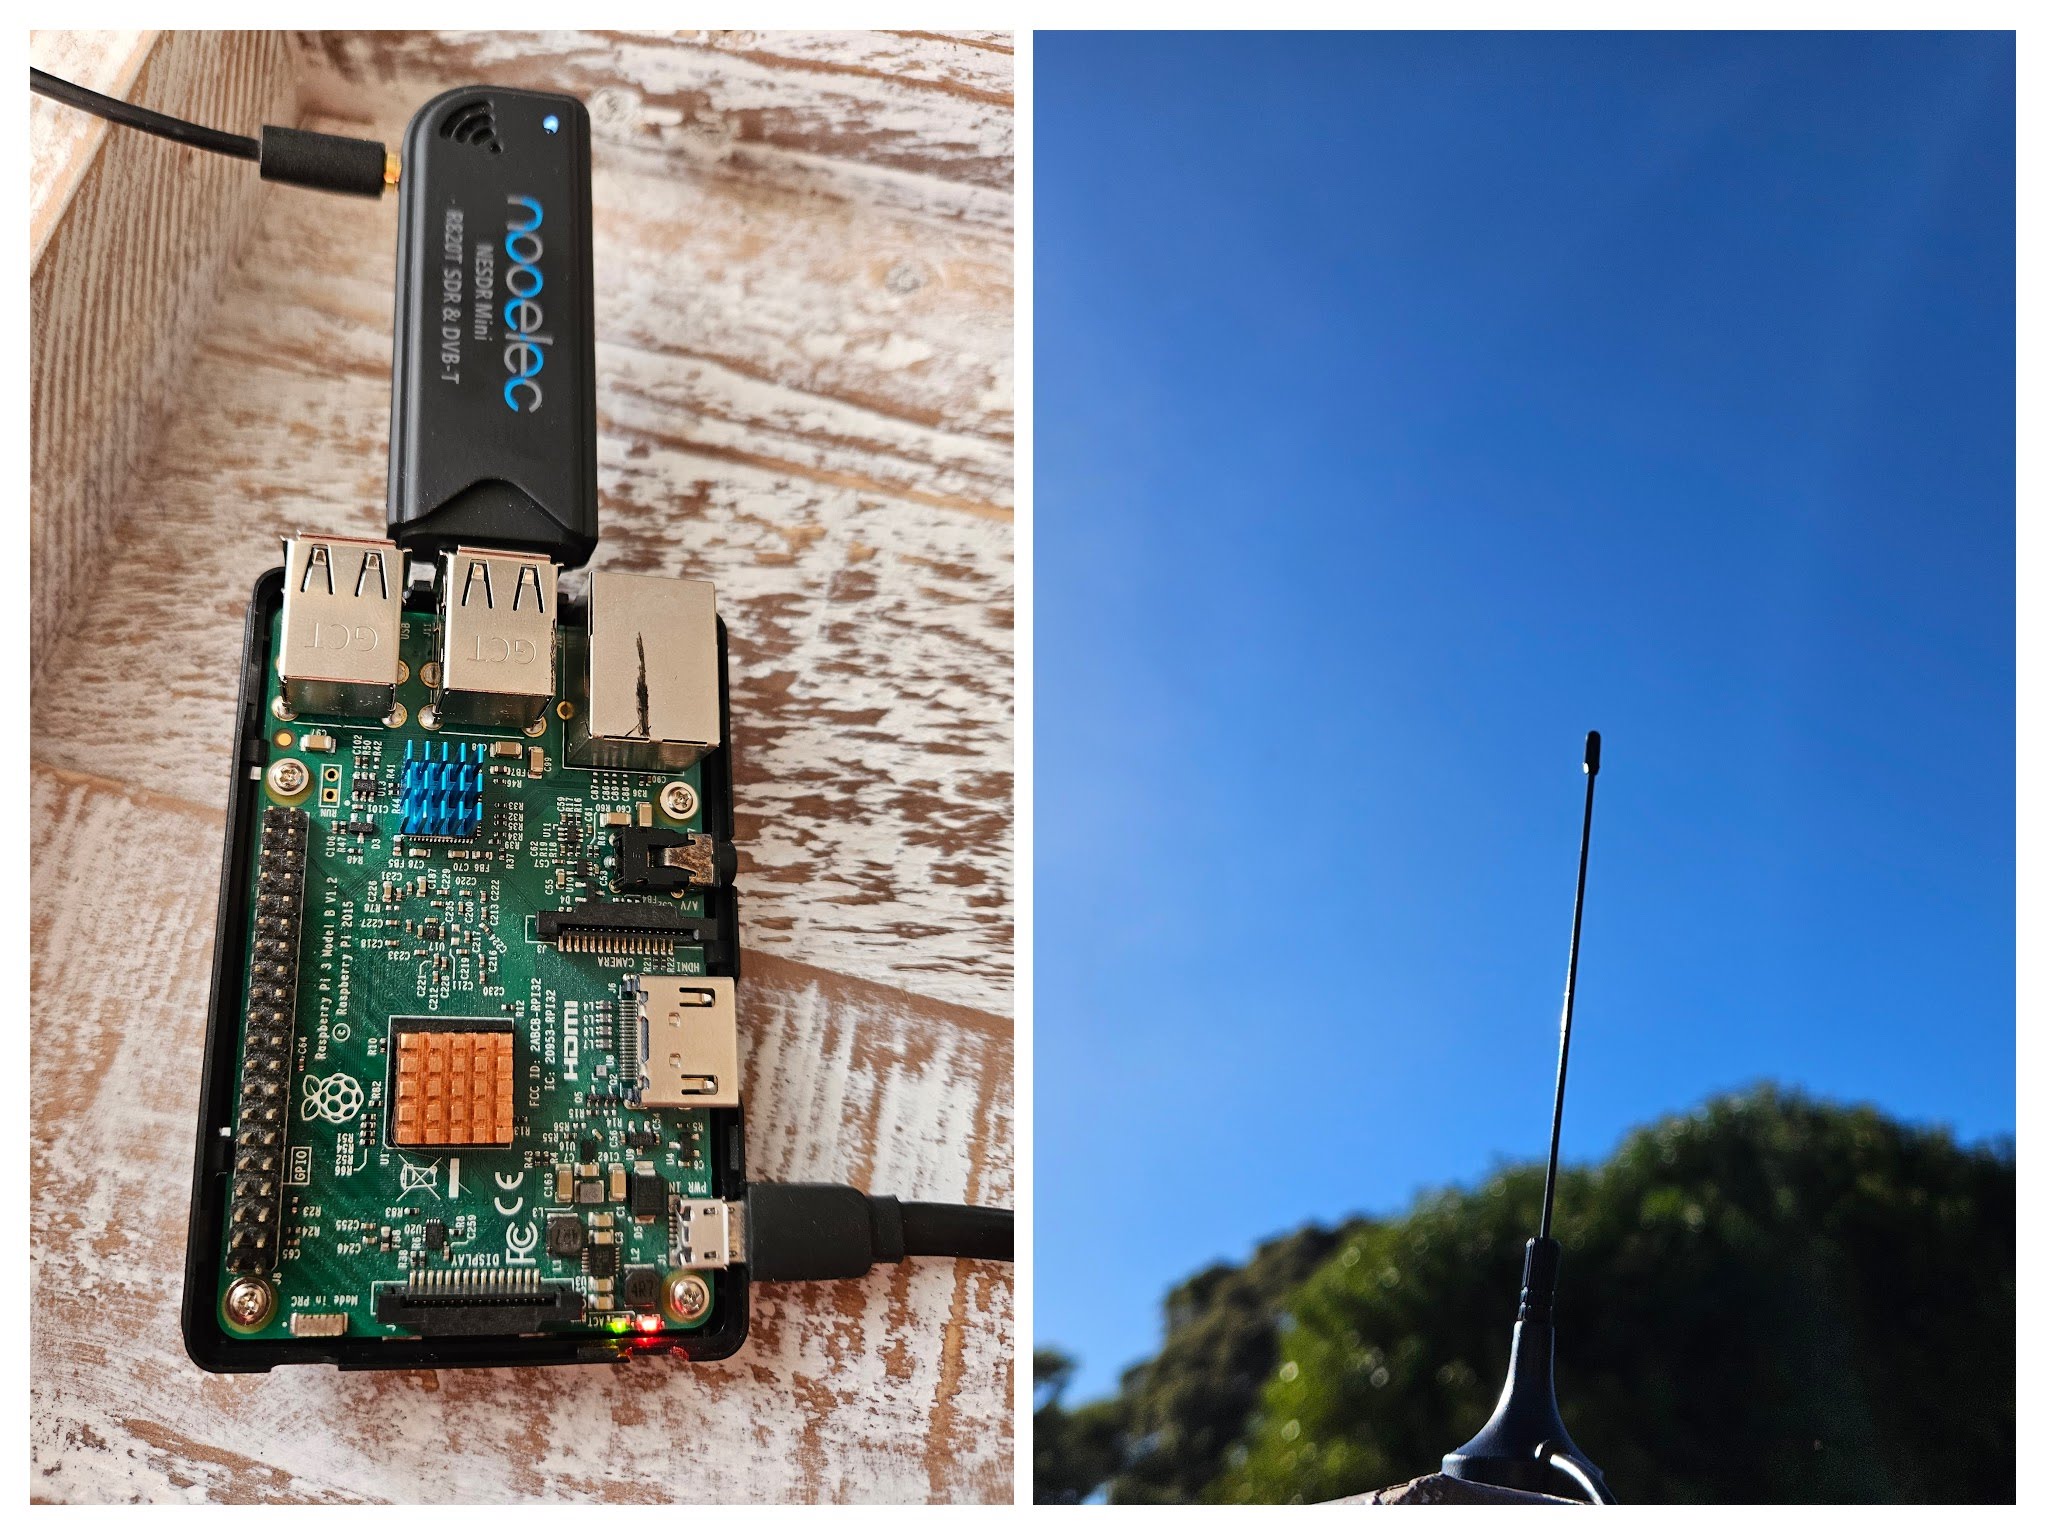
We’ll delve into collecting ADS-B data with a Raspberry Pi, equipped with a software-defined radio receiver (SDR) acting as our IoT device, which is a RTL2832/R820T2 based dongle, running an ADS-B decoder software (dump1090).
To transport our ADS-B application’s JSON log files into our Dynatrace tenant, we’ll leverage an agentless approach using open source software (OpenTelemetry).
The data format
The aircraft.json file in /run/dump1090-mutability/ contains a timestamp (now), the processed Mode S messages (messages), and an array of JSON objects for all known aircraft metrics, such as identifiers, position, altitude, speed, and signal power.
Critical data includes the aircraft’s ICAO identifier, squawk code, flight callsign, position coordinates, altitude, speed, and the time since the last message was received.
This information is essential for later advanced analytics and aircraft tracking.
Locations of critical data
- Aircraft data:
/run/dump1090-mutability/aircraft.json - History data:
/run/dump1090-mutability/history.json
View the raw data
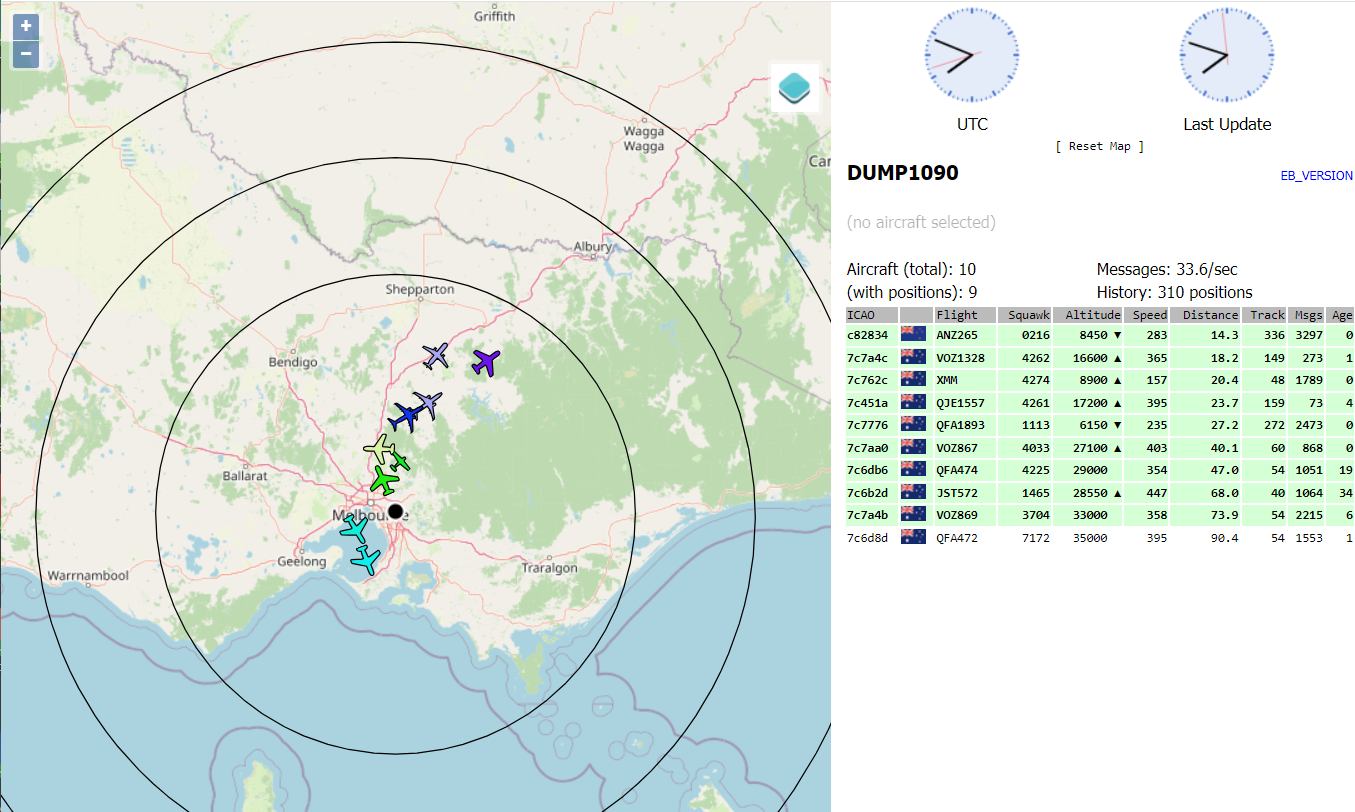
The data in dump1090, once received, can be viewed through the application user interface, accessible at: http://<your-raspberry-pi-IP-address>/dump1090/gmap.html
Why observability and data ingestion?
In our example, the ADS-B application provides an excellent visual representation for short-term live monitoring purposes. IoT devices are not meant to store data for longer periods. This is why the log files’ default location is set to /run within the device—a temporary location.
By additionally sending this data to Dynatrace, you can store data for longer periods, from 1 day up to 10 years, while gaining enhanced insights as these metrics can be correlated with other business processes.
If your IoT devices hold business-relevant metrics that can provide additional value when combined with other business processes, you should store them in Dynatrace Grail™, as demonstrated in this blog post.
Ingest decoded ADS-B data into Dynatrace
The specific log files created by the ADS-B software contain aircraft data (aircraft.json) and historical metrics (history.json). They provide detailed information that, when sent to Dynatrace, enables data analytics and improved decision-making capabilities.
The data in aircraft.json can be ingested into Dynatrace using the Dynatrace OpenTelemetry Collector, our officially supported OpenTelemetry Collector.
After extracting the collector, we simply update its configuration, the otel-collector-config.yaml file, to send the aircraft.json live feed to your tenant’s Dynatrace OpenTelemetry endpoint.
receivers:
  filelog:
    include: [/run/dump1090-mutability/aircraft.json]
    start_at: beginning
    include_file_path: true
    multiline:
      line_start_pattern: '^\{'

processors:
  attributes:
    actions:
      - key: log.source
        value: opentelemetry-iot-dump1090-collector
        action: upsert
      - key: iot-device
        value: rpi24-adsb-receiver
        action: upsert
      - key: loglevel
        value: INFO
        action: upsert
      - key: device.address
        value: IWJHUD768H
        action: upsert

exporters:
  otlphttp/dynatrace:
    endpoint: "https://<your-tenant-id>.live.dynatrace.com/api/v2/otlp"
    headers:
      Authorization: "Api-Token ${env:DT_API_TOKEN}"

service:
  pipelines:
    logs:
      receivers: [filelog]
      exporters: [otlphttp/dynatrace]
      processors: [attributes]
  telemetry:
    logs:
      level: "info"
    metrics:
      address: "0.0.0.0:8998"
Note the OpenTelemetry processor log attributes log.source and opentelemetry-iot-dump1090-collector. We’ll use these values later to filter the log data and focus on the log events from this specific IoT device and application log.
View, query, and analyze ingested IoT data
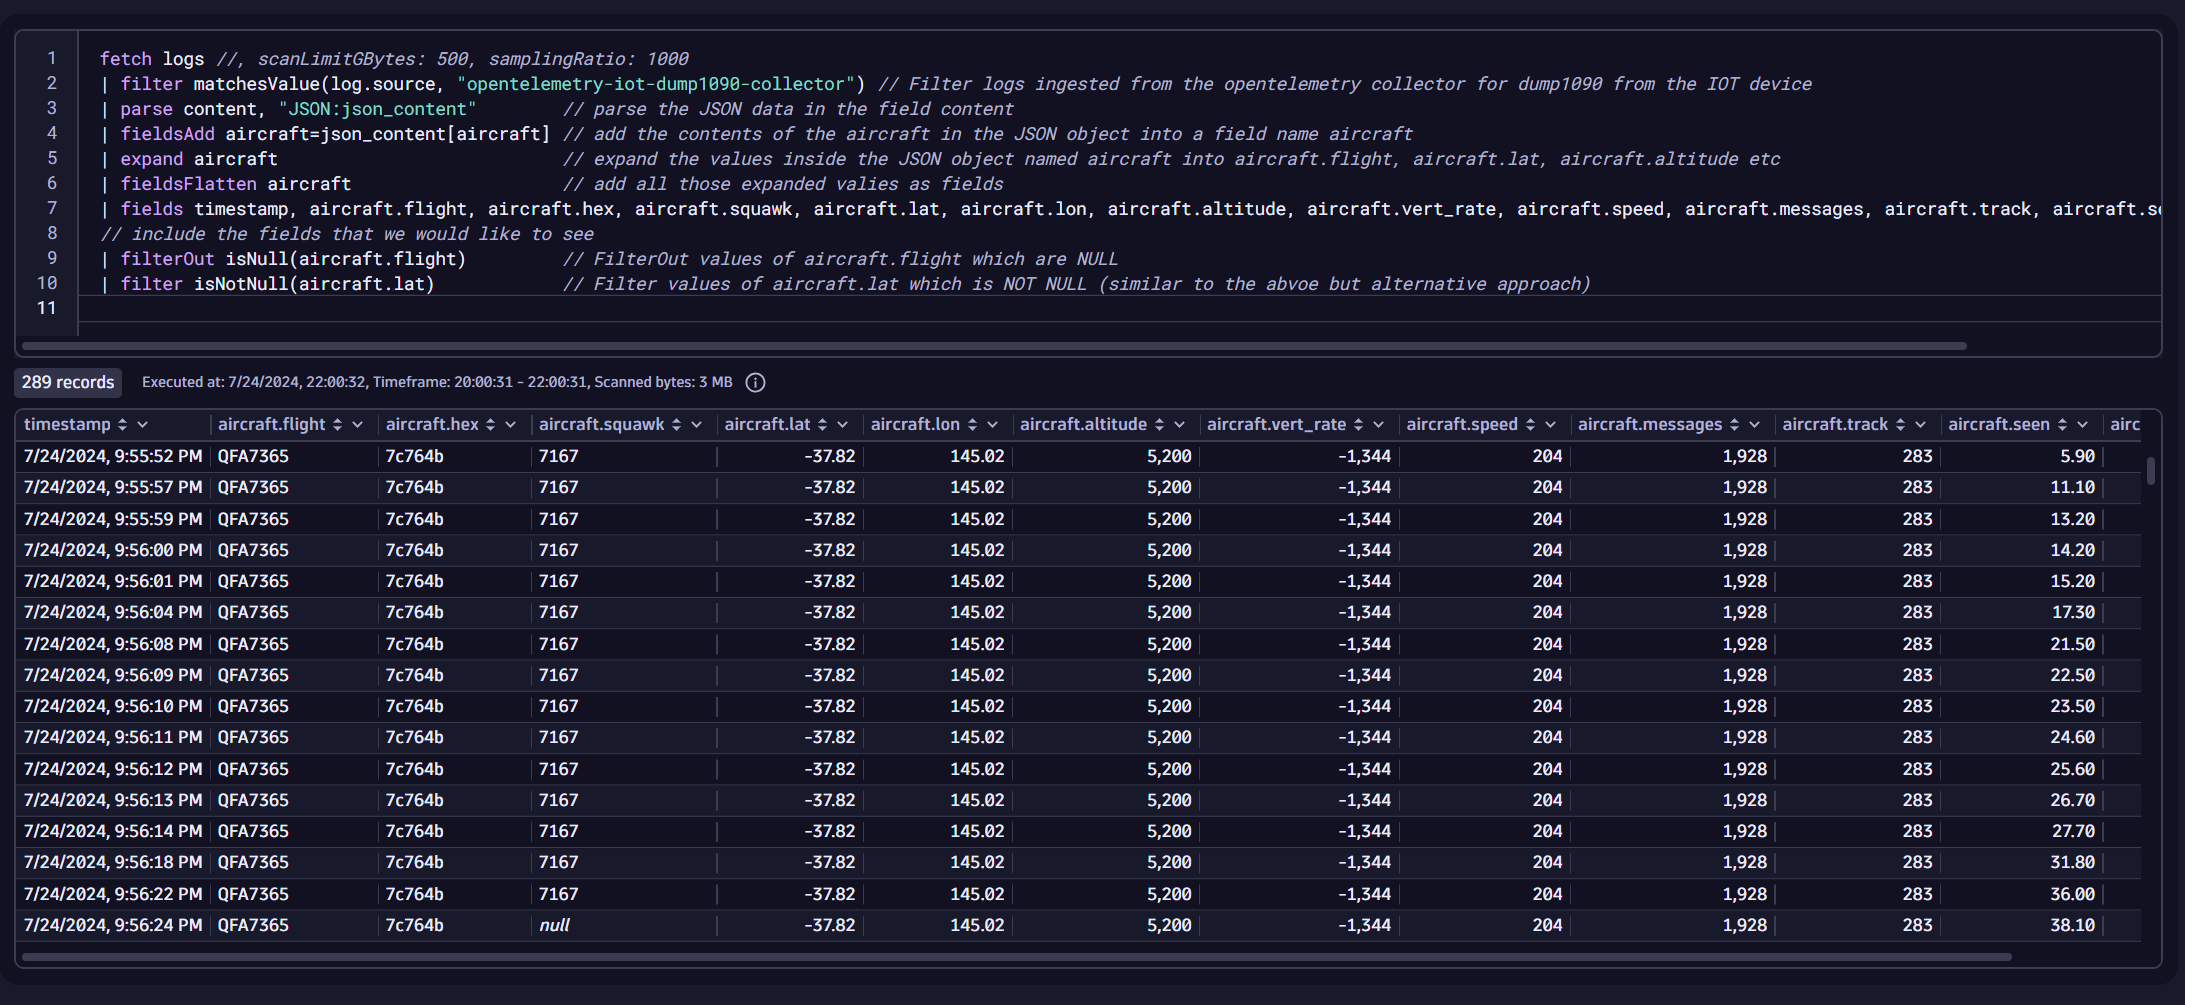
The ingested data in Dynatrace Notebooks shows that most critical information like flight callsign, location (latitude/longitude), altitude, vertical rate, speed, and aircraft category are stored in JSON format. Sample JSON data is shown below:

Dynatrace Notebooks and Dashboards allow you to analyze and visualize the ingested data. We’ll begin querying the JSON data and start extracting critical information.
Parsing JSON data is an amazingly simple and fast process, as DQL (Dynatrace Query Language) commands like expand and fieldsFlatten place all the above data into the appropriate columns and fields:
With the data now available, we’ll again use DQL to analyze and summarize various metrics further, such as the total number of unique aircraft monitored and the highest altitude recorded.
Some outputs can be displayed as single values, categorical charts, line charts, or other dashboard elements, as shown below.
Some example queries that help populate this data are shown below:
DQL query to find the aircraft traveling at the highest altitude at a given time
fetch logs, from:now() - 7d //fetches data from the past 7 days
| filter matchesValue(log.source, "opentelemetry-iot-dump1090-collector") // Filter ADS-B logs ingested by the opentelemetry collector on our IoT device
| parse content, "JSON:json_content"
| fieldsAdd aircraft=json_content[aircraft]
| expand aircraft
| fieldsFlatten aircraft
| filter isNotNull(aircraft.flight)
| filter isNotNull(aircraft.altitude)
| fields aircraft.flight, aircraft.altitude
| sort aircraft.altitude desc
| limit 1
| fields aircraft.altitude // or | fields aircraft.flight

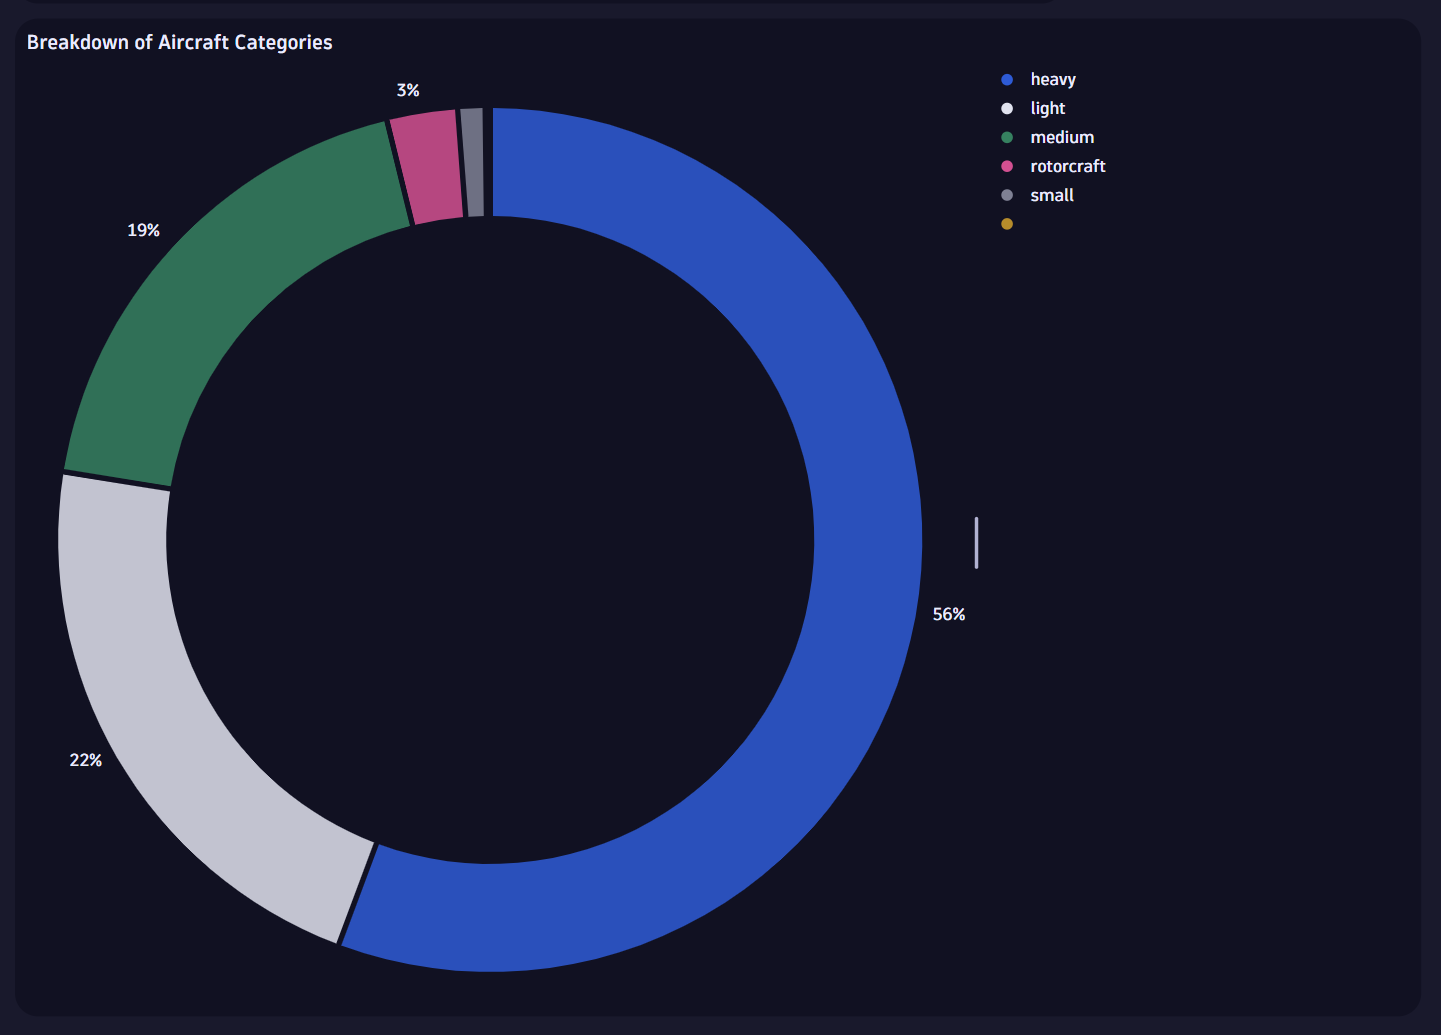
DQL query to find out the aircraft type based on the aircraft category codes that are transmitted via ADS-B
fetch logs // fetching logs without any limitation
| filter matchesValue(log.source, "opentelemetry-iot-dump1090-collector") // Filter ADS-B logs ingested by the opentelemetry collector on our IoT device
| parse content, "JSON:json_content"
| fieldsAdd aircraft=json_content[aircraft]
| expand aircraft
| fieldsFlatten aircraft
| filter isNotNull(aircraft.flight)
| filter isNotNull(aircraft.category)
| fields aircraft.flight, aircraft.category
| sort aircraft.category desc
| fields aircraft.category

 | fieldsAdd aircraft.type = if(matchesValue(aircraft.category,"A1"), "light",
 else:if(matchesValue(aircraft.category,"A2"), "medium",
 else:if(matchesValue(aircraft.category,"A3"), "medium",
 else:if(matchesValue(aircraft.category,"A0"), "heavy",
 else:if(matchesValue(aircraft.category,"A5"), "heavy",
 else:if(matchesValue(aircraft.category,"B4"), "small",
 else:if(matchesValue(aircraft.category,"A7"), "rotorcraft")))))))
 | summarize count(), by:{aircraft.type}
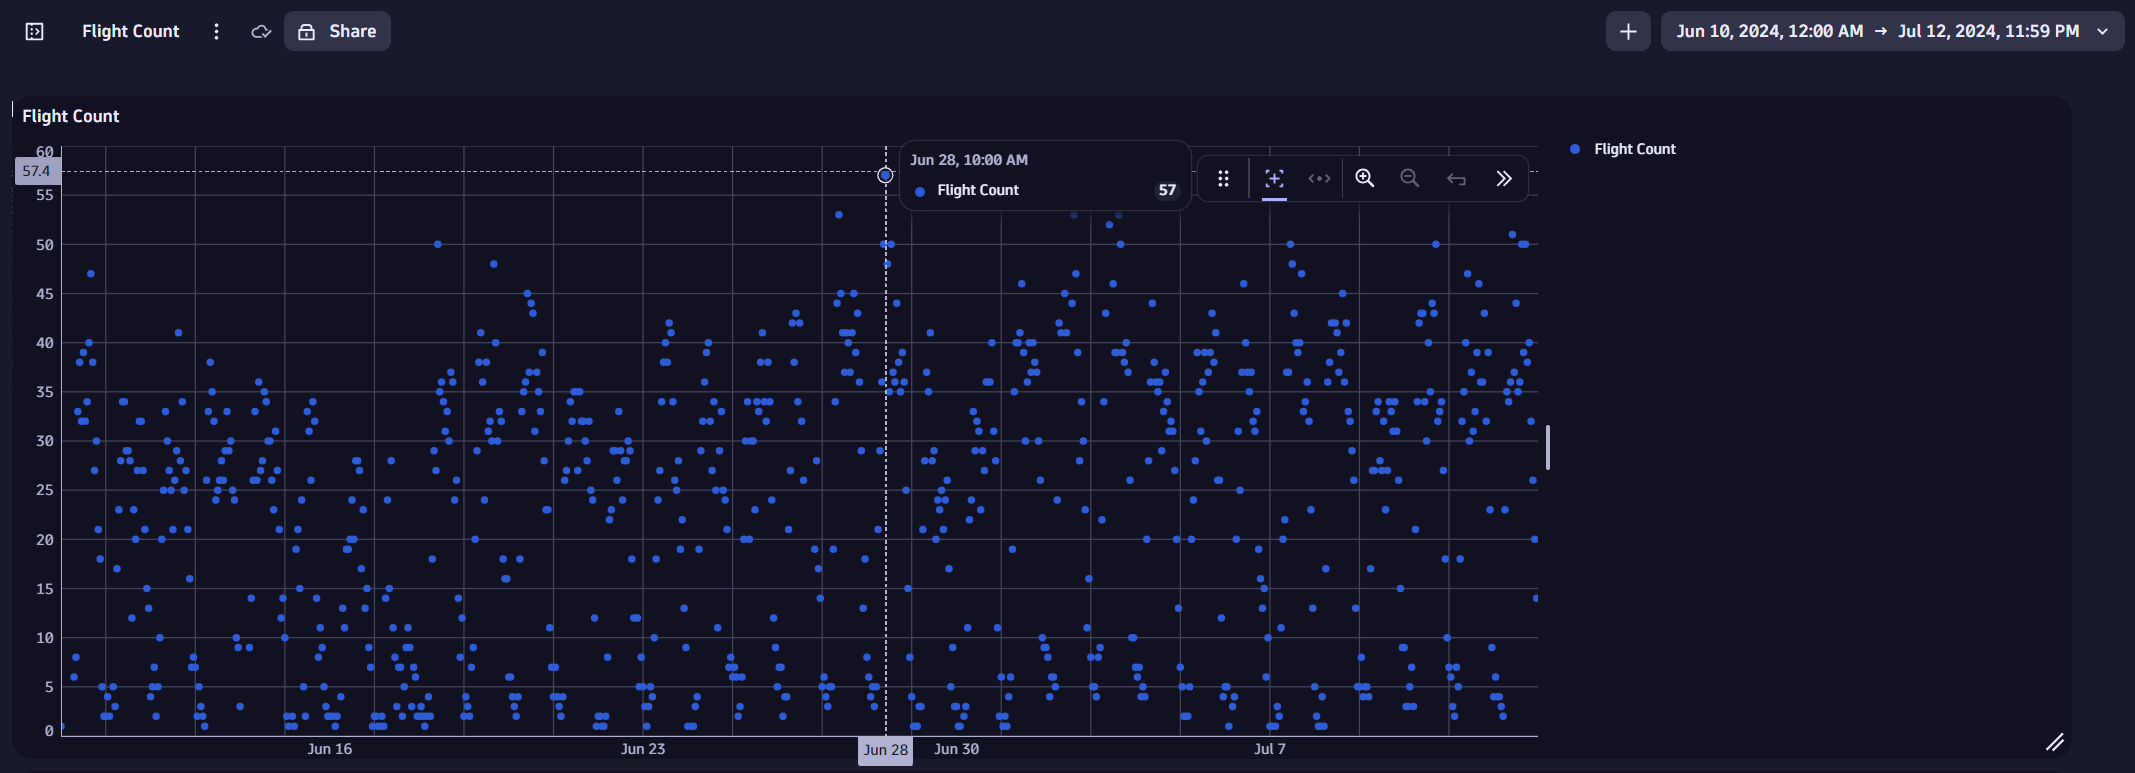
DQL Query to count the number of flights tracked per day, each hour over two months
fetch logs, from:now() - 60d // fetching the past two month of logs
| filter matchesValue(log.source, "opentelemetry-iot-dump1090-collector") // Filter ADS-B logs ingested by the opentelemetry collector on our IoT device
| parse content, "JSON:json_content"
| fieldsAdd aircraft=json_content[aircraft]
| expand aircraft
| fieldsFlatten aircraft
| filter isNotNull(aircraft.flight) AND  isNotNull(aircraft.altitude)
| filterOut aircraft.altitude == "ground"
| fields aircraft.flight, timestamp
| summarize no_of_flights = countDistinct(aircraft.flight), by:{bin(timestamp, 1h), alias:timestamp}
| fields timestamp,`Flight Count` = no_of_flights
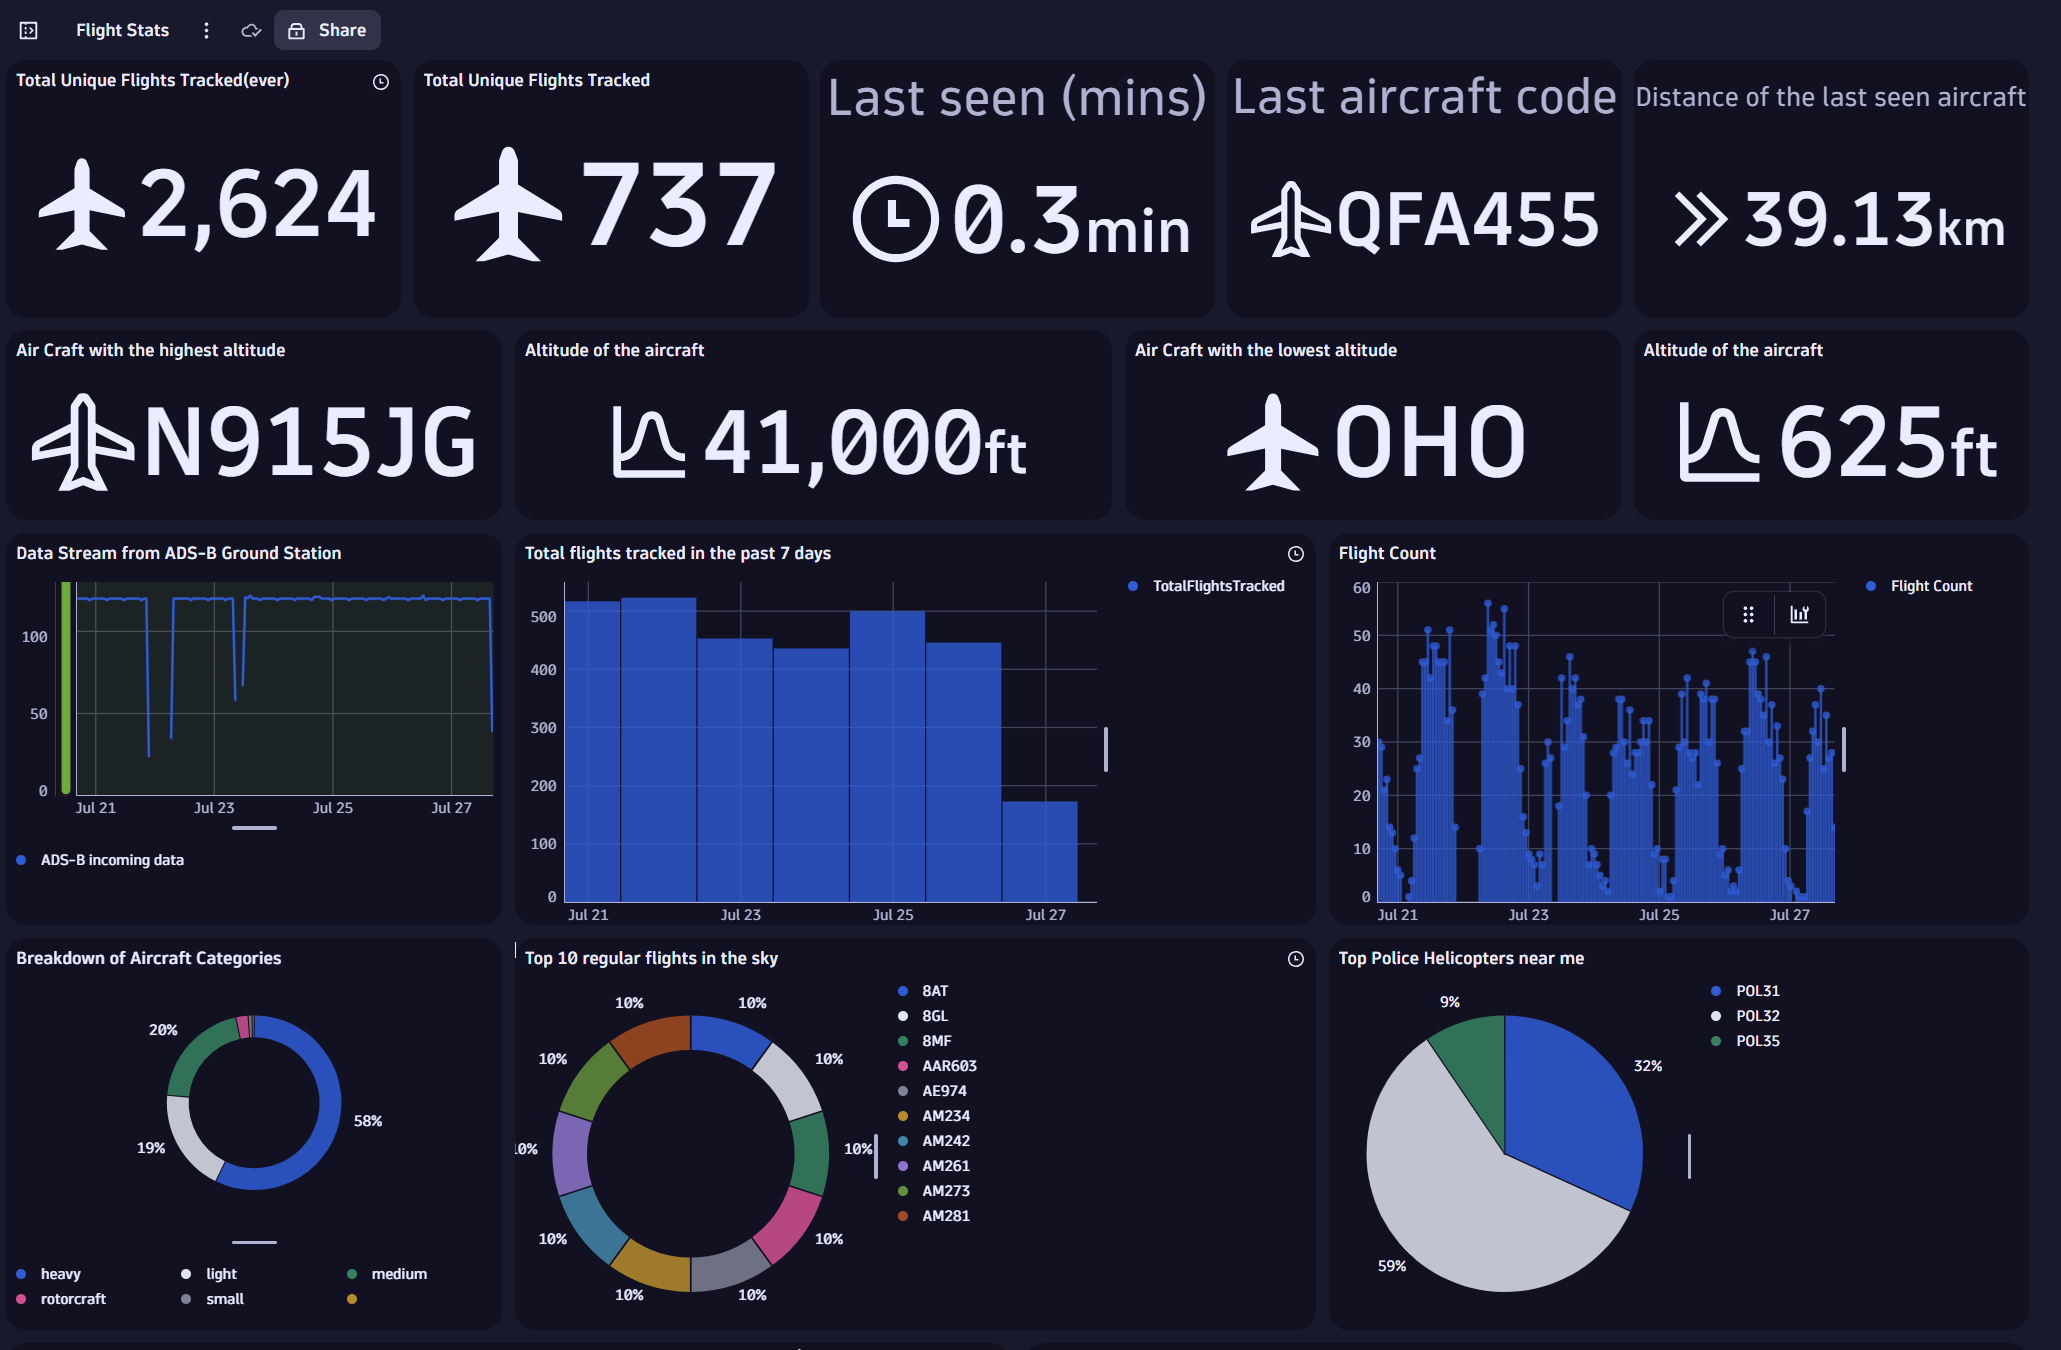
Like the above queries, we can extract critical aircraft statistics and data to report them on a dashboard like the one seen below. Some of the statistics that were captured and useful for various other verticals are:
- Total unique flights tracked over the selected time frame
- Time since the aircraft was last seen
- Callsign of the aircraft with the lowest altitude
- Flight tracked per day and hour
(Interested in using this dashboard in your Dynatrace environment? Download the JSON data)
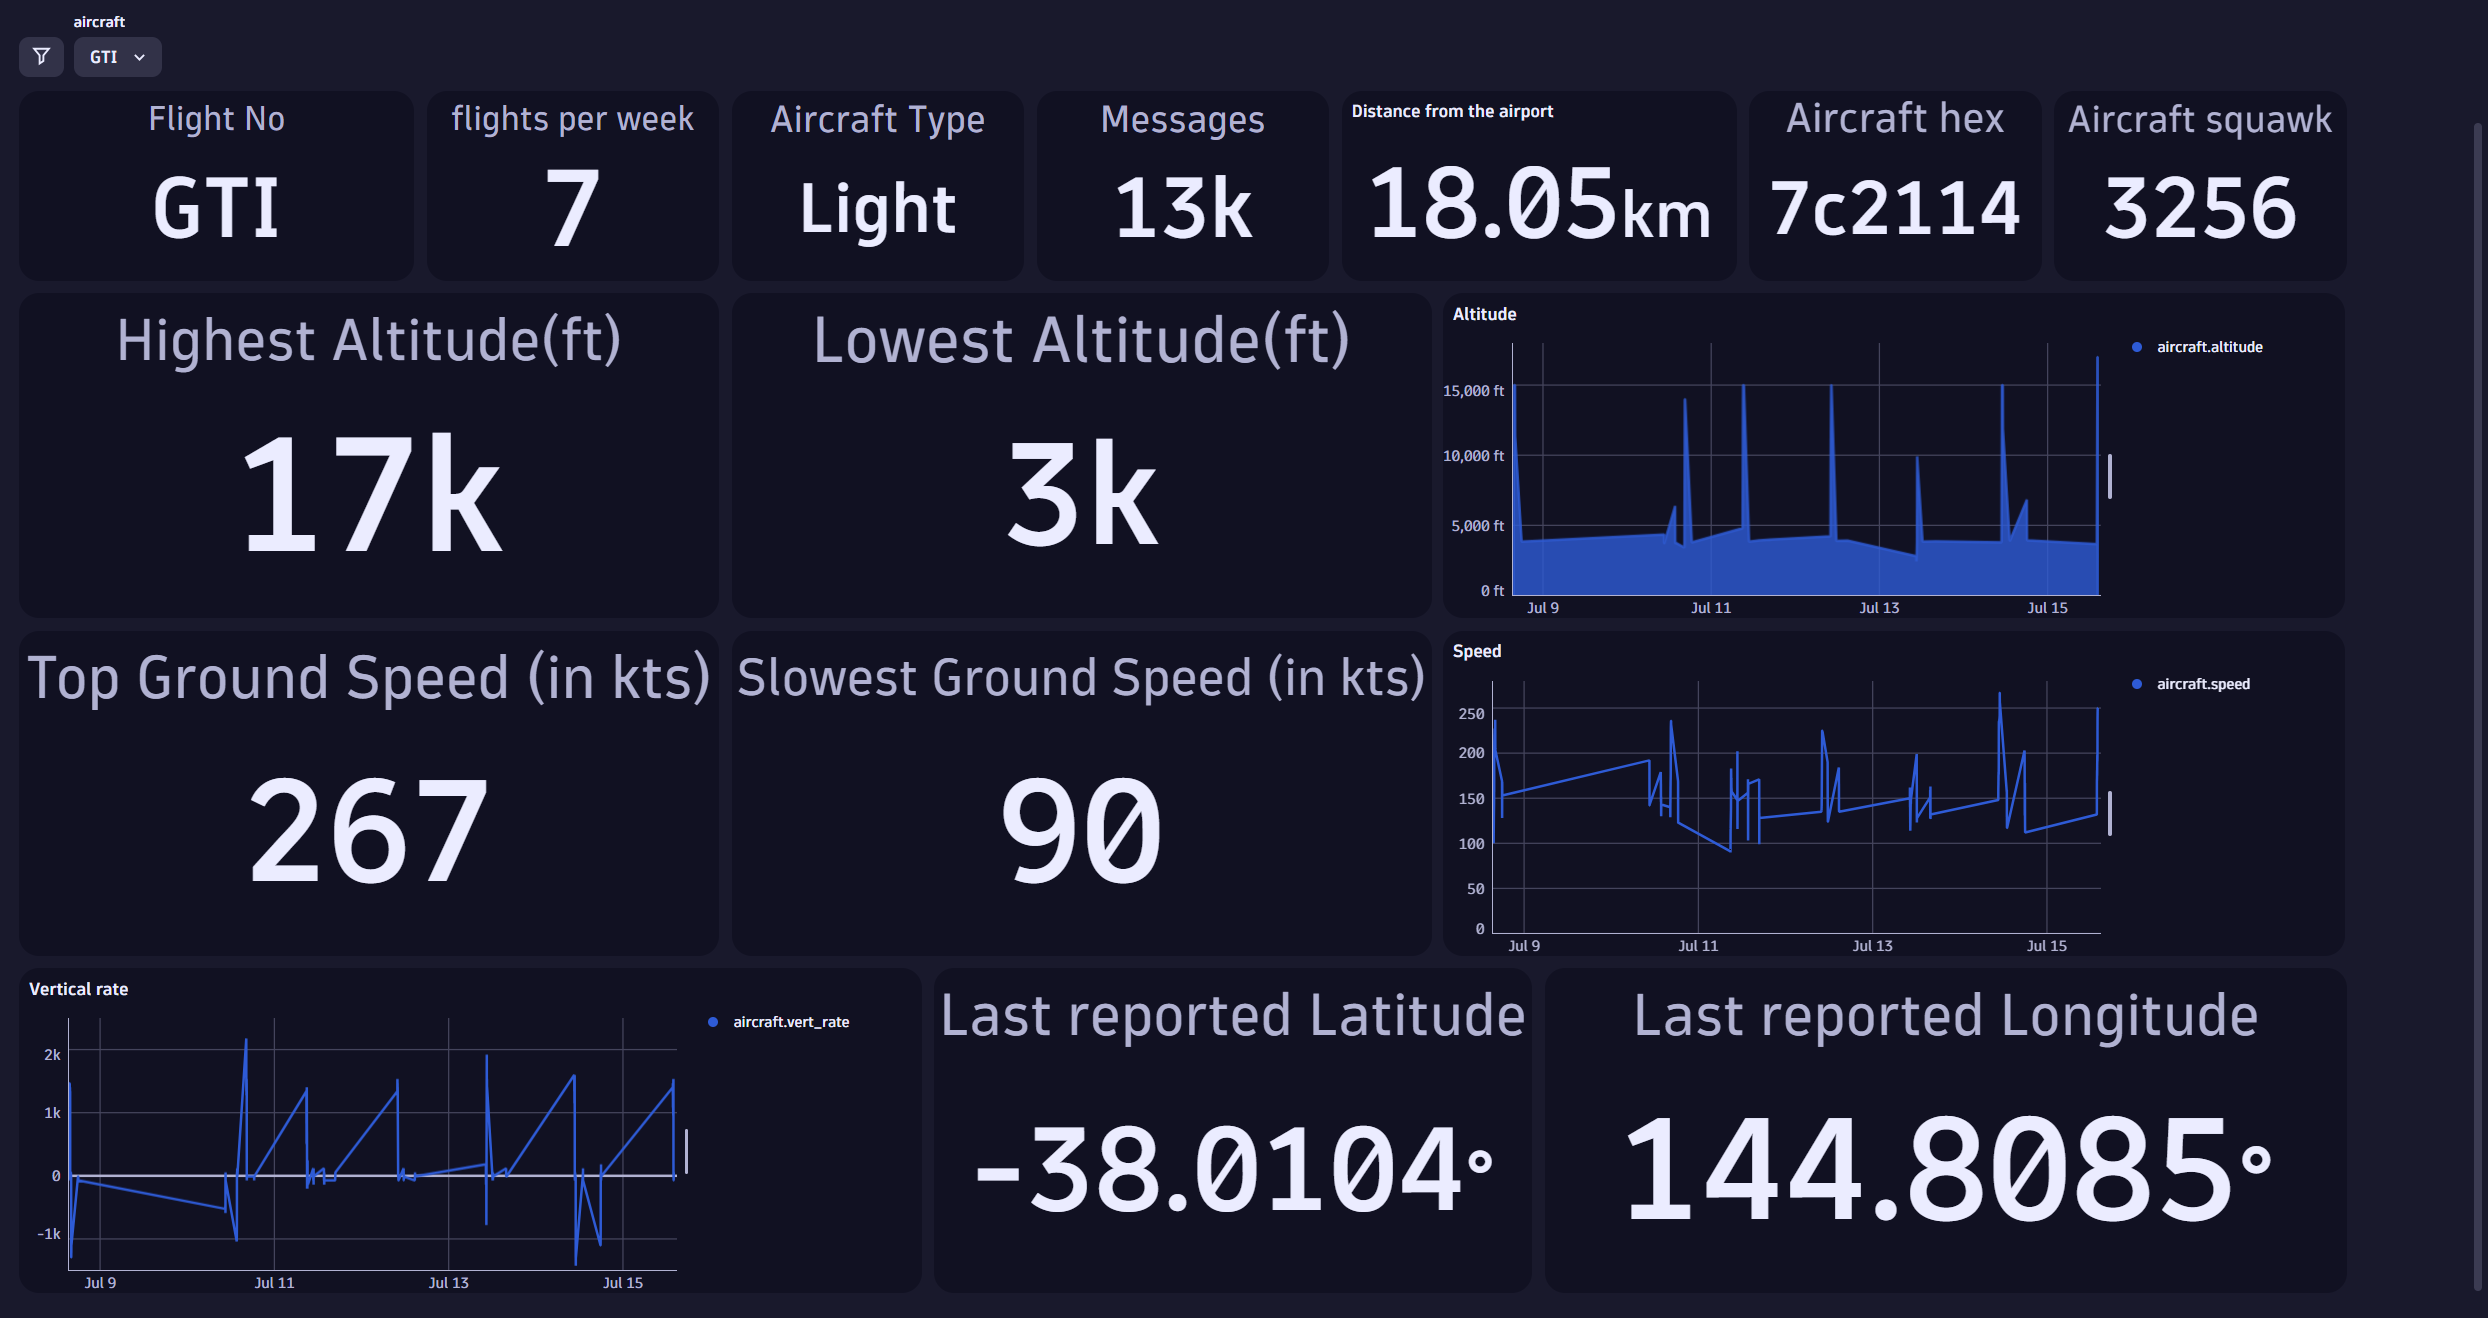
Often, we need to examine data related to a specific aircraft in depth. Adding the aircraft callsign as a variable can achieve this.
In the dashboard below, we dynamically use a variable resulting from a DQL query. This variable is then used as a filter in other dashboard tiles, restricting the view to the specific aircraft the user selects.
(Interested in using this dashboard in your Dynatrace environment? Download the JSON data)
Advanced mathematics and data science in Dynatrace
Looking at the raw data we have just seen, how are we able to tell the distance to an aircraft from a given point? Additionally, how can we determine the distance of the aircraft to the destination airport?
This information is not directly available from the raw ingested logs and metrics but is calculated using the aircraft’s latitude and longitude within Dynatrace. In the previous dashboard, you might have noticed a tile titled “Distance.” That tile’s value value was calculated using DQL.
To provide such insights, we need to apply mathematical formulas to calculate the distance between an aircraft and an airport. We use the Haversine formula to calculate the distance as we already have the aircraft’s latitude and longitude through the ingested logs.
The Haversine formula is an equation used in navigation to calculate the shortest distance between two points on the surface of a sphere, given their longitudes and latitudes. It accounts for the Earth’s curvature and is helpful in determining great-circle distances between two locations.
Distance calculations using trigonometric functions
Dynatrace supports advanced analytics and mathematical functions such as trigonometric, allowing us to accurately compute the distance from the aircraft to the airport on demand.
Applying this formula in DQL provides us with the distance from the Aircraft to the airport. Here is an example of the formula written in DQL:
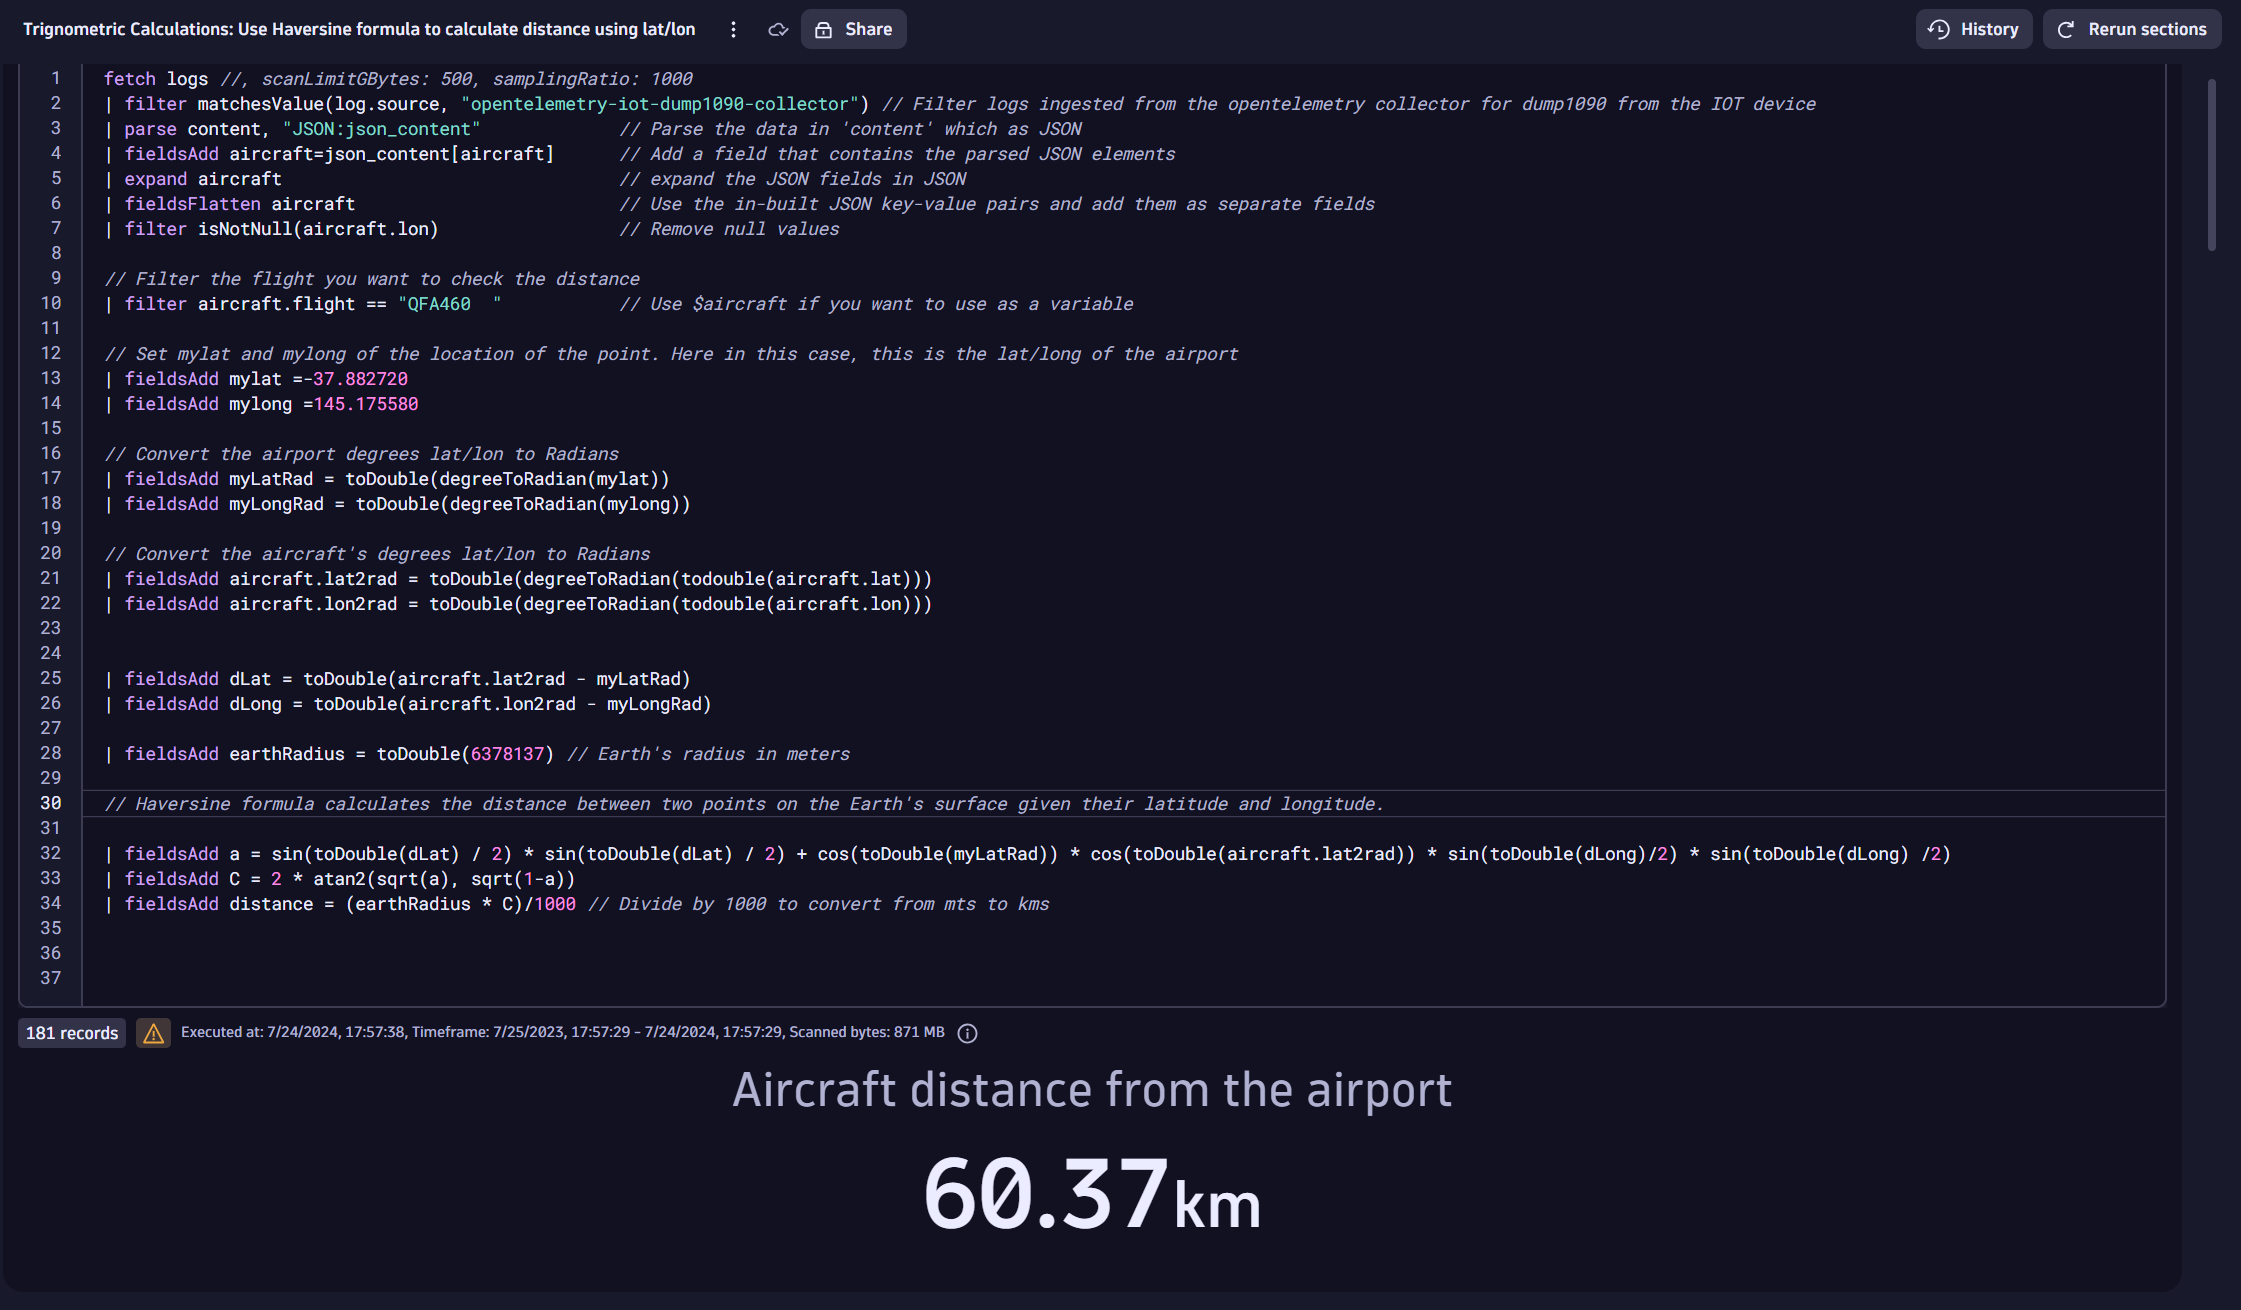
The trigonometric calculations used above in DQL are shown here:
// Haversine formula calculates the distance between two points on the Earth's surface given their latitude and longitude.
| fieldsAdd a = sin(toDouble(dLat) / 2) * sin(toDouble(dLat) / 2) + cos(toDouble(myLatRad)) * cos(toDouble(aircraft.lat2rad)) * sin(toDouble(dLong)/2) * sin(toDouble(dLong) /2)
| fieldsAdd C = 2 * atan2(sqrt(a), sqrt(1-a))
| fieldsAdd distance = (earthRadius * C)/1000 // Divide by 1000 to convert from mts to kms
The DQL queries above demonstrate the powerful capabilities of Dynatrace in solving complex business problems encountered in the field.
Similar mathematical calculations can be utilized in other industries, such as:
- Warehouse location planning: Combine sales and shipping metrics to determine optimal locations for new warehouses based on distance to the customer.
- Emergency services: Calculate the nearest hospitals or medical facilities for ambulances and emergency responders to ensure quick response times.
- Agriculture field management: Calculate distances between different plots of land to optimize the use of machinery and labor.
- Mining: Leverage real-time distance monitoring of mining trucks and heavy machinery for operational safety purposes.
Monitor IoT devices and environmental data
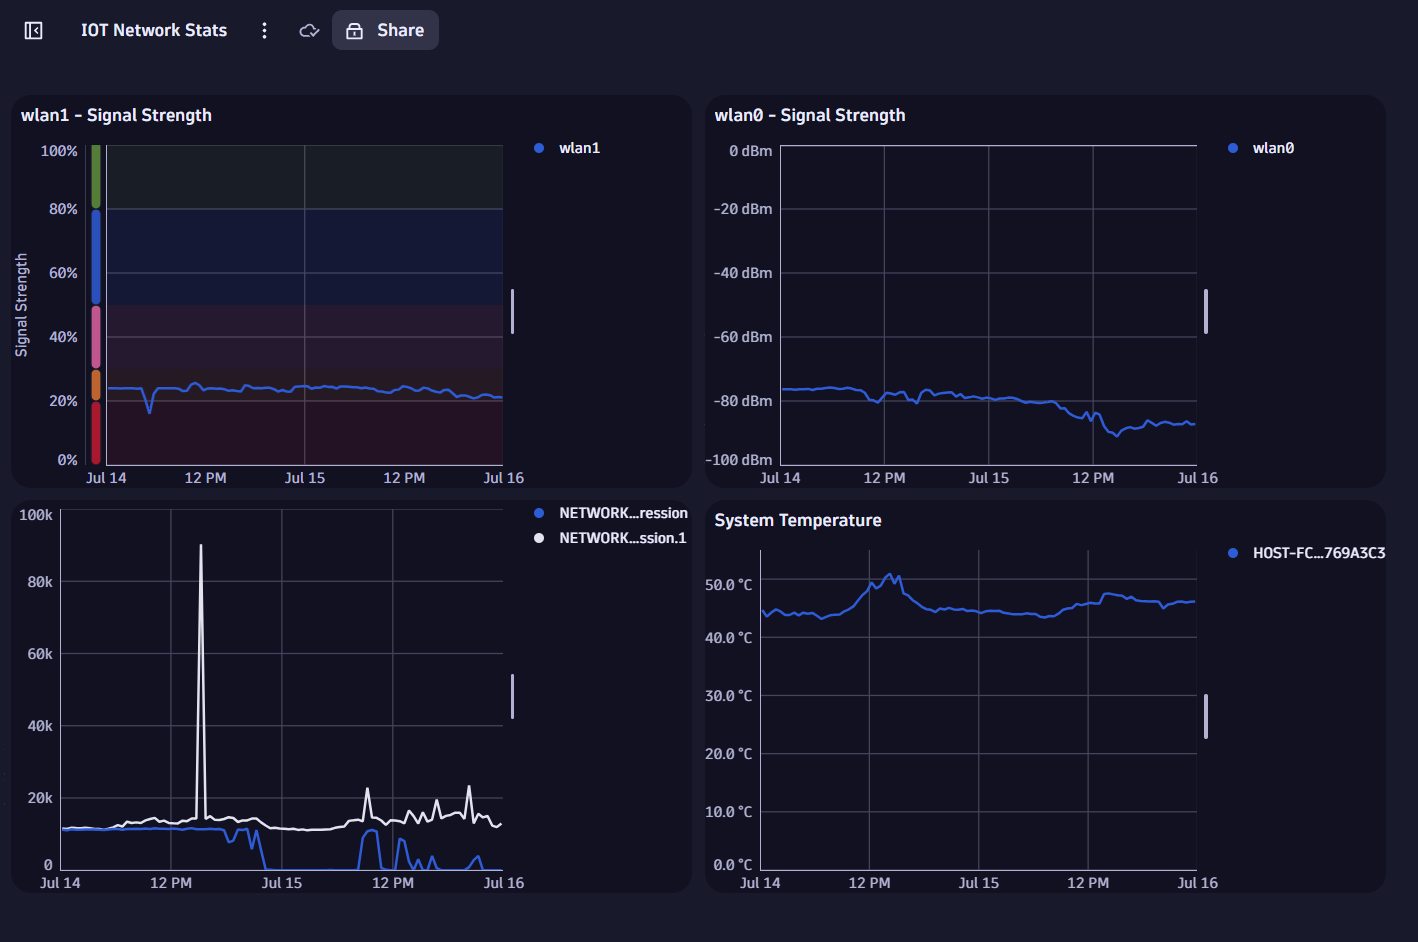
IoT devices are often deployed outdoors, making monitoring their network signal strength and quality crucial, considering typical IoT networks such as LoRa, BLE, cell signal, and health metrics such as temperature or other environmental data, rather than just CPU and memory utilization.
To monitor such advanced metrics, you can leverage Dynatrace custom metrics functionality. A script can periodically collect additional data and send it to the Dynatrace metric ingestion endpoint.
Conclusion
IoT devices are now common in industrial, agricultural, space, utilities, hospitals, mining, and several other industries. Extracting critical business data from these devices in real time is now possible using OpenTelemetry and the powerful analytical capabilities of Dynatrace.
By integrating ADS-B airplane data and using trigonometric calculations, we’ve provided advanced analytics for actionable insights while visualizing them within dynamic dashboards.
This blog post provides real-world use cases and demonstrates how Dynatrace can extend existing real-time IoT monitoring systems by leveraging OpenTelemetry. It also highlights the value of IoT monitoring across various industries and provides a hands-on guide to using DQL for advanced analytics, empowering you to extract deeper insights from your data.


Looking for answers?
Start a new discussion or ask for help in our Q&A forum.
Go to forum