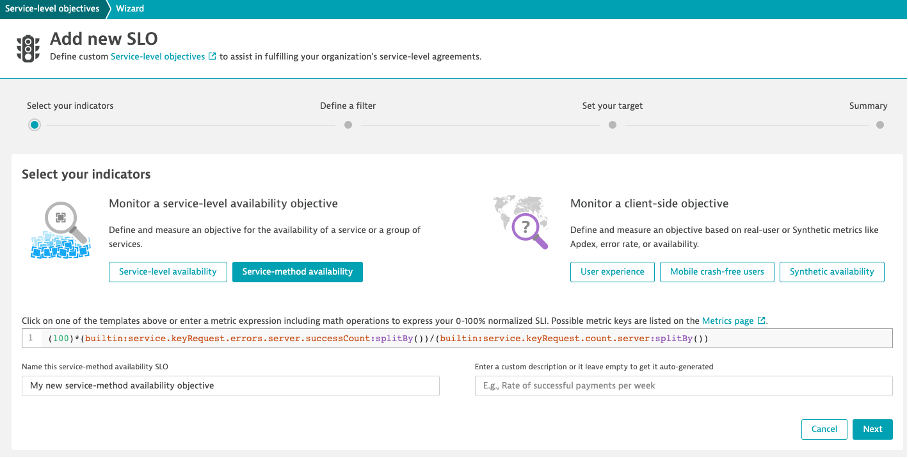
To enable a holistic view of your applications and services across the entire software development lifecycle, we recently introduced in-product guidance and templates for setting up Service-Level Objectives (SLOs) with key metrics, analytics, and anomaly detection. Recently, we enabled further Davis AI insights with proactive prediction of SLO violations and problem root cause analysis for incidents that impact SLO. In this article, we’ll shine a light on how you can further improve your SLO monitoring with the assistance of metric expressions.
Math can extend the versatility of your SLOs
How often do you encounter the need for a new metric that’s a subset or combination of other raw metric data? For example, you want to know the success rate of a service, but you only have the opposite, the failure rate.
You can now transform such raw data into meaningful numbers for your specific context by performing calculations with metrics. This capability can be used throughout the Dynatrace platform, for example, in the Data explorer.
SLOs provide a common language that anyone can read as a normalized 0-100% success rate with a specific percentage as the target—for example, 99% of your API requests should return with positive HTTP response codes within a Response time of 500 ms.
For SLOs, you might want to combine multiple metrics into a single success rate. For example, you can assess the success rate of multiple services by aggregating them into a single success rate. Dynatrace already provides many out-of-the-box metrics that you can use to calculate success rates in this way. Besides built-in metrics, you can also ingest your own custom metrics.
Raw metric data typically doesn’t align with a 0-100% rating and needs to be further processed. For example, you might divide the number of successful requests by the total number of requests and then multiply by 100, as in this metric expression:
(100)*(builtin:service.keyRequest.errors.server.successCount:splitBy())/(builtin:service.keyRequest.count.server:splitBy())
SLO templates with metric expressions
Dynatrace now provides SLO configuration based on metric expressions comprised of multiple metrics and mathematical operations.

Let’s have a look at the SLO templates that are provided in the SLO wizard to see how they translate into metric expressions, without filtering for specific entities:
- Service-level availability:
(100)*(builtin:service.errors.server.successCount:splitBy())/(builtin:service.requestCount.server:splitBy()) - Service-method availability:
(100)*(builtin:service.keyRequest.errors.server.successCount:splitBy())/(builtin:service.keyRequest.count.server:splitBy()) - User experience:
(100)*(builtin:apps.web.actionCount.category:filter(eq("Apdex category",SATISFIED)):splitBy())/(builtin:apps.web.actionCount.category:splitBy()) - Mobile crash-free users, which is already a normalized 0-100% metric:
(builtin:apps.other.crashFreeUsersRate.os:splitBy()) - Synthetic availability, which is already a percentage-based metric:
(builtin:synthetic.browser.availability.location.total:splitBy())
Please note that metric dimensions used for metric splitting (for example, service name) need to be compatible in your calculations. You can, for example, add :splitBy() to easily remove all dimensions from the metrics used in your calculations.
More metric expression examples for SLO calculations
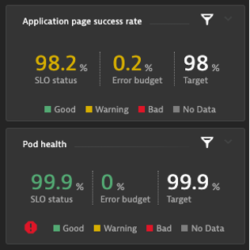
Another example (see the top row in the tile image below), taken from a recent article on how to chart calculation results, is application action success rate, which includes a count of web actions with errors divided by all browser load actions. You need the inverse to arrive at the success rate:
(100)*((1)-((builtin:apps.web.action.countOfErrors:splitBy())/(builtin:apps.web.action.count.load.browser:splitBy())))
An interesting Kubernetes-related status is the percentage of healthy pods (see the bottom row of the tile image above):
(100)*(builtin:cloud.kubernetes.workload.runningPods:filter(and(in("dt.entity.cloud_application",entitySelector("type(cloud_application),healthState(~"HEALTHY~")")))):splitBy():avg)/(builtin:cloud.kubernetes.workload.runningPods:splitBy():avg)Please note that while the status for pod health on the SLO dashboard tile example above is green, the red icon in the lower-left corner indicates risk due to problems related to the cloud application entities. For more details about SLO risk prediction provided by Dynatrace, see this blog post.
Learn more
You can read more about upcoming SLO features and see how we make the work of SREs easier in this Dynatrace Community forum.
Or read up on how you can easily master your SLOs.


Looking for answers?
Start a new discussion or ask for help in our Q&A forum.
Go to forum