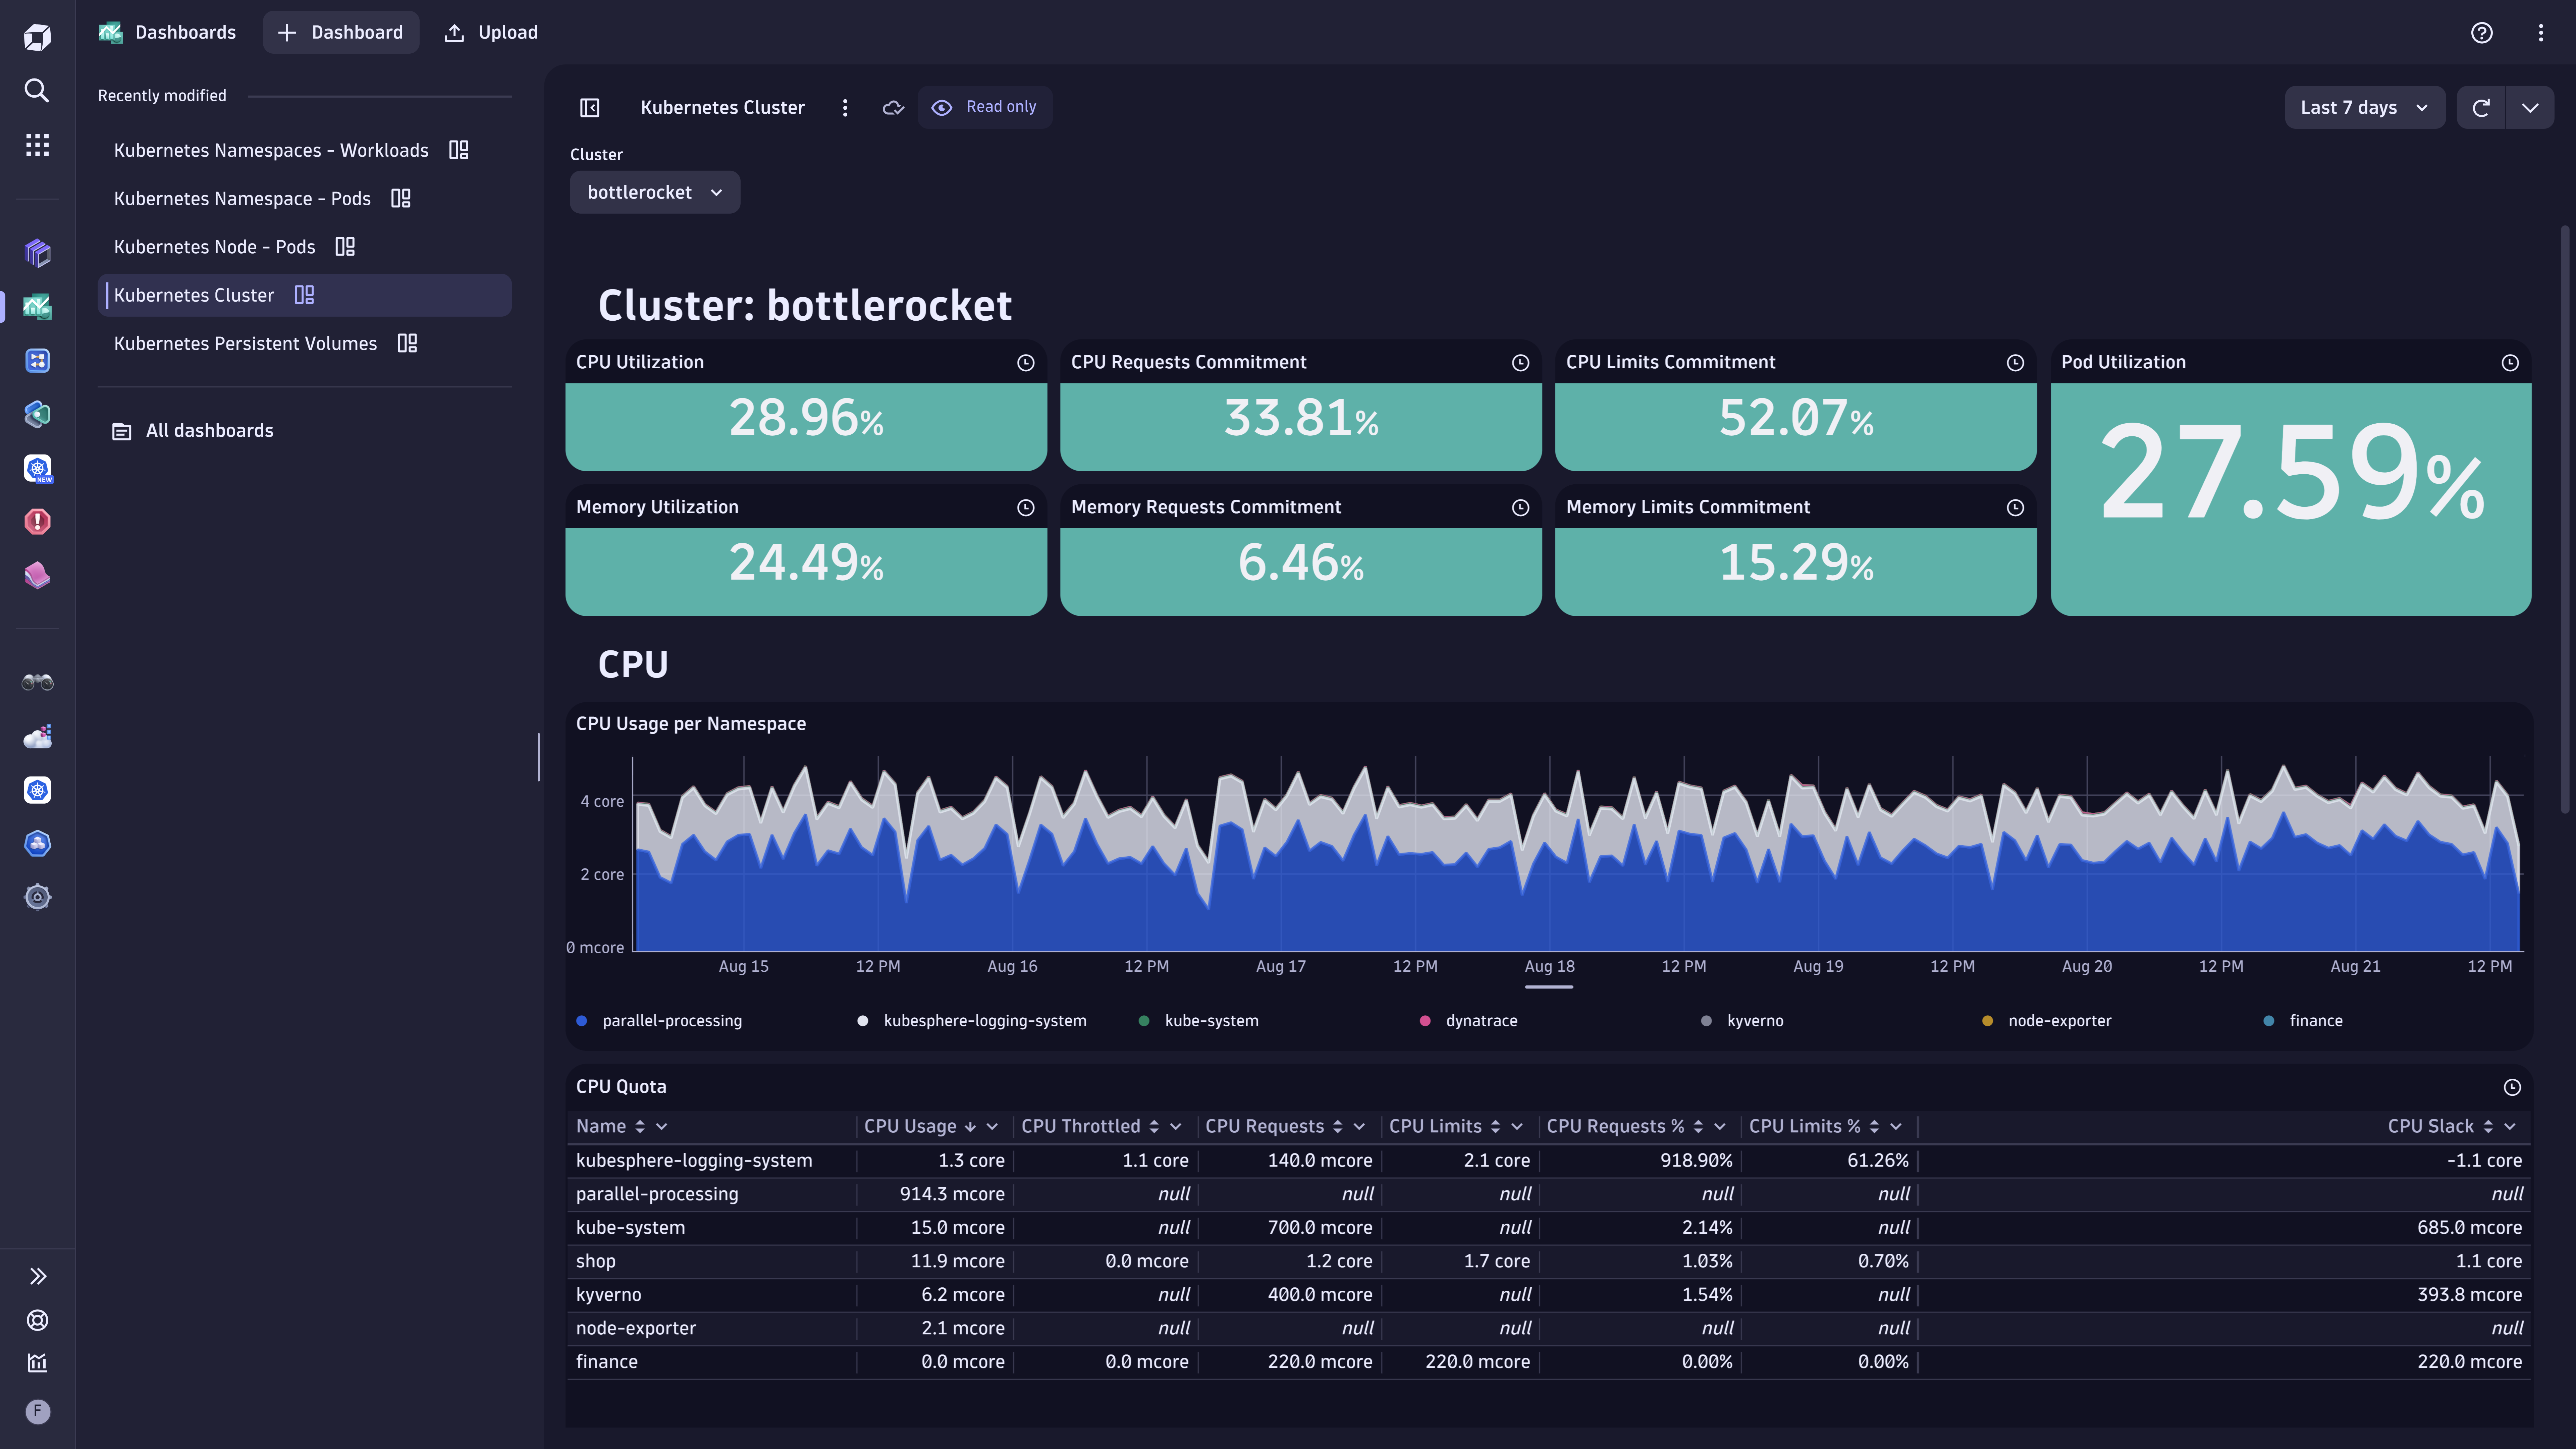
The ability to see all the data you need in one place is critical. If you’re a Kubernetes user, no matter your proficiency level, dashboards are necessary because they tell you where there are problem areas and make your life infinitely easier by allowing you to troubleshoot and optimize your clusters faster. With Dynatrace’s ready-made and easily customizable dashboards, get all the data you need in one place to easily troubleshoot and optimize your Kubernetes environments.
Managing Kubernetes environments can be challenging due to their distributed and ephemeral nature. This makes it difficult to easily find the information you need to ensure your environments are stable, efficient, and scalable. A common tool to stay on top of this challenge is dashboards, as they allow you to display the most important signals in one place and allow for easy customization. Especially in the open-source community, dashboards are the go-to tool for monitoring and optimizing Kubernetes environments.
When troubleshooting, having all your data in one place, especially in one view, is critical. While dashboards provide an easy means to see all signals in one place, setting up and scaling data management is a huge challenge for many teams relying on open-source monitoring solutions. Most of the time, teams end up with dashboards that show signals only from a small subset of their overall Kubernetes environment.
That’s why we built our ready-made dashboards utilizing the context-rich data provided by Dynatrace Grail™, the only causational data lakehouse with massively parallel processing. With Grail, you truly get all your data in one place while still being able to easily customize it to your preferences.
New Dynatrace dashboards for Kubernetes give platform engineers a more intuitive and optimized experience with the look and feel they already know and love.

Seamless Dynatrace experience
Easy dashboard customization is key, giving you a seamless Dynatrace experience and allowing you to harness the full power of the Dynatrace platform. With Dashboards, you can see both the Kubernetes data you want and the observability data you need within the Dynatrace platform. As all data is connected within the Dynatrace platform, you can seamlessly jump from viewing namespaces in a dashboard to their respective details within the Kubernetes app and vice versa. This allows for highly efficient navigation throughout Dynatrace, ultimately allowing you to find the information you’re looking for much faster than in any other tool. Of course, this applies to Kubernetes and any data residing in Dynatrace. The opportunities are limitless. Put Kubernetes and tracing data together with log and event data. Choose only the data and capabilities you and your team need. Design your dashboards with the exact data you need to ensure you’re working optimally from a single view.
How it works
The Kubernetes ready-made dashboards show you the most crucial information from your Kubernetes environment. From there, it’s easy to customize them to your personal preferences. Start with one of the platform’s base dashboards and customize it to your needs. With just a few clicks, you can add platform app data directly to your dashboards. For example, quickly add related logs of workloads to your dashboard directly from the Kubernetes app, as shown below.

Rather than starting with a blank page, you can easily add or remove what you need or don’t need for any scenario. Today, we provide you with the five most used dashboards for Kubernetes observability:
- Kubernetes Cluster: Get broad visibility into the scale, status, and resource usage of your Kubernetes clusters.
- Kubernetes Nodes – Pods: Understand pod resource consumption on your Kubernetes nodes.
- Kubernetes Namespace – Workloads: Explore the resource utilization distribution across workloads in your namespace.
- Kubernetes Namespace – Pods: Analyze resource allocation of all pods within a namespace.
- Kubernetes Persistent Volumes: Inspect the utilization and size of your persistent volume claims.
Get started
There’s no time like the present to get all your data quickly and easily on one dashboard. Check out the ready-made dashboards in the new Kubernetes platform monitoring solution in the Dynatrace Playground today.


Looking for answers?
Start a new discussion or ask for help in our Q&A forum.
Go to forum