Dynatrace NAM (formerly known as DC RUM) has successfully served the user experience monitoring needs of a broad community of Dynatrace customers for many years. So why are we announcing end of support for NAM now?
For two decades, Dynatrace NAM—Network Application Monitoring, formerly known as DC RUM—has been successfully monitoring the user experience of our customers’ enterprise applications. If you’re a NAM customer, you’ve already heard Dynatrace announce that the end of NAM support is coming. We’ve put together a comprehensive microsite that explains the technical rationale behind this decision and the migration paths to new Dynatrace offerings. But you may still be asking yourself, “Why is Dynatrace doing this if my NAM probes still work fine?” In response, I’d like to share with you my subjective NAM story. I’ve been one of a dozen NAM team members since day one. Read on to see how we at Dynatrace learn from the past so that we can improve the future.
Performance has always mattered
Ping was introduced in 1983, practically in sync with the advent of IP network standards, proving that response time measurements were important from day one of modern computer networks. As networks grew and became a critical part of business data circulation, the point of no return was reached: faster connections and more data exchange determined business competitiveness. But at the same time, connectivity costs also rose.
This led to the invention of SNMP (Simple Network Management Protocol), but SNMP understood the network as interconnected devices, without reference to the business reasons for the existence of networks and what they carried. SNMP managed the costs of network links well, but not the sources of those costs (i.e., the data flows).
Network packets never lie (if you have a chance to ask them)
Visibility into data flows had the potential to relate devices and packets to the business purpose of sending the packets back and forth. With sniffers, network performance engineers were ultimately able to relate wire data performance to what business owners expected from the networks they financed.
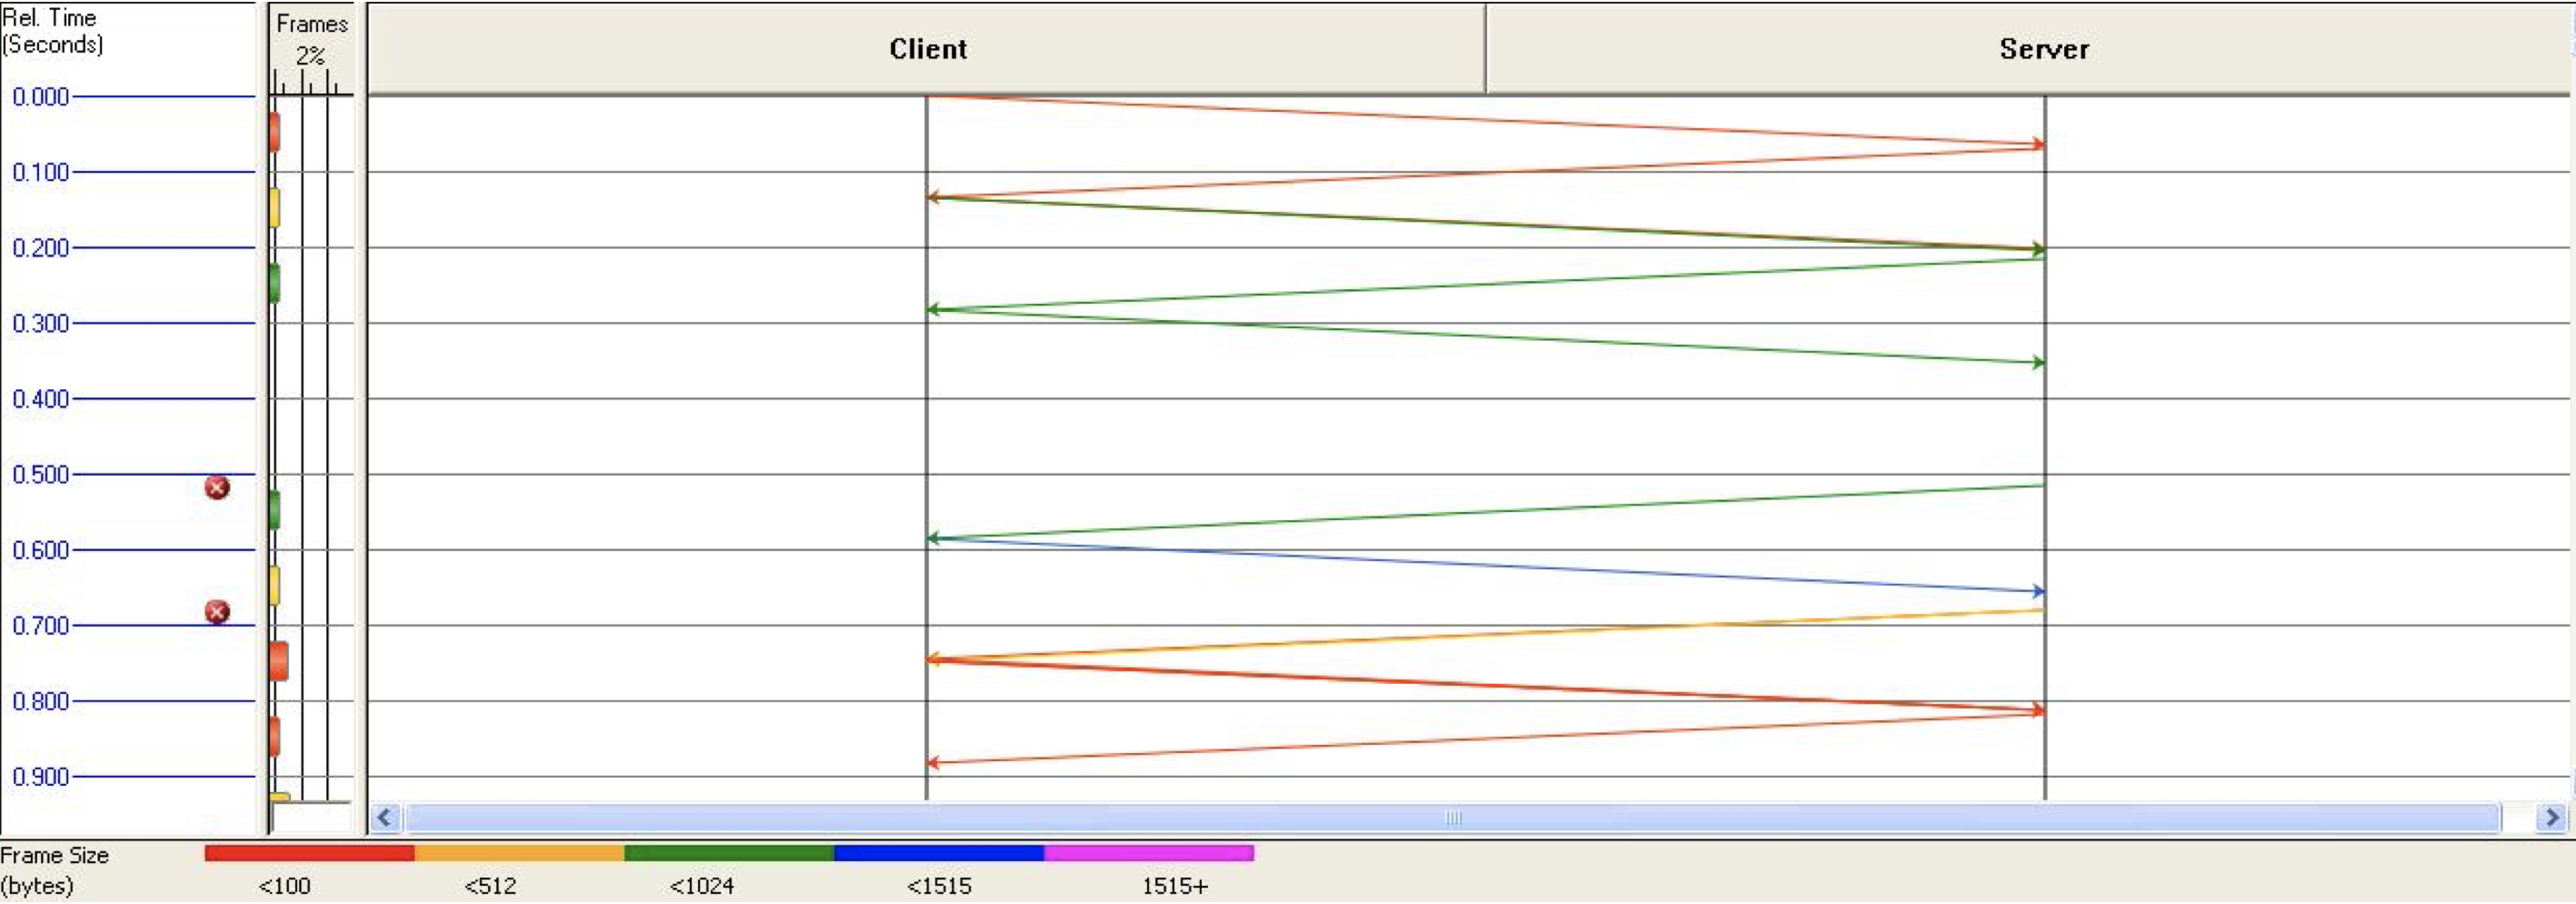
The network performance engineer who managed the sniffer was the guru. However, this approach didn’t scale as the applications and networks grew.
Introducing network probes: the new scalability challenges were solved with products like NV and AV. All-traffic monitoring, analysis on demand—network performance management started to grow as an independent engineering discipline. But end users kept complaining about slow applications, and despite increasing costs and control over networks, the baseline of end user experience wasn’t available.
As network experts, we knew that network flows precisely reflected the experience of end users. “Packets never lie,” as my NAM product management colleague Mike Hicks used to say after long analyses of convoluted customer cases. This led to the creation of the predecessor of NAM, which delivered real user experience measurements by looking at network packets. The predecessor to NAM, Adlex, was invented in 1999 out of frustration with SNMP and the limitations of sniffers. At that time, we proved that real-time end user experience monitoring could be done at scale, using passive network probes. By 2001, we won our first loyal customers. Some of these customers have experienced all the evolutions and reinventions that we’ve been through and are still loyal Dynatrace customers to this day!
The DC RUM wave
Real-time network performance analysis capabilities, including SSL decryption, enabled precise reconstruction of end user application states through the analysis of network traffic. At this point, performance monitoring teams were the gurus of both network and application delivery performance. NAM found itself at the center of a perfect storm; real-time end user experience monitoring started to be seen as a competitive advantage in many industries. This drove a lot of market growth. Centralized network packet brokers, who fed NAM and other network monitoring tools with data, were now king among performance engineering teams. Centralized network packet brokers also enabled the advent of centralized security analysis.
For nearly fifteen years (~ 2001-2015), network traffic effectively served as a common API for measuring usage, performance, and availability of all applications, links, and clients.
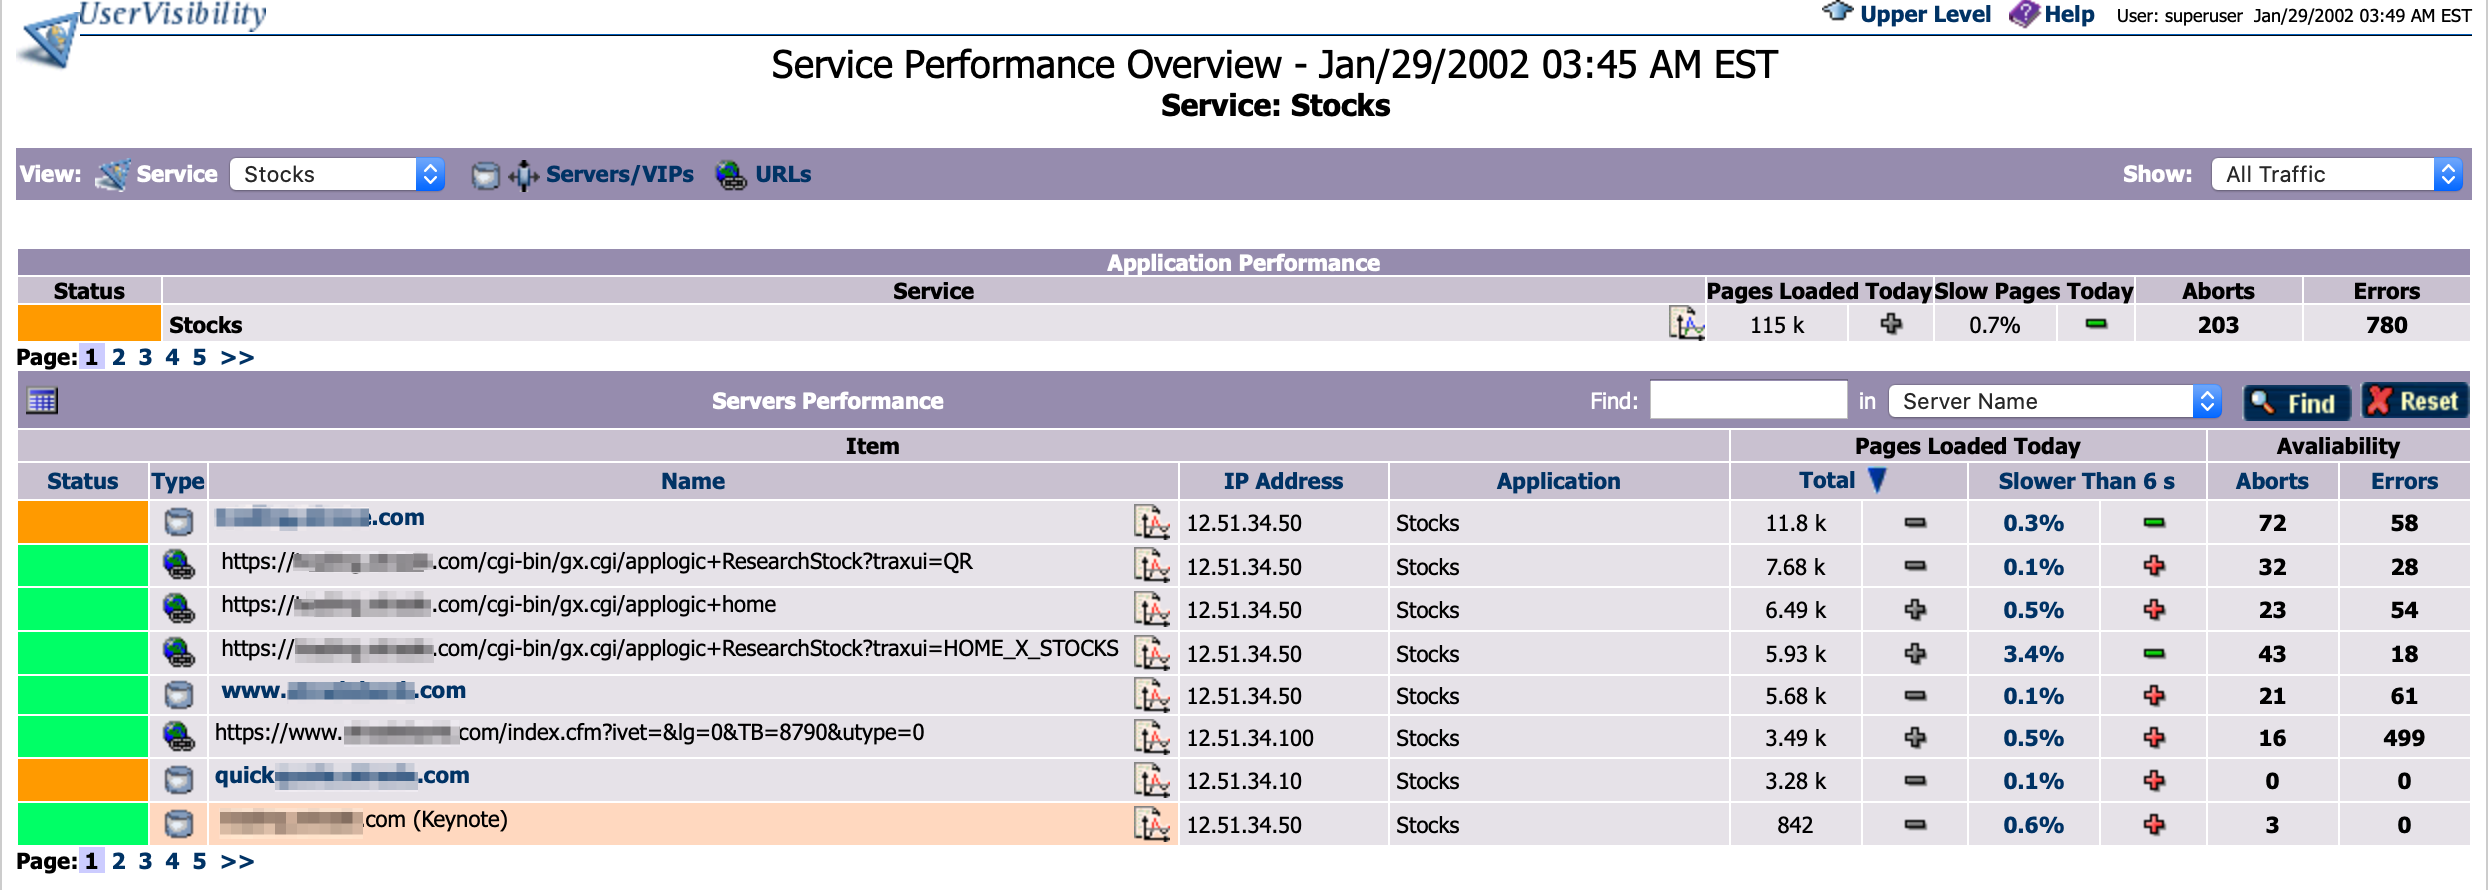
Technology developments come in waves. The network visibility wave was eventually surpassed by security concerns, to the point where, today, network packet visibility is quite limited. Widespread Perfect Forward Secrecy makes it impractical to monitor end user experience by looking at network packets (although technically possible, PFS-encrypted content visibility is impractical for customers due to security and cost concerns). In parallel, network technology developments ensured that centralized mass-sniffing was no longer feasible because of the costs. At this point, network probes no longer had the chance to “ask packets the right questions.”
The AppMon wave
Meanwhile, application performance management became mainstream. It evolved from the simplest web server plugins to runtime Java profilers to real-time performance monitoring of all transactions flowing end to end through application servers. Naturally, network probes couldn’t compete with end-to-end distributed transaction tracing. An agent-based approach with microscope-level observability of every transaction from inside the production server runtime revolutionized the way application teams managed their applications. Dynatrace AppMon established itself as the leader in application performance management with its patented PurePath technology.
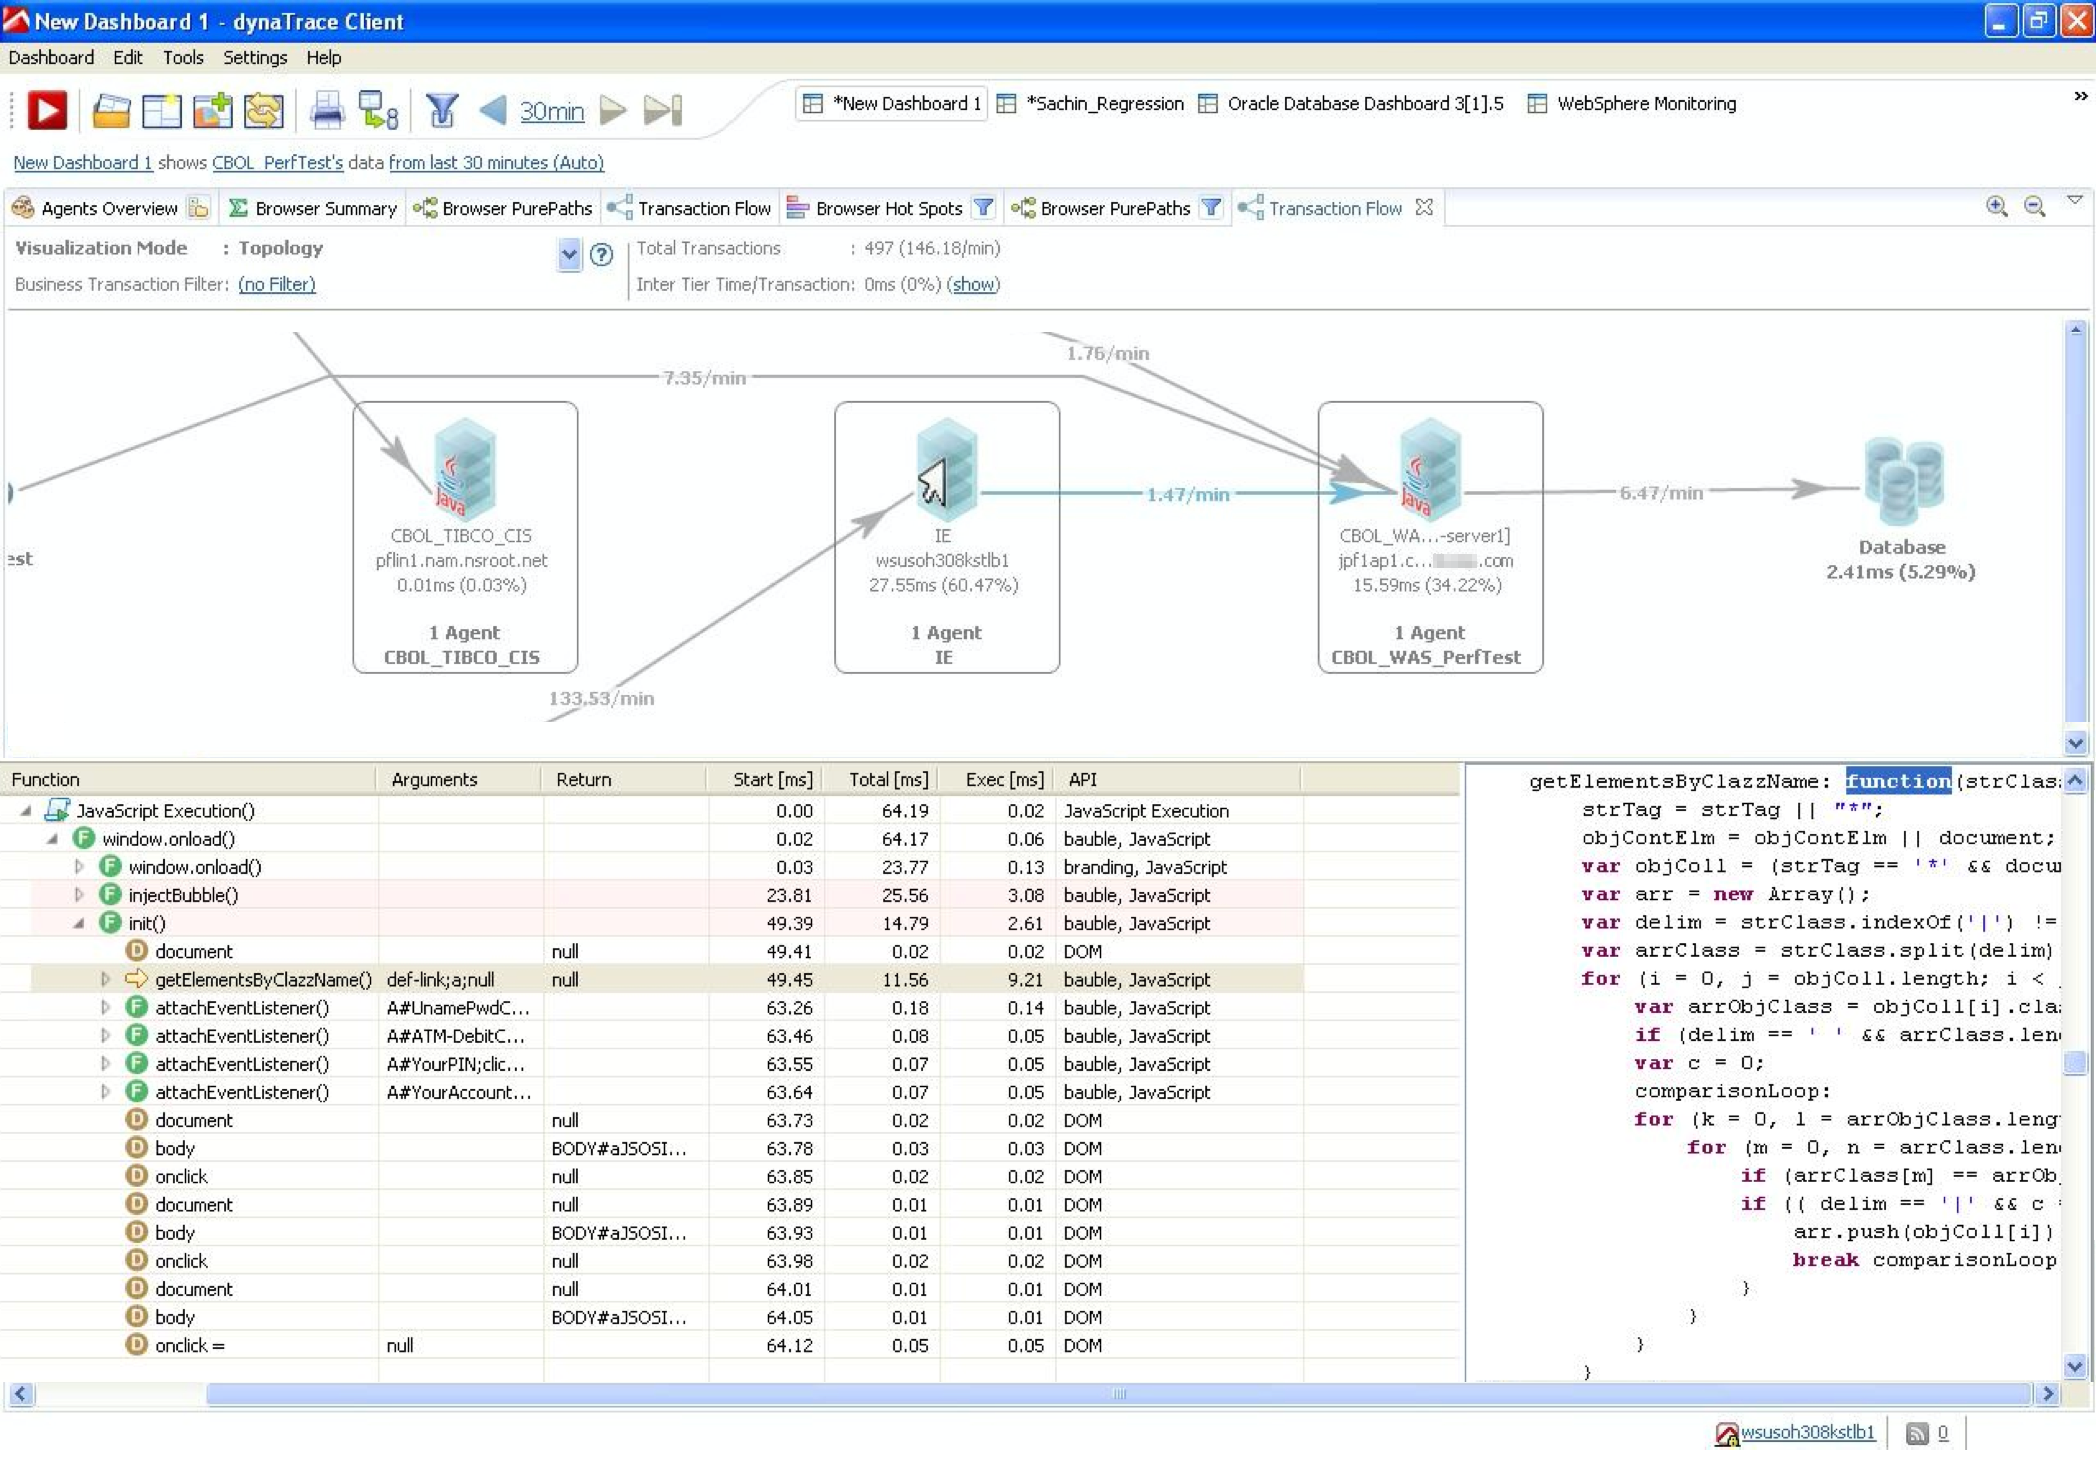
Today, the open observability concept looks like an obvious standardization that everyone should follow. Observability, as a standard, didn’t exist ten years ago. The market grew tremendously, fueled by the adoption of the Java platform as the application server standard. Dynatrace rode this wave and was one of the wave-makers itself (Dynatrace was first mentioned by Gartner in 2009). Dynatrace grew and invested into researching the next wave. Because we knew it would come…
The Software Intelligence wave
Today, we observe that a new wave of performance engineering is emerging. Dynatrace has long preached the importance of user experience and application performance, end to end and full stack.
We reinvented network-based performance monitoring from 2000-2005, which set us up as the market leader (noted by Gartner in the first APM Magic Quadrant in 2010). Since then, Dynatrace has consistently been recognized as a market leader in APM—every year, in every APM MQ.
With the Dynatrace software intelligence platform, we reinvented the APM discipline yet again when the limitations of AppMon began to be apparent. In 2012, we anticipated the shifts towards cloud infrastructures and microservices. By 2015, we knew where we needed to lead our customers to make them ready for the infrastructure and application technology advancements they were about to adopt.
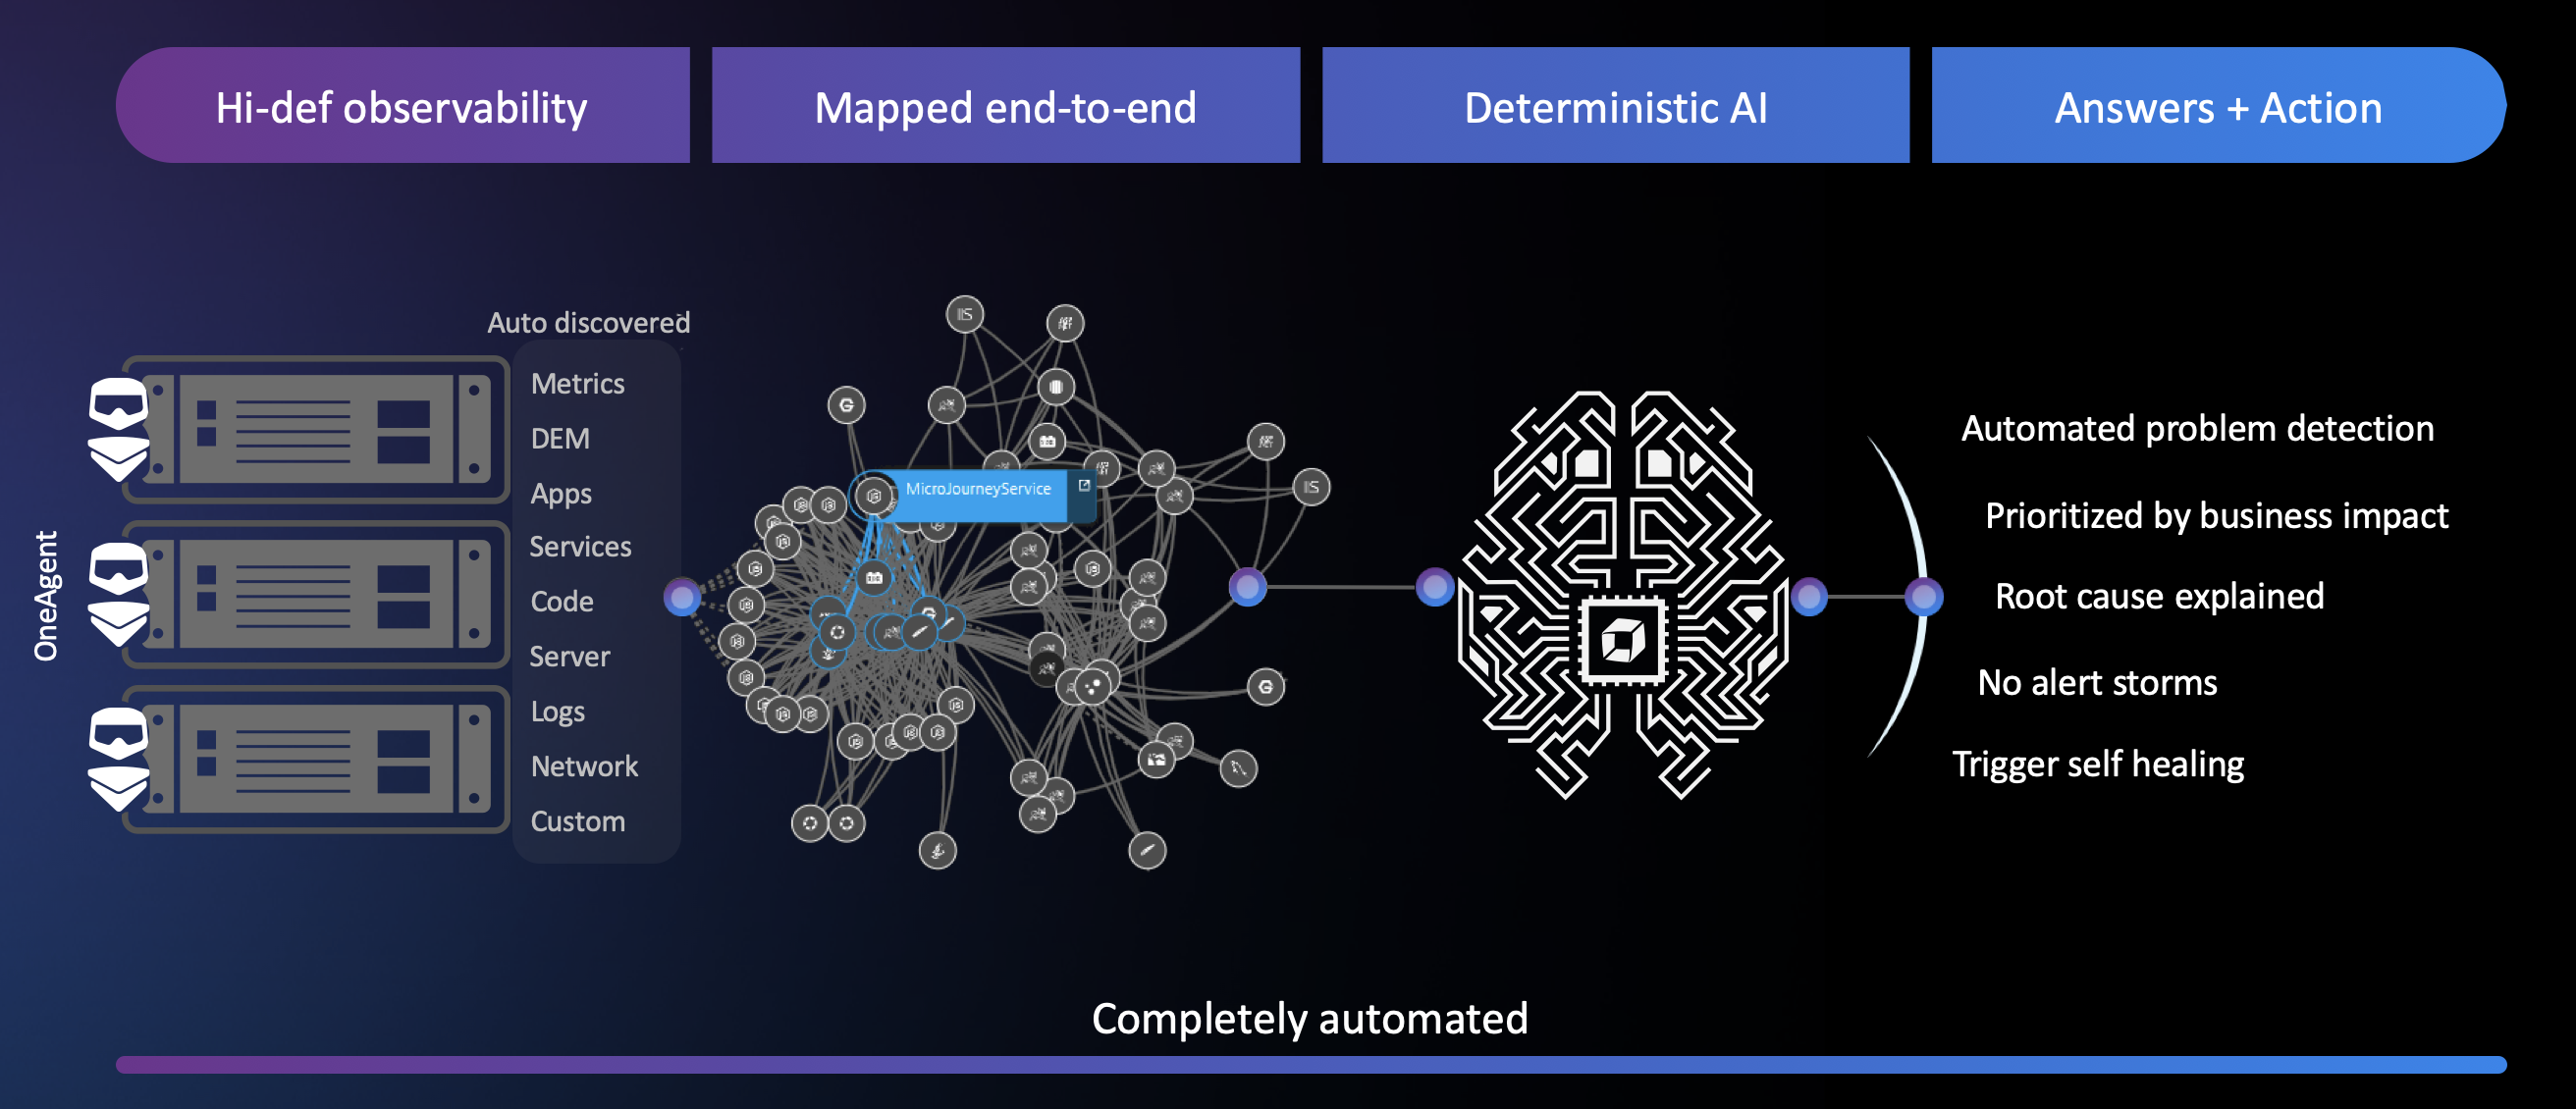
Now it looks like we’re at the cusp of another wave—open observability is starting to pick up and the concepts we invented 15 years ago (like PurePath) are finally becoming best practices. Dynatrace is actively driving these developments with our participation in the OpenTelemetry project.
Now it’s time to migrate from NAM to Dynatrace
Network packet monitoring technology may be in dire straits these days, but the use cases it supported are still valid. Therefore, the Dynatrace software intelligence platform is extensible and a foundation of modern enterprise application performance monitoring. We started with the prevalent use cases of web application monitoring—these are native to Dynatrace, but that was just the beginning. Recently, we extended Dynatrace coverage to traditional SAP applications and Citrix application delivery. In fact, the vast majority of NAM use cases have found a home in Dynatrace (see below)
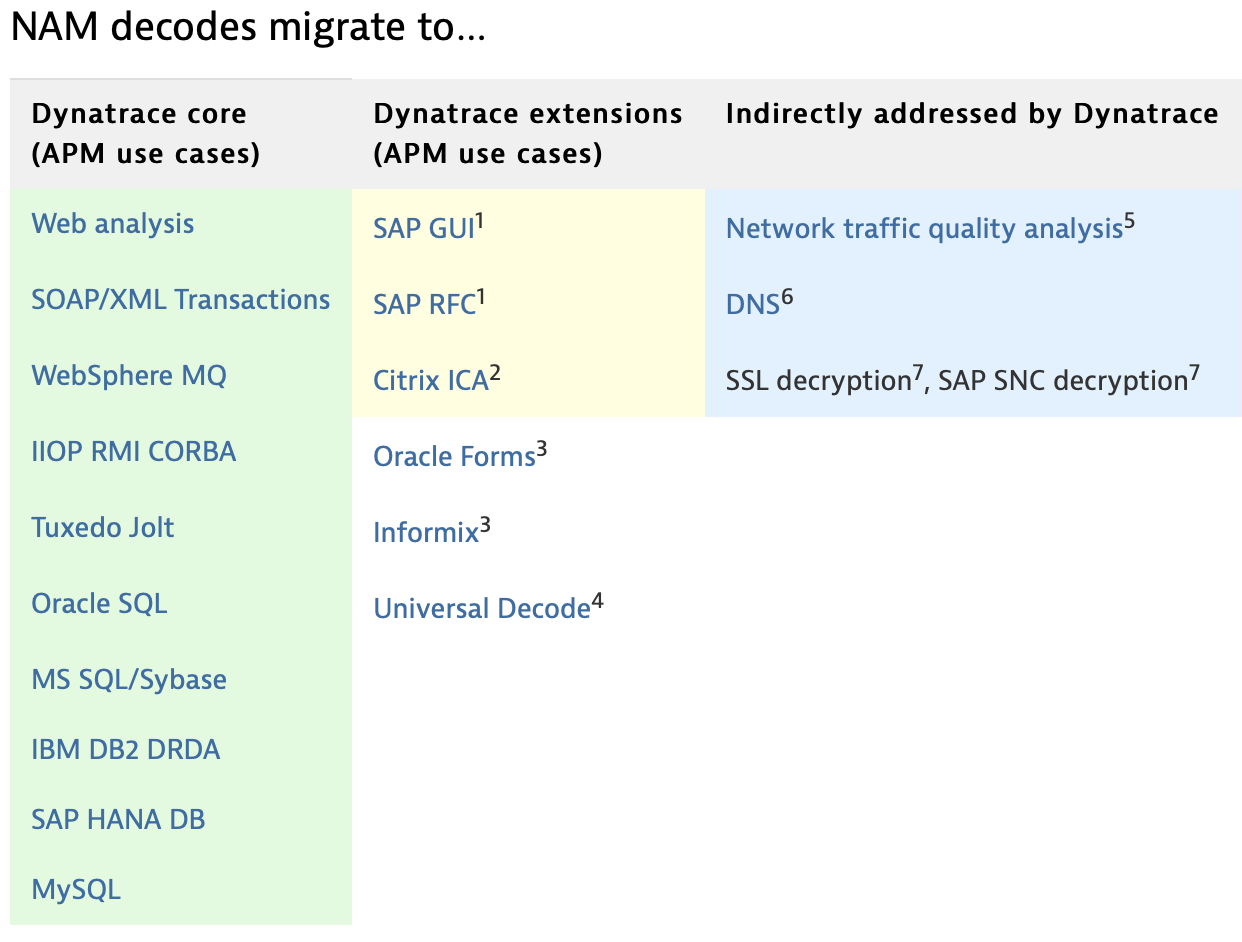
The NAM EOS microsite offers a comprehensive side-by side comparison of how the key NAM use cases can be addressed using Dynatrace. When we looked at this list, it became clear that the time to move from NAM to Dynatrace has arrived. The DC RUM name, Data Center Real User Monitoring, reflects its advantages and includes a sort of promise: no matter what application you run in your data center, Dynatrace can monitor it. We still stand by this long-term vision. This is why Dynatrace is now an extensible platform, not just a super-modern point-product. The Dynatrace platform is an insurance policy of sorts that provides future-proofing for all your digital experience monitoring.
What’s the gain?
Technology waves are inevitable. The trick is to ride them as they come and use them to build competitive advantage. Dynatrace has done this while simultaneously contributing to the well-being of the businesses we support. NAM has served us tremendously well over the years, but its wave is coming to an end. Don’t be afraid to say farewell to NAM. Instead, join Dynatrace in catching the next wave! Of course, your organization will need to be technically fit enough to catch the next wave while avoiding technical and intellectual debt.
If you haven’t tried Dynatrace yet, it’s time to start now. The Dynatrace software intelligence platform is:
- built for the future of applications and infrastructures,
- which are becoming ever-more critical to the user experiences
- upon which digital business performance depends.
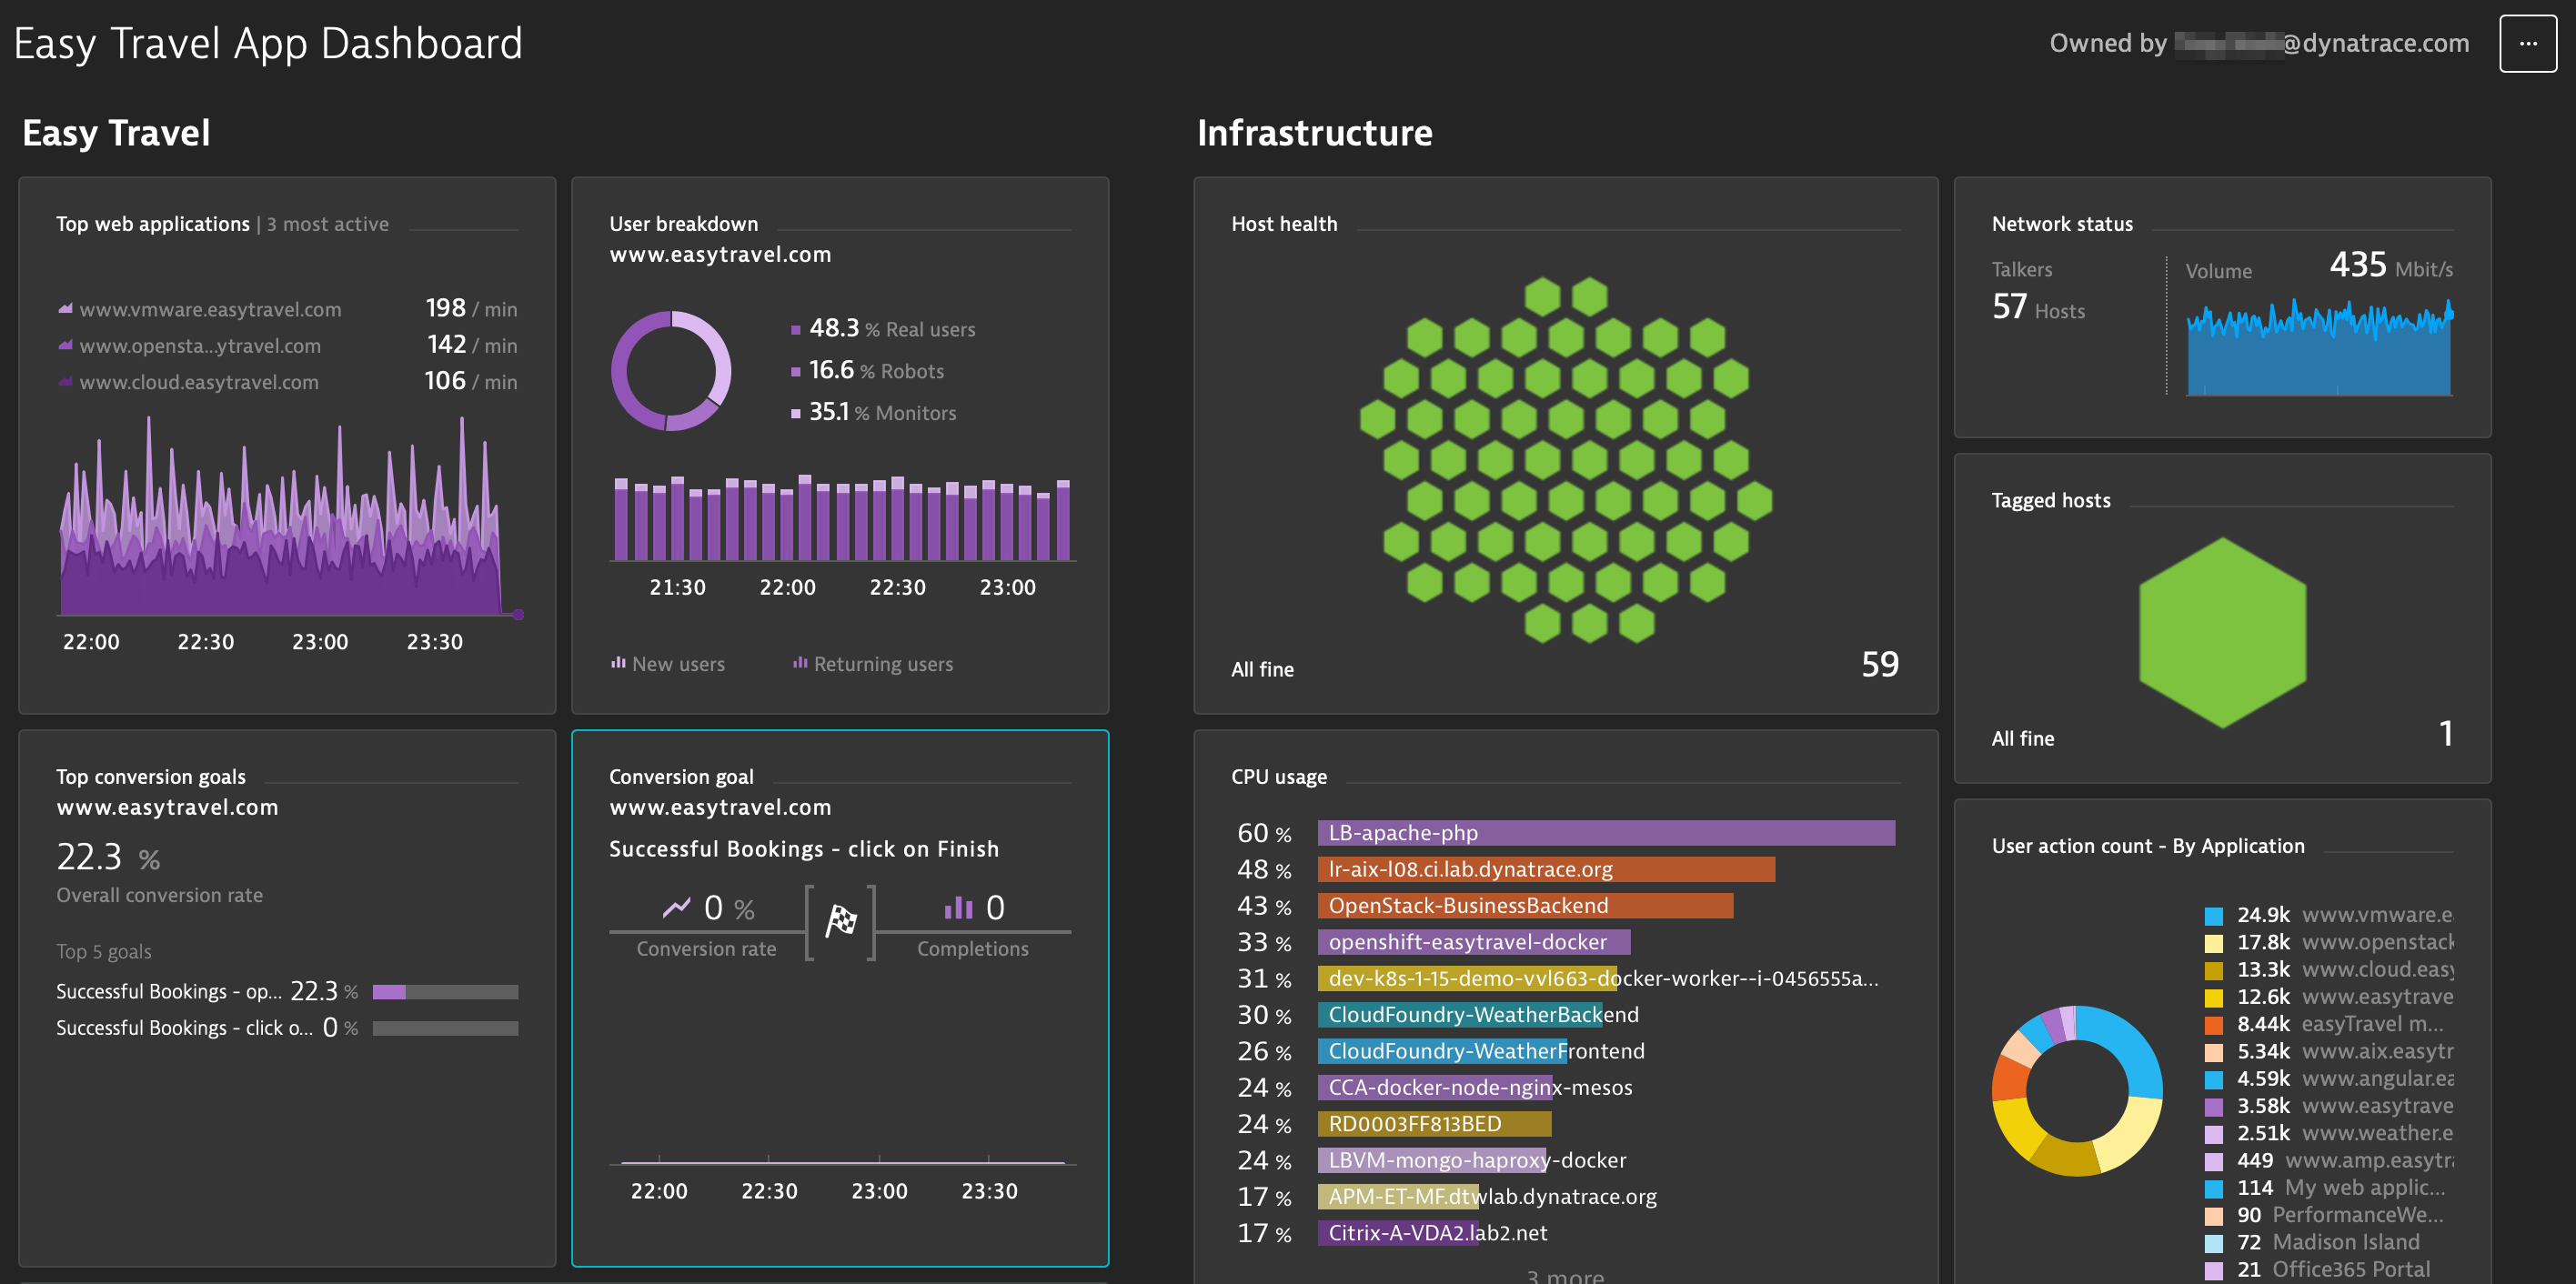
For the past 20 years, we’ve been blazing the IT performance management trail for you, and we continue to do so today. Interested in experiencing the future of IT management today? Take a look at the Dynatrace Autonomous Cloud Enablement practice to get started.


Looking for answers?
Start a new discussion or ask for help in our Q&A forum.
Go to forum