We’re happy to announce the availability of Spark monitoring! Apache Spark monitoring provides insight into the resource usage, job status, and performance of Spark Standalone clusters.
Monitoring is available for the three main Spark components:
- Cluster manager
- Driver program
- Worker nodes
Apache Spark metrics are presented alongside other infrastructure measurements, enabling in-depth cluster performance analysis of both current and historical data.
To view Spark monitoring insights
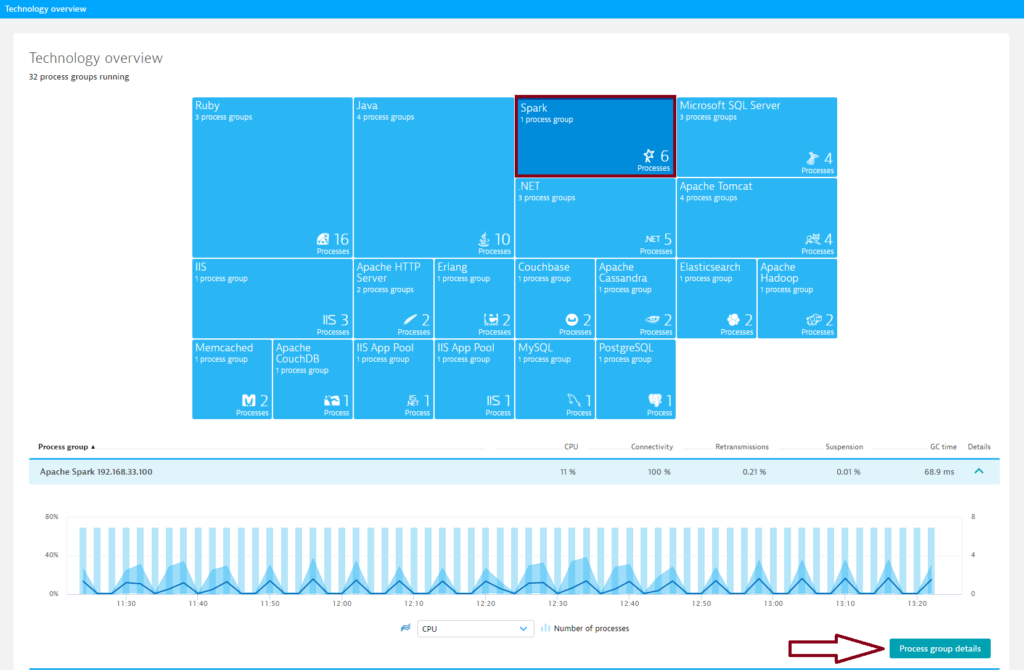
- Click Technologies in the menu.
- Click the Spark tile.
- To view cluster metrics, expand the Details section of the Spark process group.
- Click the Process group details button.
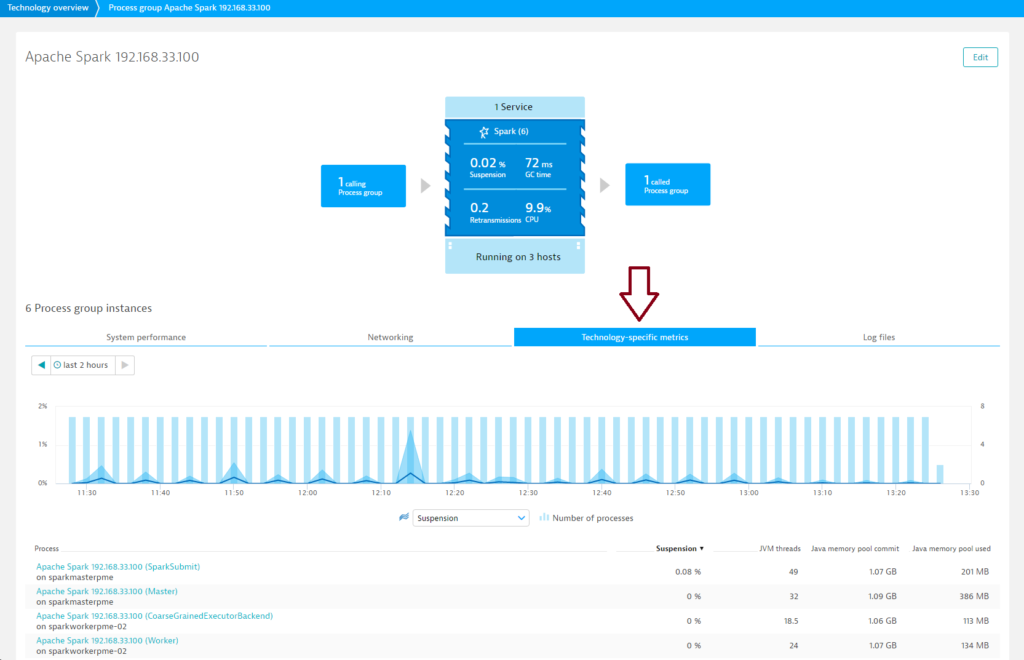
- On the Process group details page, click the Technology-specific metrics tab. Here you’ll find metrics for all Spark components.
- Further down the page, you’ll find a number of other cluster-specific charts.
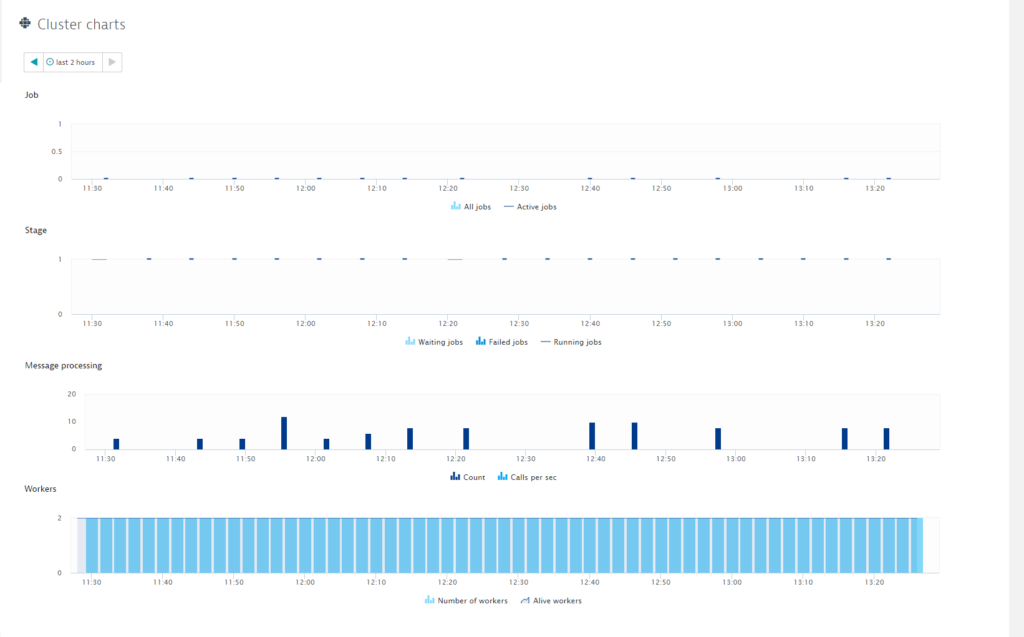 The Cluster charts section provides all the information you need regarding Jobs, Stages, Messages, Workers, and Message processing. When Jobs fail, the cause is typically a lack of cores or RAM. Note that for both cores and RAM, the maximum value is not your system’s maximum, it’s the maximum value as defined by your Spark configuration. Using the Workers chart you can immediately see when one of your nodes goes down.
Spark cluster metrics
All jobs
Number of jobs
Active jobs
Number of active jobs
Waiting jobs
Number of waiting jobs
Failed jobs
Number of failed jobs
Running jobs
Number of running jobs
Count
Number of messages in the scheduler’s event-processing loop
Calls per sec
Calls per second
Number of workers
Number of workers
Alive workers
Number of alive workers
Number of apps
Number of running applications
Waiting apps
Number of waiting applications
Spark node/worker monitoring
To access valuable Spark node metrics:
- Select a worker from the Process list on the Process group details page (see example below).
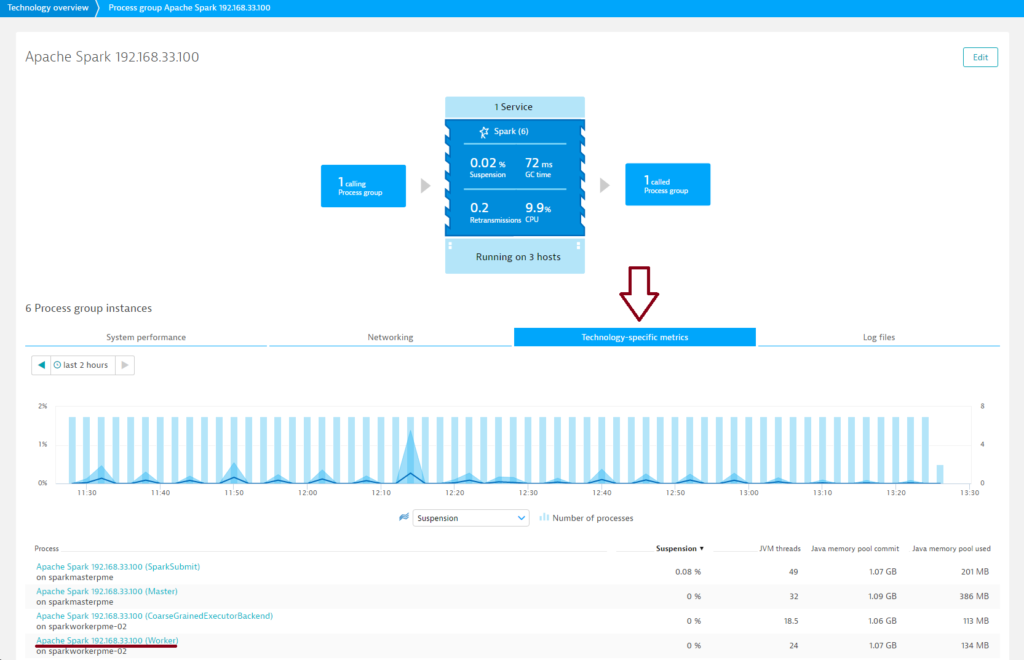
- Click the Apache Spark worker tab.
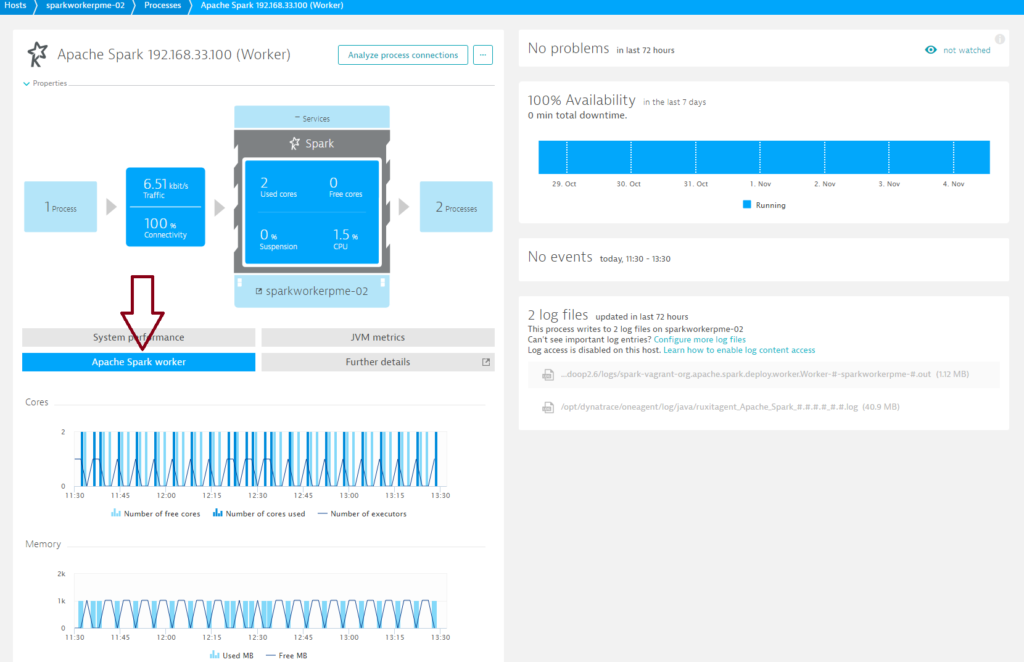
Spark Worker metrics
Number of free cores
Number of worker-free cores
Number of cores used
Number of worker cores used
Number of executors
Number of worker executors
Used MB
Amount of worker memory used (megabytes)
Free MB
Amount of worker-free memory in (megabytes)
Prerequisites
- Dynatrace OneAgent version 1.105+
- Linux OS or Windows
- Spark Standalone cluster manager
- Spark version 1.6
- Enabled JMX monitoring metrics. Turn on
JmxSinkfor all instances by class names:org.apache.spark.metrics.sink.JmxSink conf/metrics.propertiesFor more details, see Spark documentation. - To recognize your cluster,
SparkSubmitmust be executed with the–masterparameter and master host address. See example below:
spark-submit \
--class de.codecentric.SparkPi \
--master spark://192.168.33.100:7077 \
--conf spark.eventLog.enabled=true \
/vagrant/jars/spark-pi-example-1.0.jar 100
Enable Spark monitoring globally
With Spark monitoring enabled globally, Dynatrace automatically collects Spark metrics whenever a new host running Spark is detected in your environment.
- Go to Settings > Monitoring > Monitored technologies.
- Set the Spark switch to On.
Want to read more?
Visit our dedicated Apache Spark monitoring webpage to learn more about big data monitoring and how Dynatrace supports Apache Spark.
Have feedback?
Your feedback about Dynatrace Spark monitoring is most welcome! Let us know what you think of the new Spark plugin by adding a comment below. Or post your questions and feedback to Dynatrace Community.


Looking for answers?
Start a new discussion or ask for help in our Q&A forum.
Go to forum