We’re excited to announce the release of RabbitMQ monitoring! RabbitMQ server monitoring provides a high-level overview of all RabbitMQ components within your cluster.
With RabbitMQ message-related metrics, you’ll immediately know when something is wrong. And when problems occur, it’s easy to see which nodes are affected. It’s then simple to drill down into the metrics of individual nodes to find the root cause of problems and potential bottlenecks.
To view RabbitMQ monitoring insights
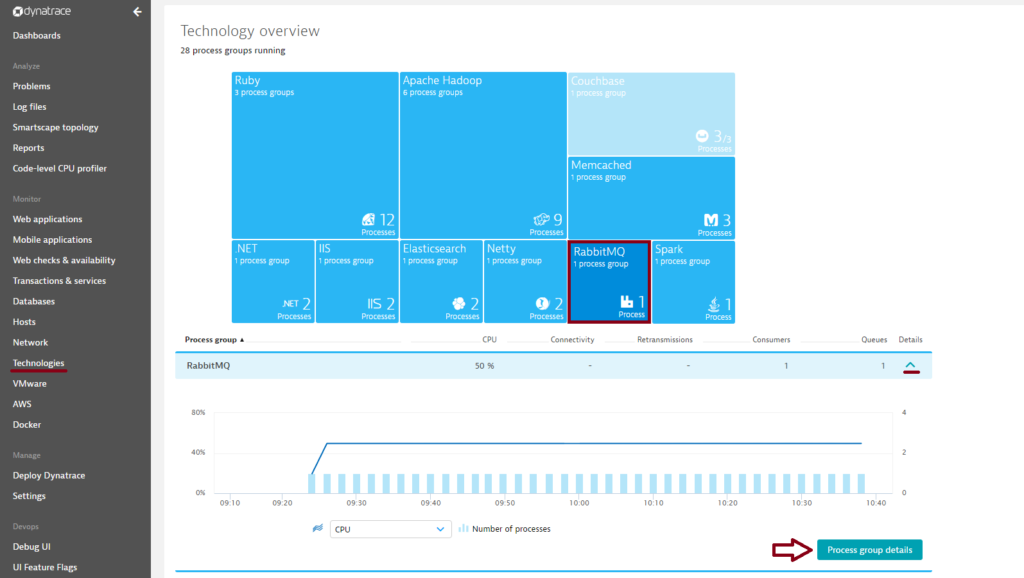
- Click Technologies in the menu.
- Click the RabbitMQ tile.
Note: Monitoring of multiple RabbitMQ clusters isn’t supported in this beta release. All nodes are presented under a single process group. - To view cluster metrics, expand the Details section of the RabbitMQ process group.
- Click the Process group details button.
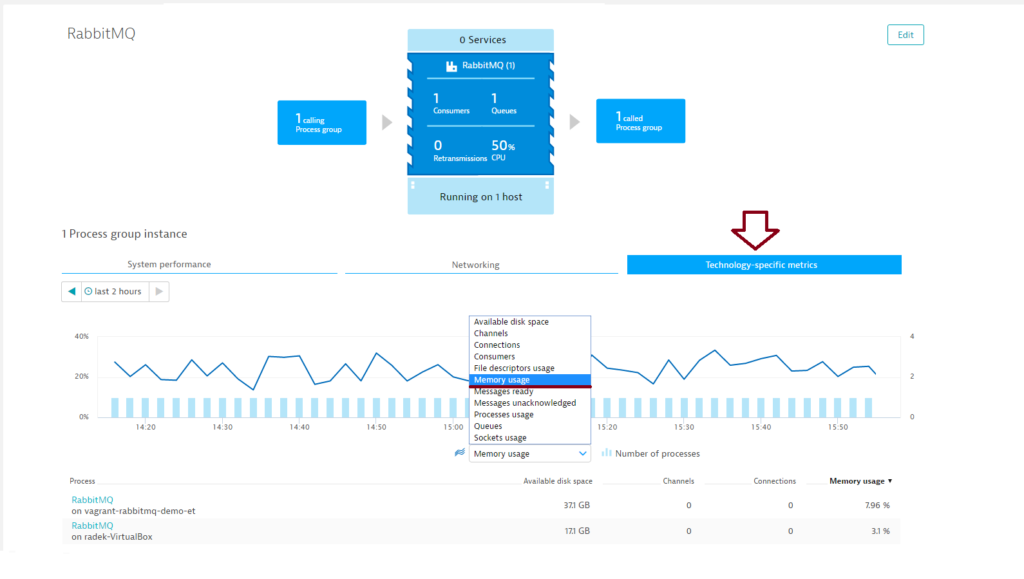
- On the Process group details page, select the Technology-specific metrics tab to view relevant cluster charts and metrics. RabbitMQ cluster overview pages (i.e., “process group” overview pages) provide an overview of RabbitMQ cluster health. From here it’s easy to identify problematic nodes. Just select a relevant time interval for the timeline, select a node metric from the metric drop list, and compare the values of all nodes in the sortable table.
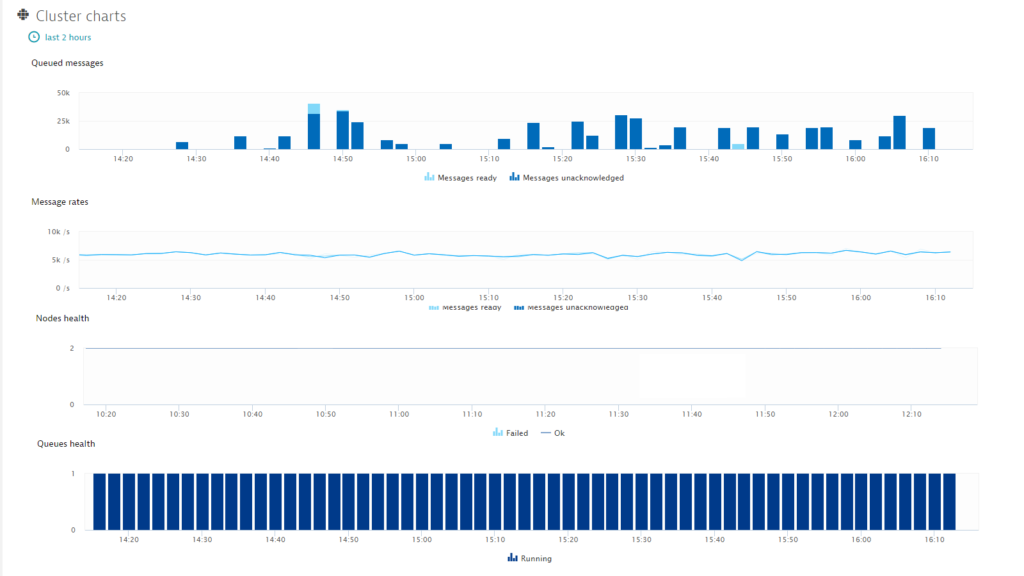
- Further down the page, you’ll find a number of other cluster-specific charts.
RabbitMQ cluster charts
Queued messages
RabbitMQ’s queues are most efficient when they’re empty, so the lower the Queued messages count, the better.
Message rates
The Message rates chart is the best indicator of RabbitMQ performance.
Nodes health
Presents number of nodes in given state. Please be aware that this chart will be available not for every RabbitMQ version.
Queues health
The Queues health chart shows more than just queue health. RabbitMQ can handle a high volume of queues, but each queue requires additional resources, so watch these queue numbers carefully. If the queues begin to pile up, you may have a queue leak. If you can’t find the leakage, consider adding a queue-ttl policy.
Cluster summary
The Cluster summary chart provides an overview of all RabbitMQ cluster elements.
For more RabbitMQ performance tips, have a look at this article about avoiding high CPU and memory usage.
RabbitMQ cluster monitoring metrics
Messages ready
The number of messages that are ready to be delivered. This is the sum of messages in the messages_ready status.
Messages unacknowledged
The number of messages delivered to clients, but not yet acknowledged. This is the sum of messages in the messages_unacknowledged status.
Acknowledged
The rate at which messages are acknowledged by the client/consumer.
Deliver and Get
The rate per second of the sum of messages: (1) delivered in acknowledgment mode to consumers, (2) delivered in n0-acknowledgment mode to consumers, (3) delivered in acknowledgment mode in response to basic.get, (4) delivered in n0-acknowledgment mode in response to basic.get.
Publish
The rate at which messages are incoming to the RabbitMQ cluster.
Failed
The number of unhealthy nodes. Please be aware that not every RabbitMQ version provides this metric.
Ok
The number of healthy nodes. Please be aware that note every RabbitMQ version provides this metric.
Queues health chart
The number of queues in a given state.
Channels
The number of channels (virtual connections). If the number of channels is high, you may have a memory leak in your client code.
Connections
The number of TCP connections to the message broker. Frequently opened and closed connections can result in high CPU usage. Connections should be long-lived. Channels can be opened and closed more frequently.
Consumers
The number of consumers
Exchanges
The number of exchanges
RabbitMQ node monitoring
To access valuable RabbitMQ node metrics
- Select Hosts from the menu.
- On the Hosts page, select your RabbitMQ host.
- In the Processes section of the Hosts page, select the RabbitMQ process.
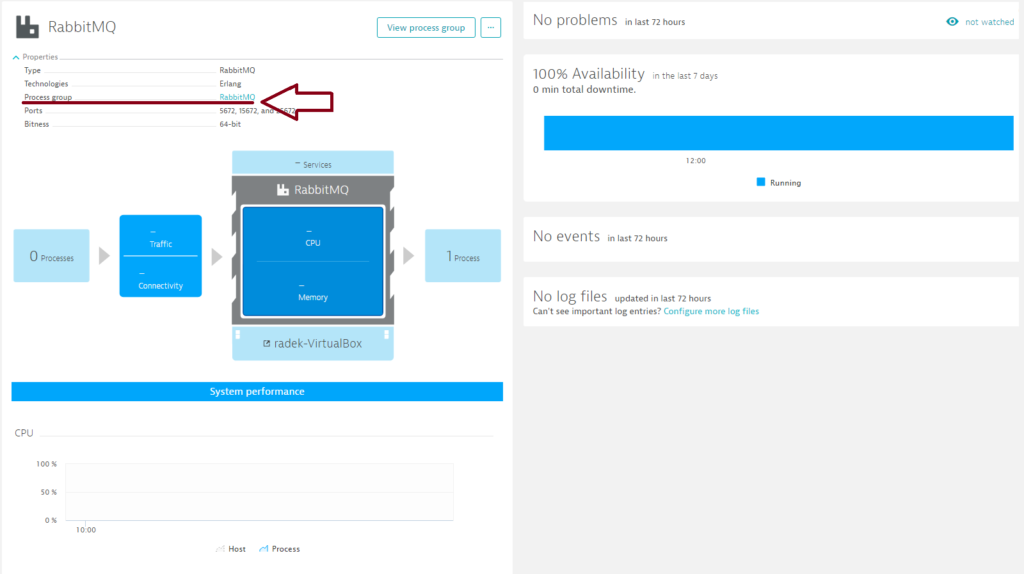
- Expand the Properties pane and select the RabbitMQ process group link.
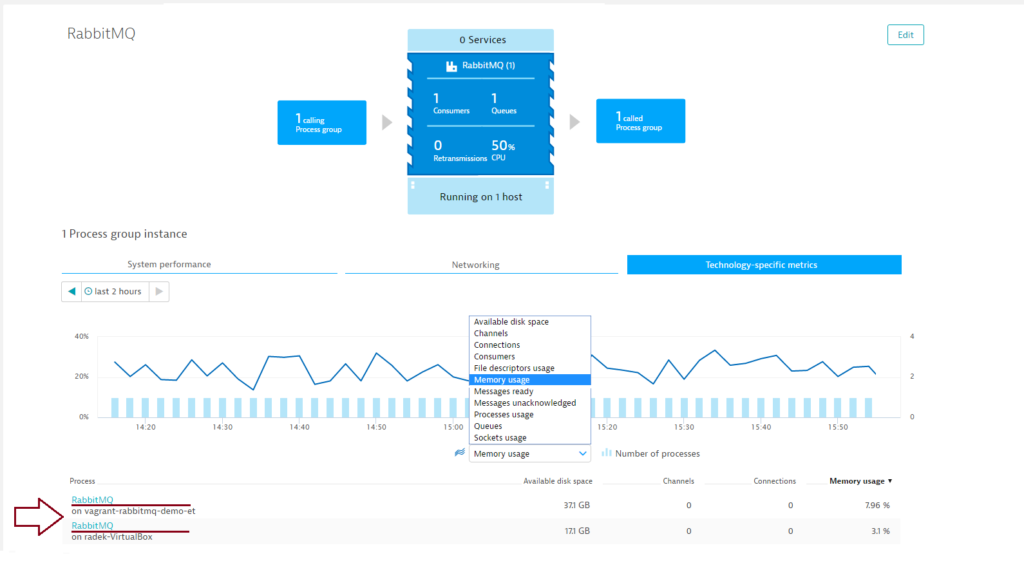
- Select a node from the Process list on the Process group details page (see below).
- Click the RabbitMQ metrics tab.
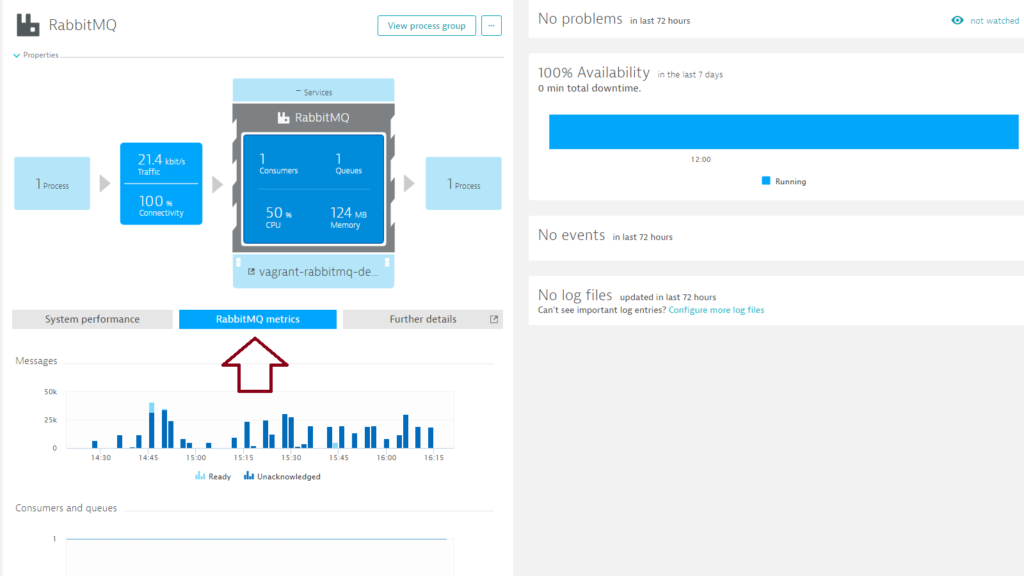 Valuable RabbitMQ node metrics are displayed on each RabbitMQ process page on the RabbitMQ metrics tab. The Messages chart indicates how many messages are queued (the fewer the better). The next two charts present the number of RabbitMQ elements that work on the current node. On the process/node page, all metrics are per node. The following metrics are available: Messages ready, Messages unacknowledged, number of Consumers, Queues, Channels, and Connections (See above for descriptions of these metrics).
 - To return to the cluster level, expand the Properties section of the RabbitMQ Processes page and select the cluster.
Additional RabbitMQ node monitoring metrics
More RabbitMQ monitoring metrics are available from individual Process pages. Select the Further details tab for more monitoring insights.

On the Further details tab you’ll find five additional charts.
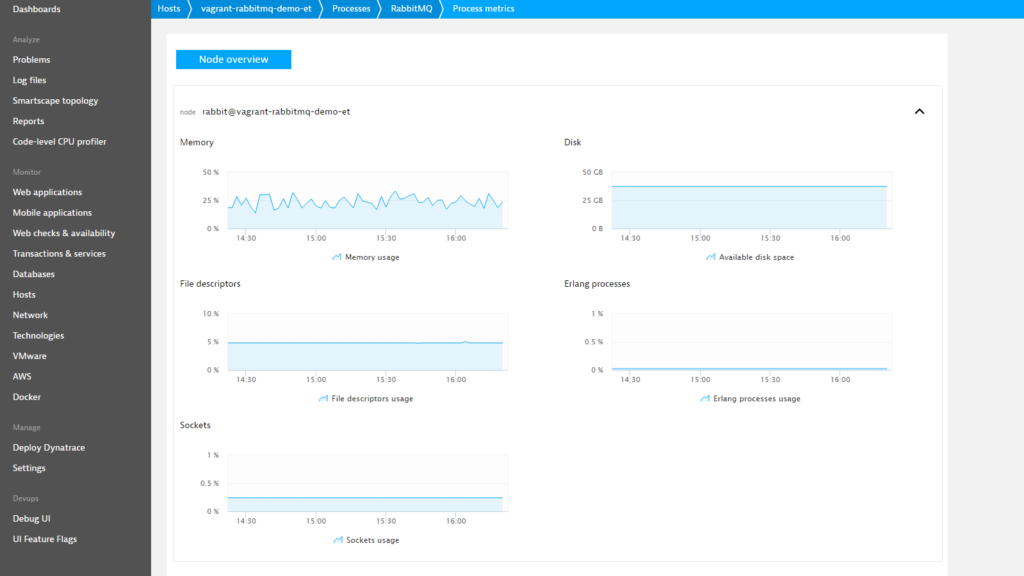
Memory usage
The percentage of available RabbitMQ memory. 100% means that the RabbitMQ memory limit vm_memory_high_watermark has been reached. (by default, vm_memory_high_watermark is set to 40% of installed RAM). Once the RabbitMQ server has used up all available memory, all new connections are blocked. Note that this doesn’t prevent the RabbitMQ server from using more than its limit—this is merely the point at which publishers are throttled.
Available disk space
The percentage of available RabbitMQ disk space. Indicates how much available disk space remains before the disk_free_limit is reached. Once all available disk space is used up, RabbitMQ blocks producers and prevents memory-based messages from being paged to disk. This reduces, but doesn’t eliminate, the likelihood of a crash due to the exhaustion of disk space.
File descriptors usage
The percentage of available file descriptors. RabbitMQ installations running production workloads may require system limits and kernel-parameter tuning to handle a realistic number of concurrent connections and queues. RabbitMQ recommends allowing for at least 65,536 file descriptors when using RabbitMQ in production environments. 4,096 file descriptors is sufficient for most development workloads. RabbitMQ documentation suggests that you set your file descriptor limit to 1.5 times the maximum number of connections you expect.
Erlang processes usage
The percentage of available Erlang processes. The maximum number of processes can be changed via the RABBITMQ_SERVER_ERL_ARGS environment variable.
Sockets usage
The percentage of available Erlang sockets. The required number of sockets is correlated with the required number of file descriptors. For more details, see the” Controlling System Limits on Linux” section at www.rabbitmq.com.
Prerequisites
- The Rabbitmq-management plugin must be installed and enabled on all nodes you want to monitor.
- A RabbitMQ management plugin user with monitoring privileges and access to all virtual hosts that you want to monitor.
- Linux OS or Windows
- RabbitMQ version 3.4.0 +
- A single RabbitMQ cluster
- Statistics available on the
localhostinterface via HTTP - Dynatrace OneAgent version 100+. OneAgent must be installed on a node that has a statistics database.
- It’s recommended that you install OneAgent on all RabbitMQ nodes.
Enable RabbitMQ monitoring globally
With RabbitMQ monitoring enabled globally, Dynatrace automatically collects RabbitMQ metrics whenever a new host running RabbitMQ is detected in your environment.
All RabbitMQ instances must have the same username and password.
- Go to Settings > Monitoring > Monitored technologies.
- Set the RabbitMQ switch to On.
- Click the ^ button to expand the details of the RabbitMQ integration.
- Define a User.
- Define a Password and Port (the default port is
15672). - Click Save.
Enable RabbitMQ monitoring for individual hosts
Dynatrace provides the option of enabling RabbitMQ monitoring for specific hosts rather than globally.
- If global RabbitMQ monitoring is currently enabled, disable it by going to Settings > Monitoring > Monitored technologies and setting the RabbitMQ switch to Off.
- Select Hosts in the navigation menu.
- Select the host you want to configure.
- Click Edit.
- Set the RabbitMQ switch to On.
Have feedback?
Your feedback about Dynatrace RabbitMQ monitoring is most welcome! Let us know what you think of the new RabbitMQ plugin by adding a comment below. Or post your questions and feedback to Dynatrace Community.


Looking for answers?
Start a new discussion or ask for help in our Q&A forum.
Go to forum