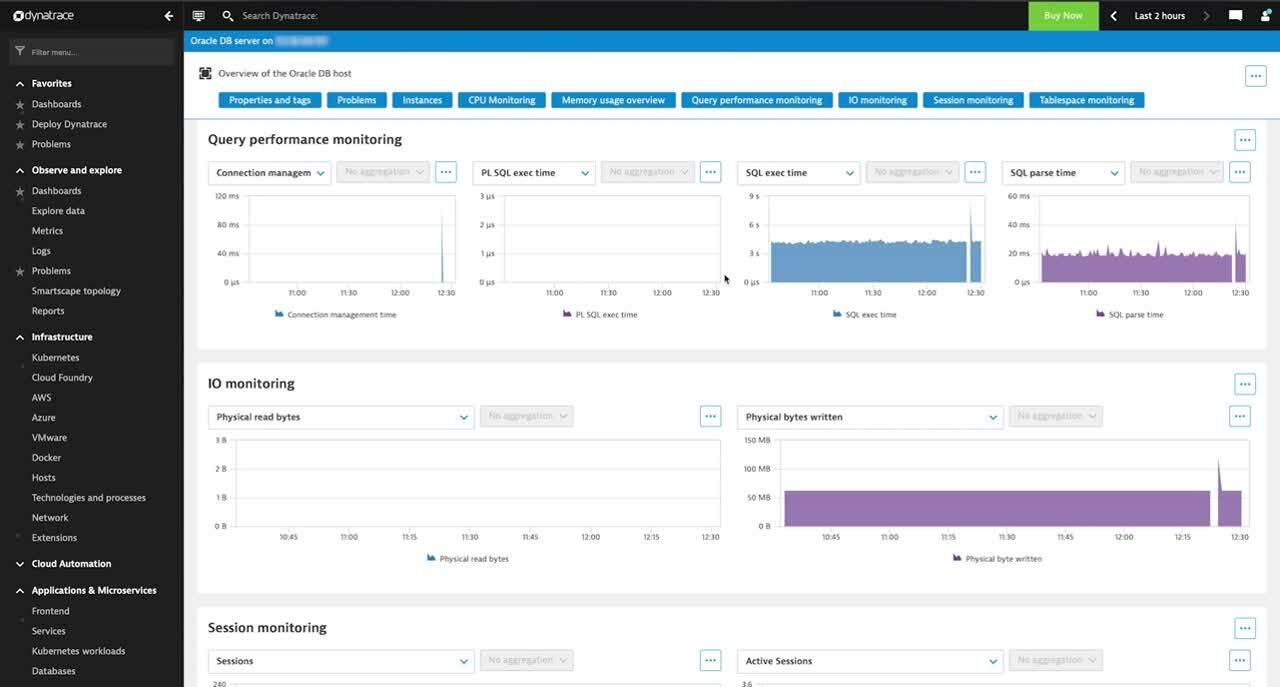
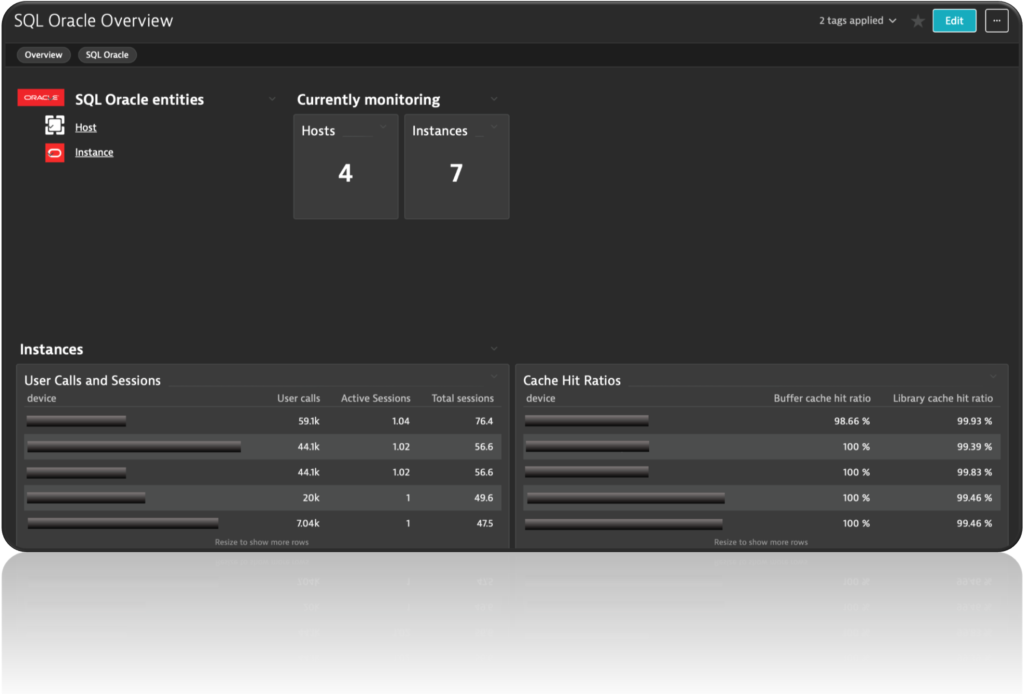
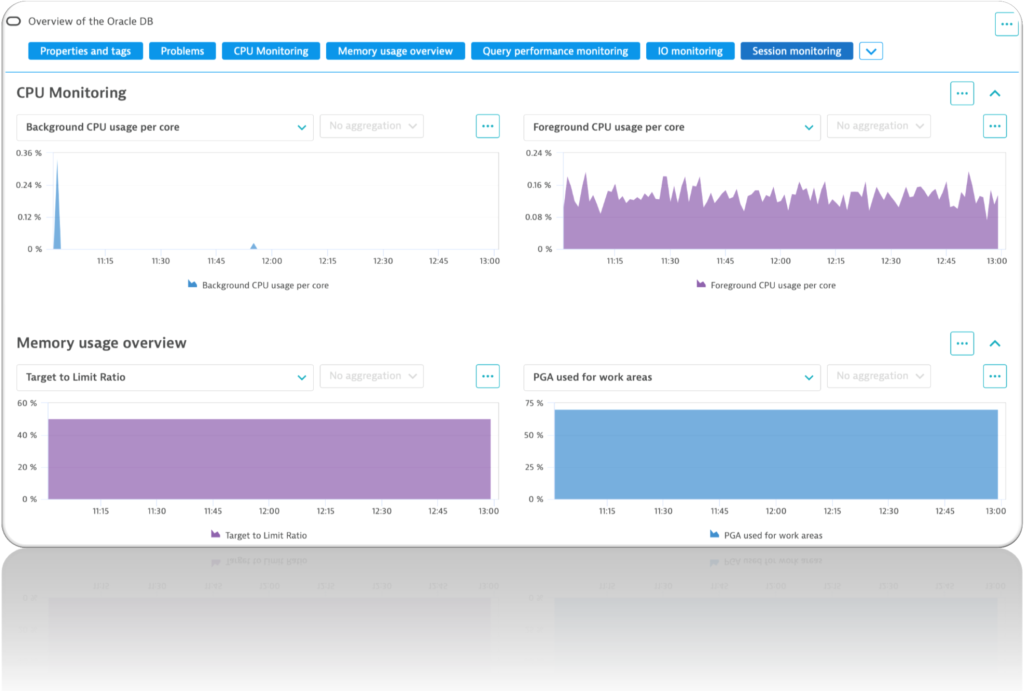
With the launch of new AI-powered database extensions, Dynatrace extends its advanced AIOps capabilities and provides even more insights into Oracle and Microsoft SQL Server. With just a few clicks, DevOps and SRE teams get precise, real-time answers about the impact of databases on the performance of apps, user experience, and business outcomes.
While applications are built using a variety of technologies and frameworks, there is one thing they usually have in common: the data they work with must be stored in databases. Dynatrace Application Performance Management (APM) has long provided multiple options for database monitoring, including deep insights into code and statements, service level visibility, connection pool monitoring, and more. Now, Dynatrace has gone a step further and expanded its coverage and intelligent observability into the next layer: database infrastructure.

Managing enterprise databases with intelligent observability
Large enterprises typically have hundreds of different types of databases in use at any given time. With a growing number of cloud-native applications built on containers and microservices-based architectures, the number and variety of databases have become complex and difficult to manage at scale. Yet, most modern applications rely on proper database performance to provide users with a flawless user experience.
In enterprise environments, DevOps and SRE teams struggle to optimize and troubleshoot databases and the applications they support at scale. DevOps teams are challenged to rapidly identify the root cause of issues without support from database administrators. SRE teams, on the other hand, struggle for a comprehensive view across their environment. In addition, they must often use disjointed database-specific tools to collaborate with engineers, database administrators, or application owners.
Easily track the health and performance of database servers with AI support
To simplify database monitoring and improve cross-team collaboration, Dynatrace released new extensions to leading databases, including Oracle and Microsoft SQL Server.
By providing real-time and automatic insights into database performance metrics and business KPIs, DevOps teams have the freedom to choose the type of database needed for their applications, and SRE teams can proactively manage resource allocation.
With just a few clicks, the new Dynatrace extensions for Oracle and Microsoft SQL Server provide unique insights into the performance of your database server and identify potential anomalies.
Using Dynatrace Davis® AI, you can easily enable custom alerting that significantly reduces alert storms. With auto-adaptive baselining in response to the specific requirements of your environment, Davis® only raises alerts for important events.

Break down departmental silos and manage databases holistically
Modern database structures have become highly dynamic; however, data is still structured the same way as when a full-time database administrator was required to manage the tables, indexes, and views, and optimize queries for better performance. Modern application frameworks manage these factors semi-automatically —which does not necessarily mean they manage them in an optimal way.
Whether you’re an Ops, DevOps, or IT admin, the new Dynatrace database monitoring extensions provide all the necessary analysis capabilities to either solve problems instantly or gather sufficient insights so that a database administrator can quickly resolve the disruptions.

Enrich database performance KPIs with business analytics
Additionally, it’s easy to create your own custom extensions to collect, track, and alert on any data fetched from a database, including business analytics. This simply involves storing plain SQL queries in a custom extension configuration.
For data collected directly from a database, Davis® can proactively alert on performance degradations or other significant changes.
What’s next?
To further integrate database intelligent observability into the Dynatrace APM offering, we plan to add query-level visibility to identify the most expensive queries in terms of resource consumption. Combining such insight with application-side observability provided by Dynatrace OneAgent, it will be possible to analyze queries in detail, including query analytics used by database server query optimizers. We also plan to add logs and events to further enrich Davis AI event correlation and automated root cause analysis for metric anomalies. Additionally, we’ll release database monitoring extensions for more technologies:
- Oracle RAC and MS SQL High-Availability deployments
- MS SQL Services (via WMI)
- IBM DB2
- SAP HanaDB
- …and more!
Get started now!
The new Dynatrace database monitoring extensions are ready to use out-of-the-box. There’s no need to manually configure necessary metrics or build dashboards.
Start monitoring your Oracle and MS SQL Server databases today to improve your database intelligent observability. Also, please share your feedback with us in this Dynatrace Community feedback channel. You can also submit your own product idea- just create an RFE in our Community ideas channel


Looking for answers?
Start a new discussion or ask for help in our Q&A forum.
Go to forum