For custom metrics ingested into Dynatrace via open API interfaces like StatsD, Telegraf, and Prometheus, you can now take advantage of the full power of Davis AI topology-aware anomaly detection and alerting.
Dynatrace recently opened up the enterprise-grade functionalities of Dynatrace OneAgent to all the data needed for observability, including metrics, events, logs, traces, and topology data. Our breakthrough in augmenting open API interfaces like StatsD, Telegraf, and Prometheus now allows customers to feed third-party metrics into Dynatrace and map those metrics into our real-time Smartscape topology.
As your organization moves beyond the myriad of out-of-the-box technologies that are offered by Dynatrace and you begin to stream in third-party metrics, you need to apply the full power of the Dynatrace Davis® AI causation engine to these ingested metrics—think dependency detection, topology visualization, anomaly detection, auto-baselines, root cause analysis, or even business-impact analysis. This is exactly what Dynatrace now delivers.
Davis topology-aware anomaly detection and alerting for your custom metrics
We’re happy to announce that with the latest Dynatrace release, you can leverage the full power of Dynatrace Davis AI to detect and receive alerts on anomalies in your custom metrics. This allows you to:
- Use auto-adaptive baselines for all your custom metrics.
- Seamlessly report and be alerted on topology-related custom metrics.
- Seamlessly report and be alerted on non-topology-related custom metrics, using Dynatrace as a metric database.
- Convert non-topological custom metrics into topological metrics on the fly simply by adding semantic links to Smartscape topology.
Topology and non-topology metrics—what’s the difference?
Before diving deeper into anomaly detection for all custom metrics, let’s review the fundamentals. What’s the difference between topology and non-topology metrics in Dynatrace?
- Topology metrics are related to specific entities in your Smartscape topology (for example, the number of successful and failed batch jobs processed by a host).
- Non-topology metrics are not related to any Smartscape entity (for example, a retailer’s revenue numbers per store). Instead, the metric is related to the monitored environment as a whole.
Smartscape auto-detected topology is an important differentiator of the Dynatrace Software Intelligence Platform as compared to any other legacy monitoring solution. The Smartscape entity model plays an important role for Davis AI, as all built-in metrics are automatically linked to context-rich entities such as hosts, disks, processes, or services.
A topological link to an entity only makes sense, of course, if the measurement that’s sent to Dynatrace has a semantic relationship to that entity. This means that if a measurement is sent for a host, it must be logically linked to that specific host. The same is true for measurements that are sent for services or applications.
Choose your custom metric type
While, in the past, it was only possible to stream third-party metrics into Dynatrace through a custom device API (i.e., an entity), Dynatrace now also supports use cases for reporting, charting, and alerting on non-topological metrics.
When streaming custom metrics into your Dynatrace monitoring environment, you can now specify whether or not a metric has a topological relationship. Either way, you’re now able to seamlessly report, chart, and alert on these metrics, which fulfills a wide array of use cases across your organization that rely on time series metrics and alerting.
Now let’s take a look at anomaly detection for topology-related and non-topology-related custom metrics in action!
Seamlessly report and alert on topology-related custom metrics
Let’s assume that you have an existing OneAgent instance running on a host and you want to stream measurements for the number of successful and failed batch jobs into your Dynatrace monitoring environment.
OneAgent comes with a new metric ingest channel already enabled. You can use a simple curl command to pipe these metrics into Dynatrace. Representative incoming measurements for each are shown below:
$ curl -d "batchjobs.execution.successes,jobname=payslip 5" http://127.0.0.1:14499/metrics/ingest

$ curl -d "batchjobs.execution.fails,jobname=payslip 1" http://127.0.0.1:14499/metrics/ingest
Ingest data via OneAgent rather than our REST API
Ingesting custom metrics through the OneAgent channel comes with a two major benefits as compared to using the same channel via the REST API:
- Unlike the REST ingest channel, you don’t need an API token; OneAgent handles the secure connection for you.
- Each OneAgent instance is already aware of the topology that it’s reporting on, so information about related hosts is automatically added to your ingested metrics.
Once you begin sending the two metrics through the OneAgent channel, they will automatically appear within the metric picker (shown below).

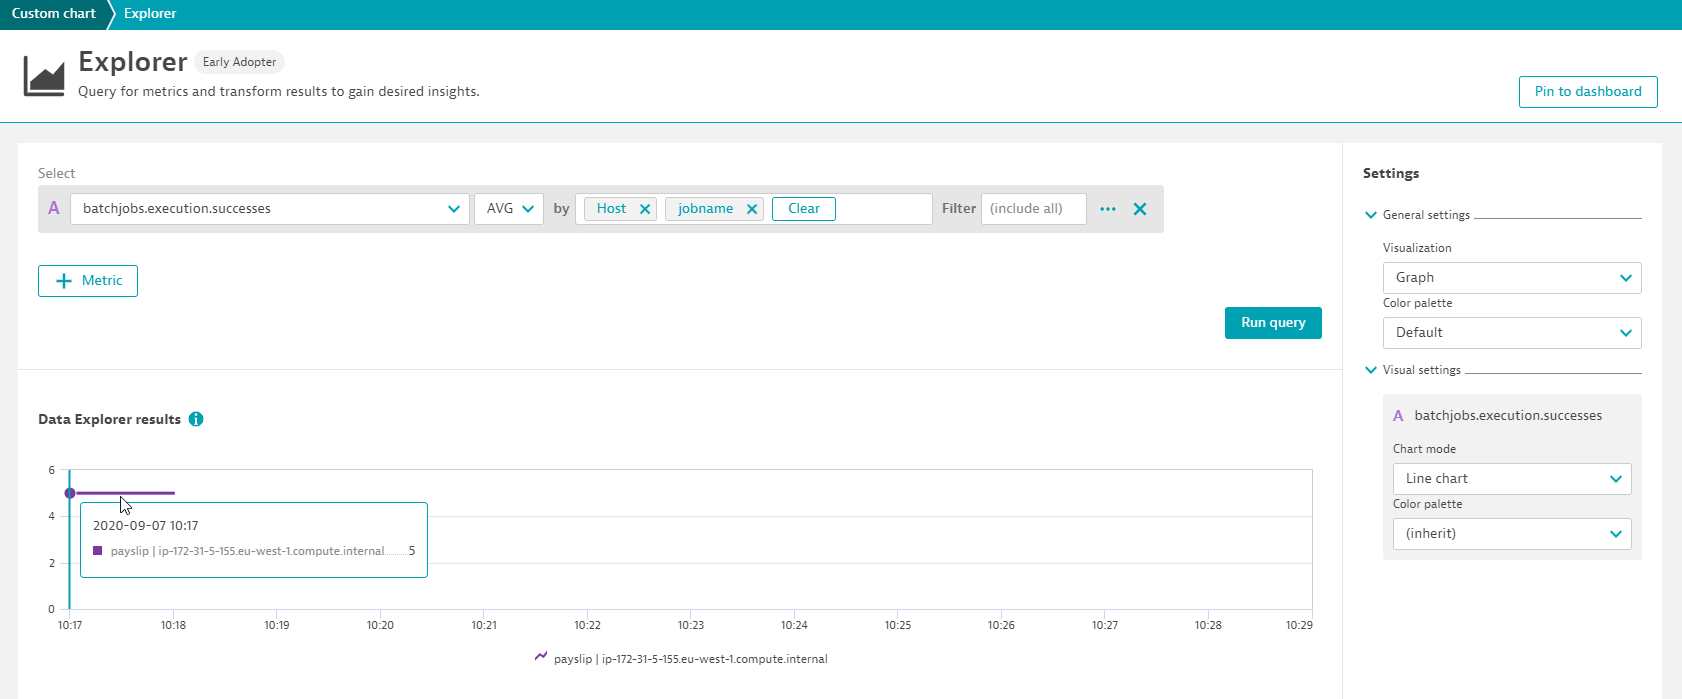
As mentioned above, each OneAgent instance adds its own topological information to each measurement sent to Dynatrace. You can see this in the image below where metrics have been split by host. This metric dimension was automatically added by OneAgent.
The job name is another dimension automatically reported by OneAgent for the two batch job metrics in this example. All metric dimensions, whether you report them or OneAgent adds them to enrich the topological information, can be transparently filtered and drilled into, as shown below.

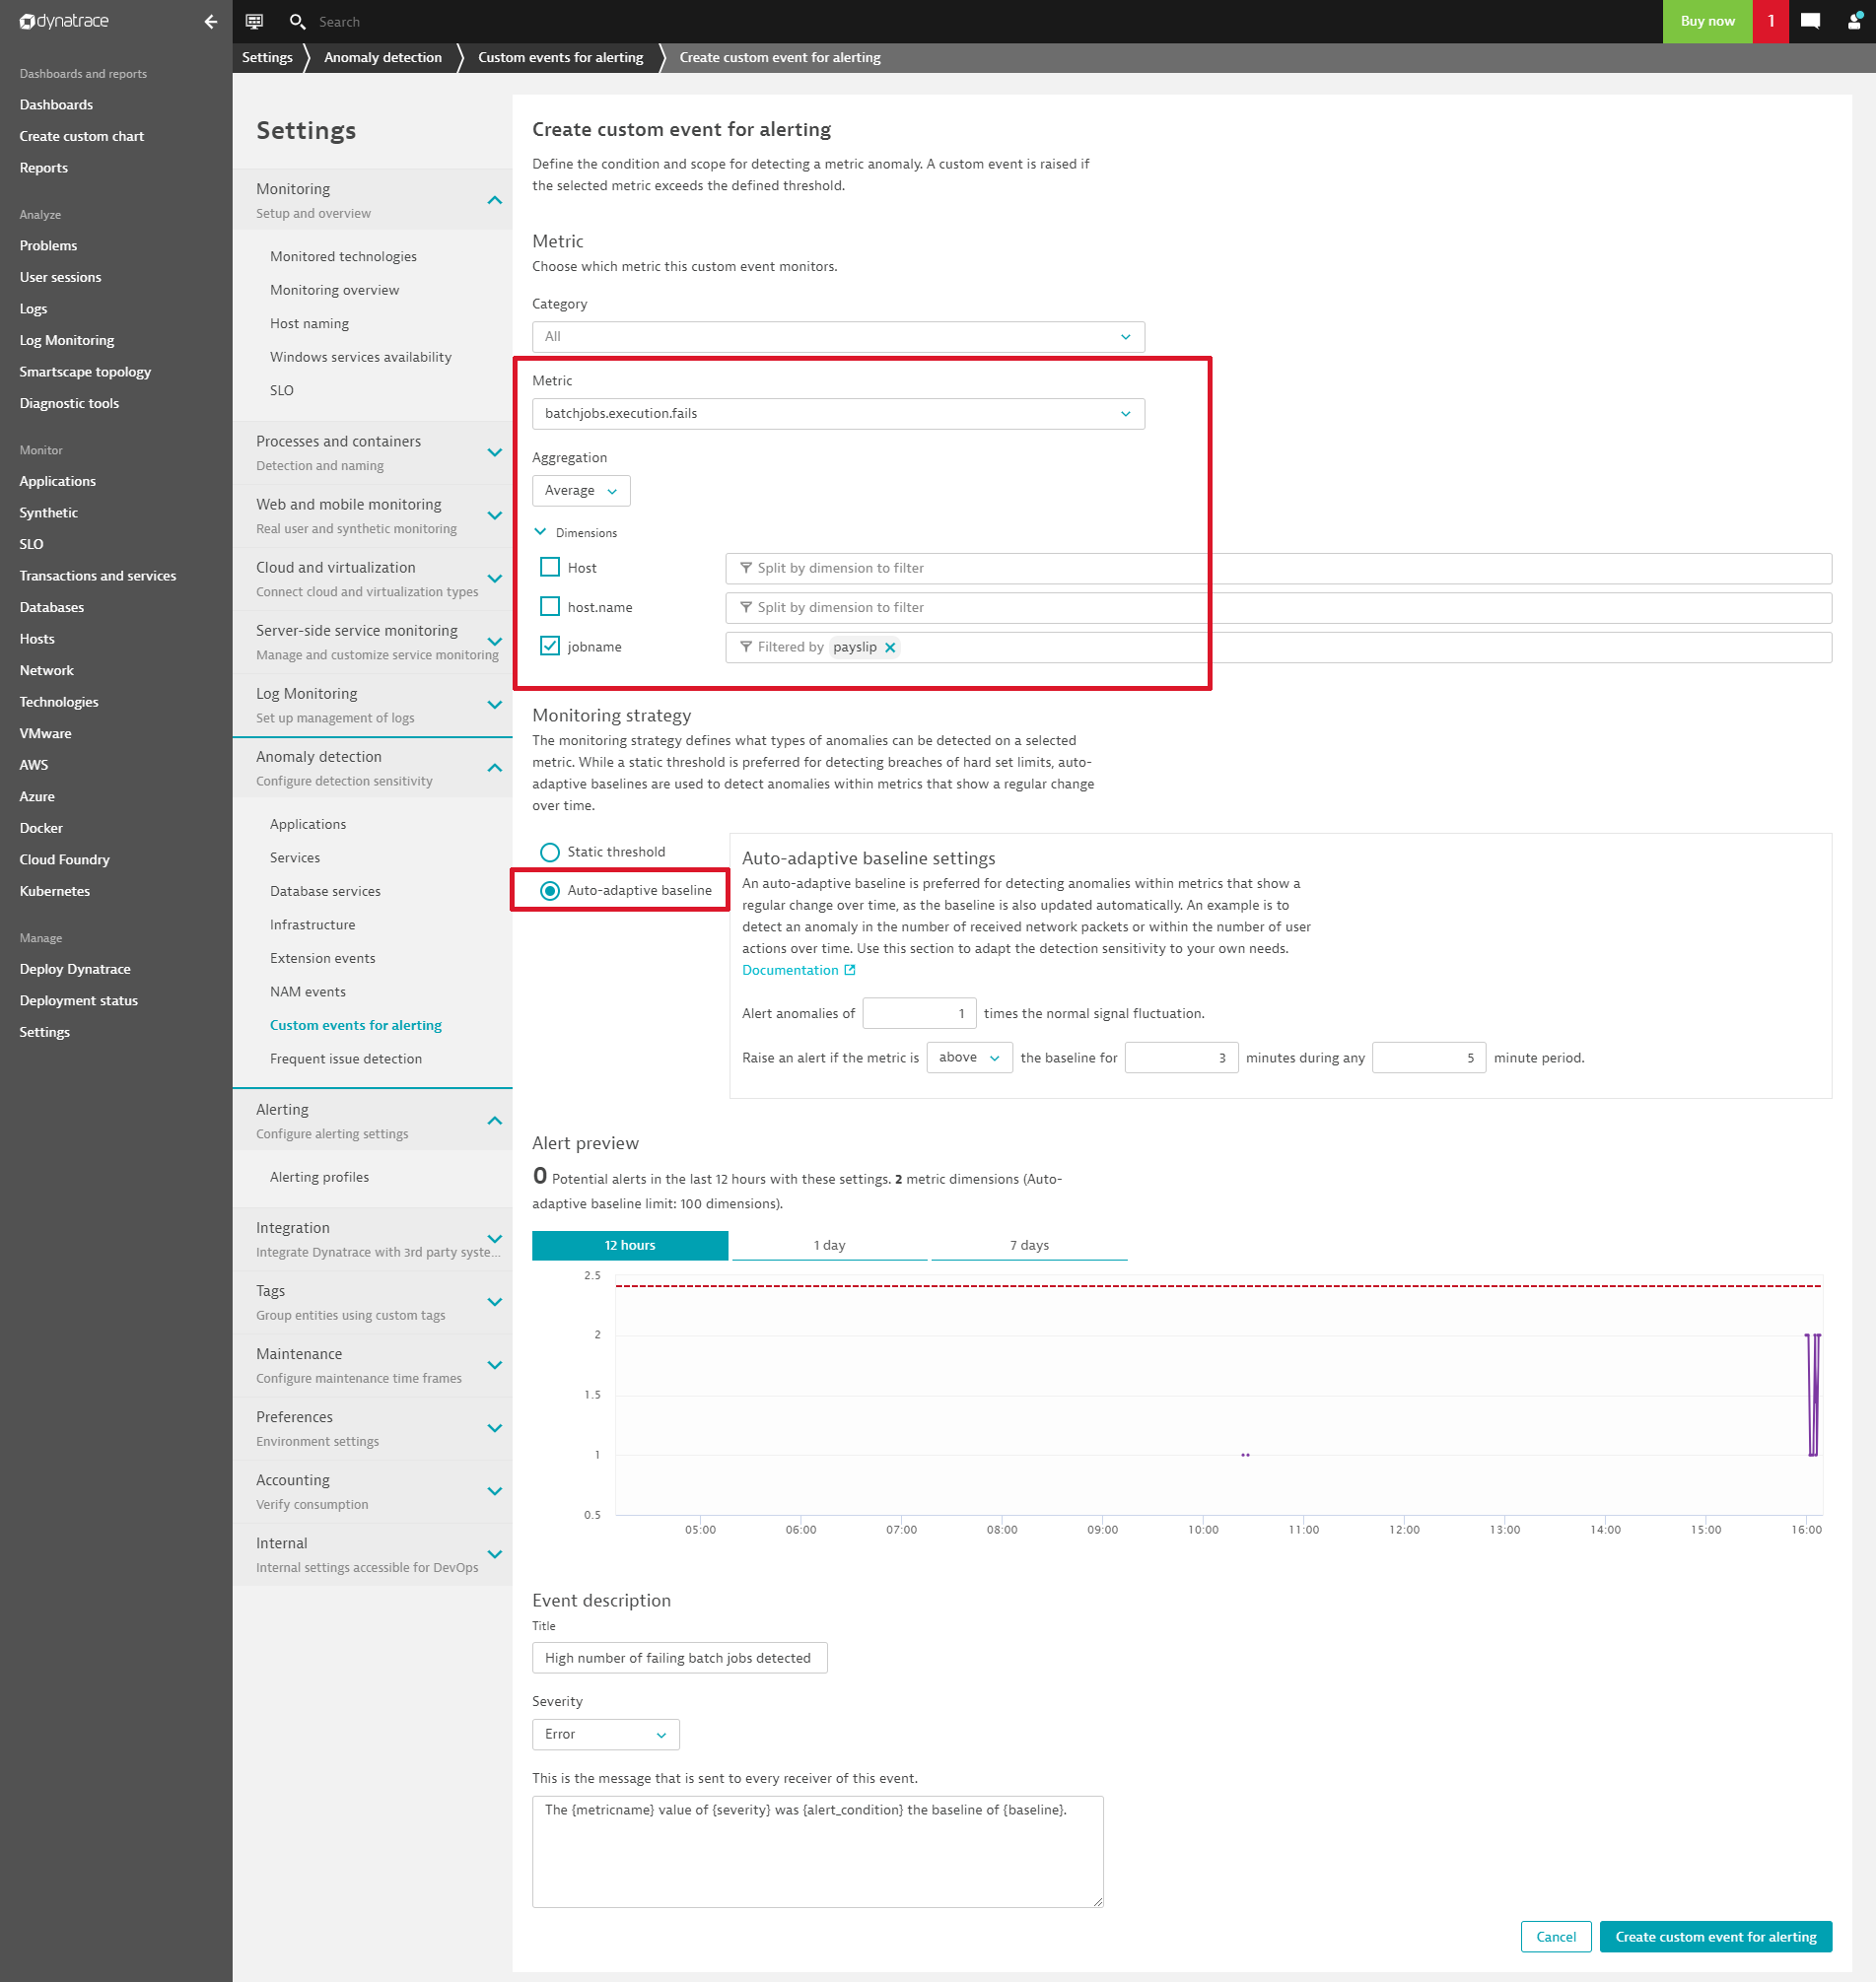
Now let’s assume that we want Davis to trigger an alert whenever an anomaly is detected in the number of failed batch jobs. For this, we go to Settings > Anomaly detection > Custom events for alerting where we can select the metric for the number of failed batch jobs (batchjobs.execution.fails) using the metric picker.
Choose your monitoring strategy (i.e., either a Static threshold or an Auto-adaptive baseline), and define the event title and description for the resulting alert.

Our latest innovation for detecting anomalies in metrics, topology-aware Davis-AI auto-adaptive baselining, is unique in that it adapts to changing metric behavior over time, thereby helping you to avoid false-positive alerts.
Once configured, this event will be raised whenever an anomaly is detected in the number of failed batch jobs. As the metric is topology aware, it has a logical link to the host it is reported for. The event will be raised on this host.
Davis AI root cause detection is triggered based on your chosen event Severity level. Refer to Dynatrace Help to learn about which severity levels trigger Davis and which raise problems.
Seamlessly report and alert on non-topological custom metrics
Now let’s see how Dynatrace ingests and alerts on non-topological metrics, which don’t have logical relationships with Smartscape entities.
Because you can now seamlessly report non-topological metrics, you can now use Dynatrace as a metric database. This gives you all the benefits of a metric storage system, including exploring and charting metrics, building dashboards, and alerting on anomalies.
Let’s take the example of a globally distributed retailer that collects revenue measurements every minute for all its shops worldwide. Revenue per shop isn’t really connected to any topological Smartscape entity, so we skip the association and simply stream the metric into Dynatrace.
Each shop sends its revenue measurements enriched with information about its region, country, and city.
See sample measurements below as they stream into Dynatrace (you can find the complete example on Github).
business.shop.revenue,country=us,region=useast,city=Charlotte,store=shop1 60

business.shop.revenue,country=us,region=useast,city=Jacksonville,store=shop2 24

business.shop.revenue,country=us,region=useast,city=Indianapolis,store=shop3 47

business.shop.revenue,country=us,region=useast,city=Columbus,store=shop4 44

business.shop.revenue,country=us,region=useast,city=NewYork,store=shop5 65

business.shop.revenue,country=us,region=uswest,city=SanFrancisco,store=shop6 95

business.shop.revenue,country=us,region=uswest,city=Seatle,store=shop7 83

business.shop.revenue,country=us,region=uswest,city=SanDiego,store=shop8 100

business.shop.revenue,country=us,region=uswest,city=Portland,store=shop9 100

business.shop.revenue,country=us,region=uswest,city=Anaheim,store=shop10 106
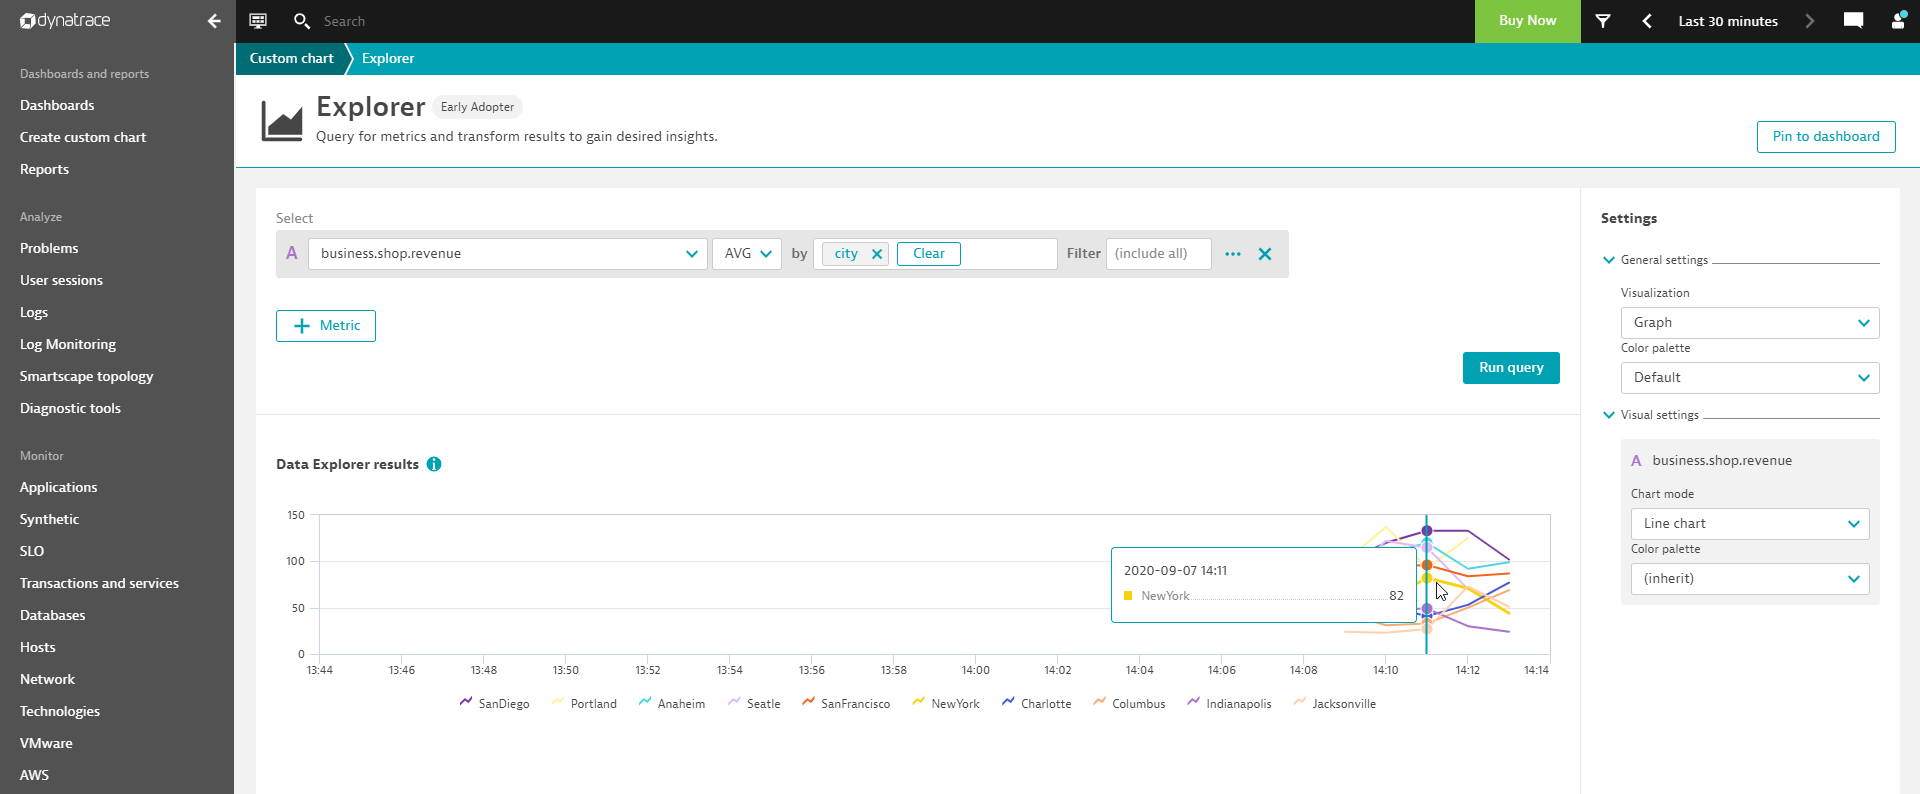
Once all the shops begin reporting their revenue, you can explore the data by slicing and dicing it based on multiple dimensions. The image below shows shop revenue by city.

Now, let’s set up a basic alert for one of these metrics: Go to global Settings > Anomaly detection > Custom events for alerting.
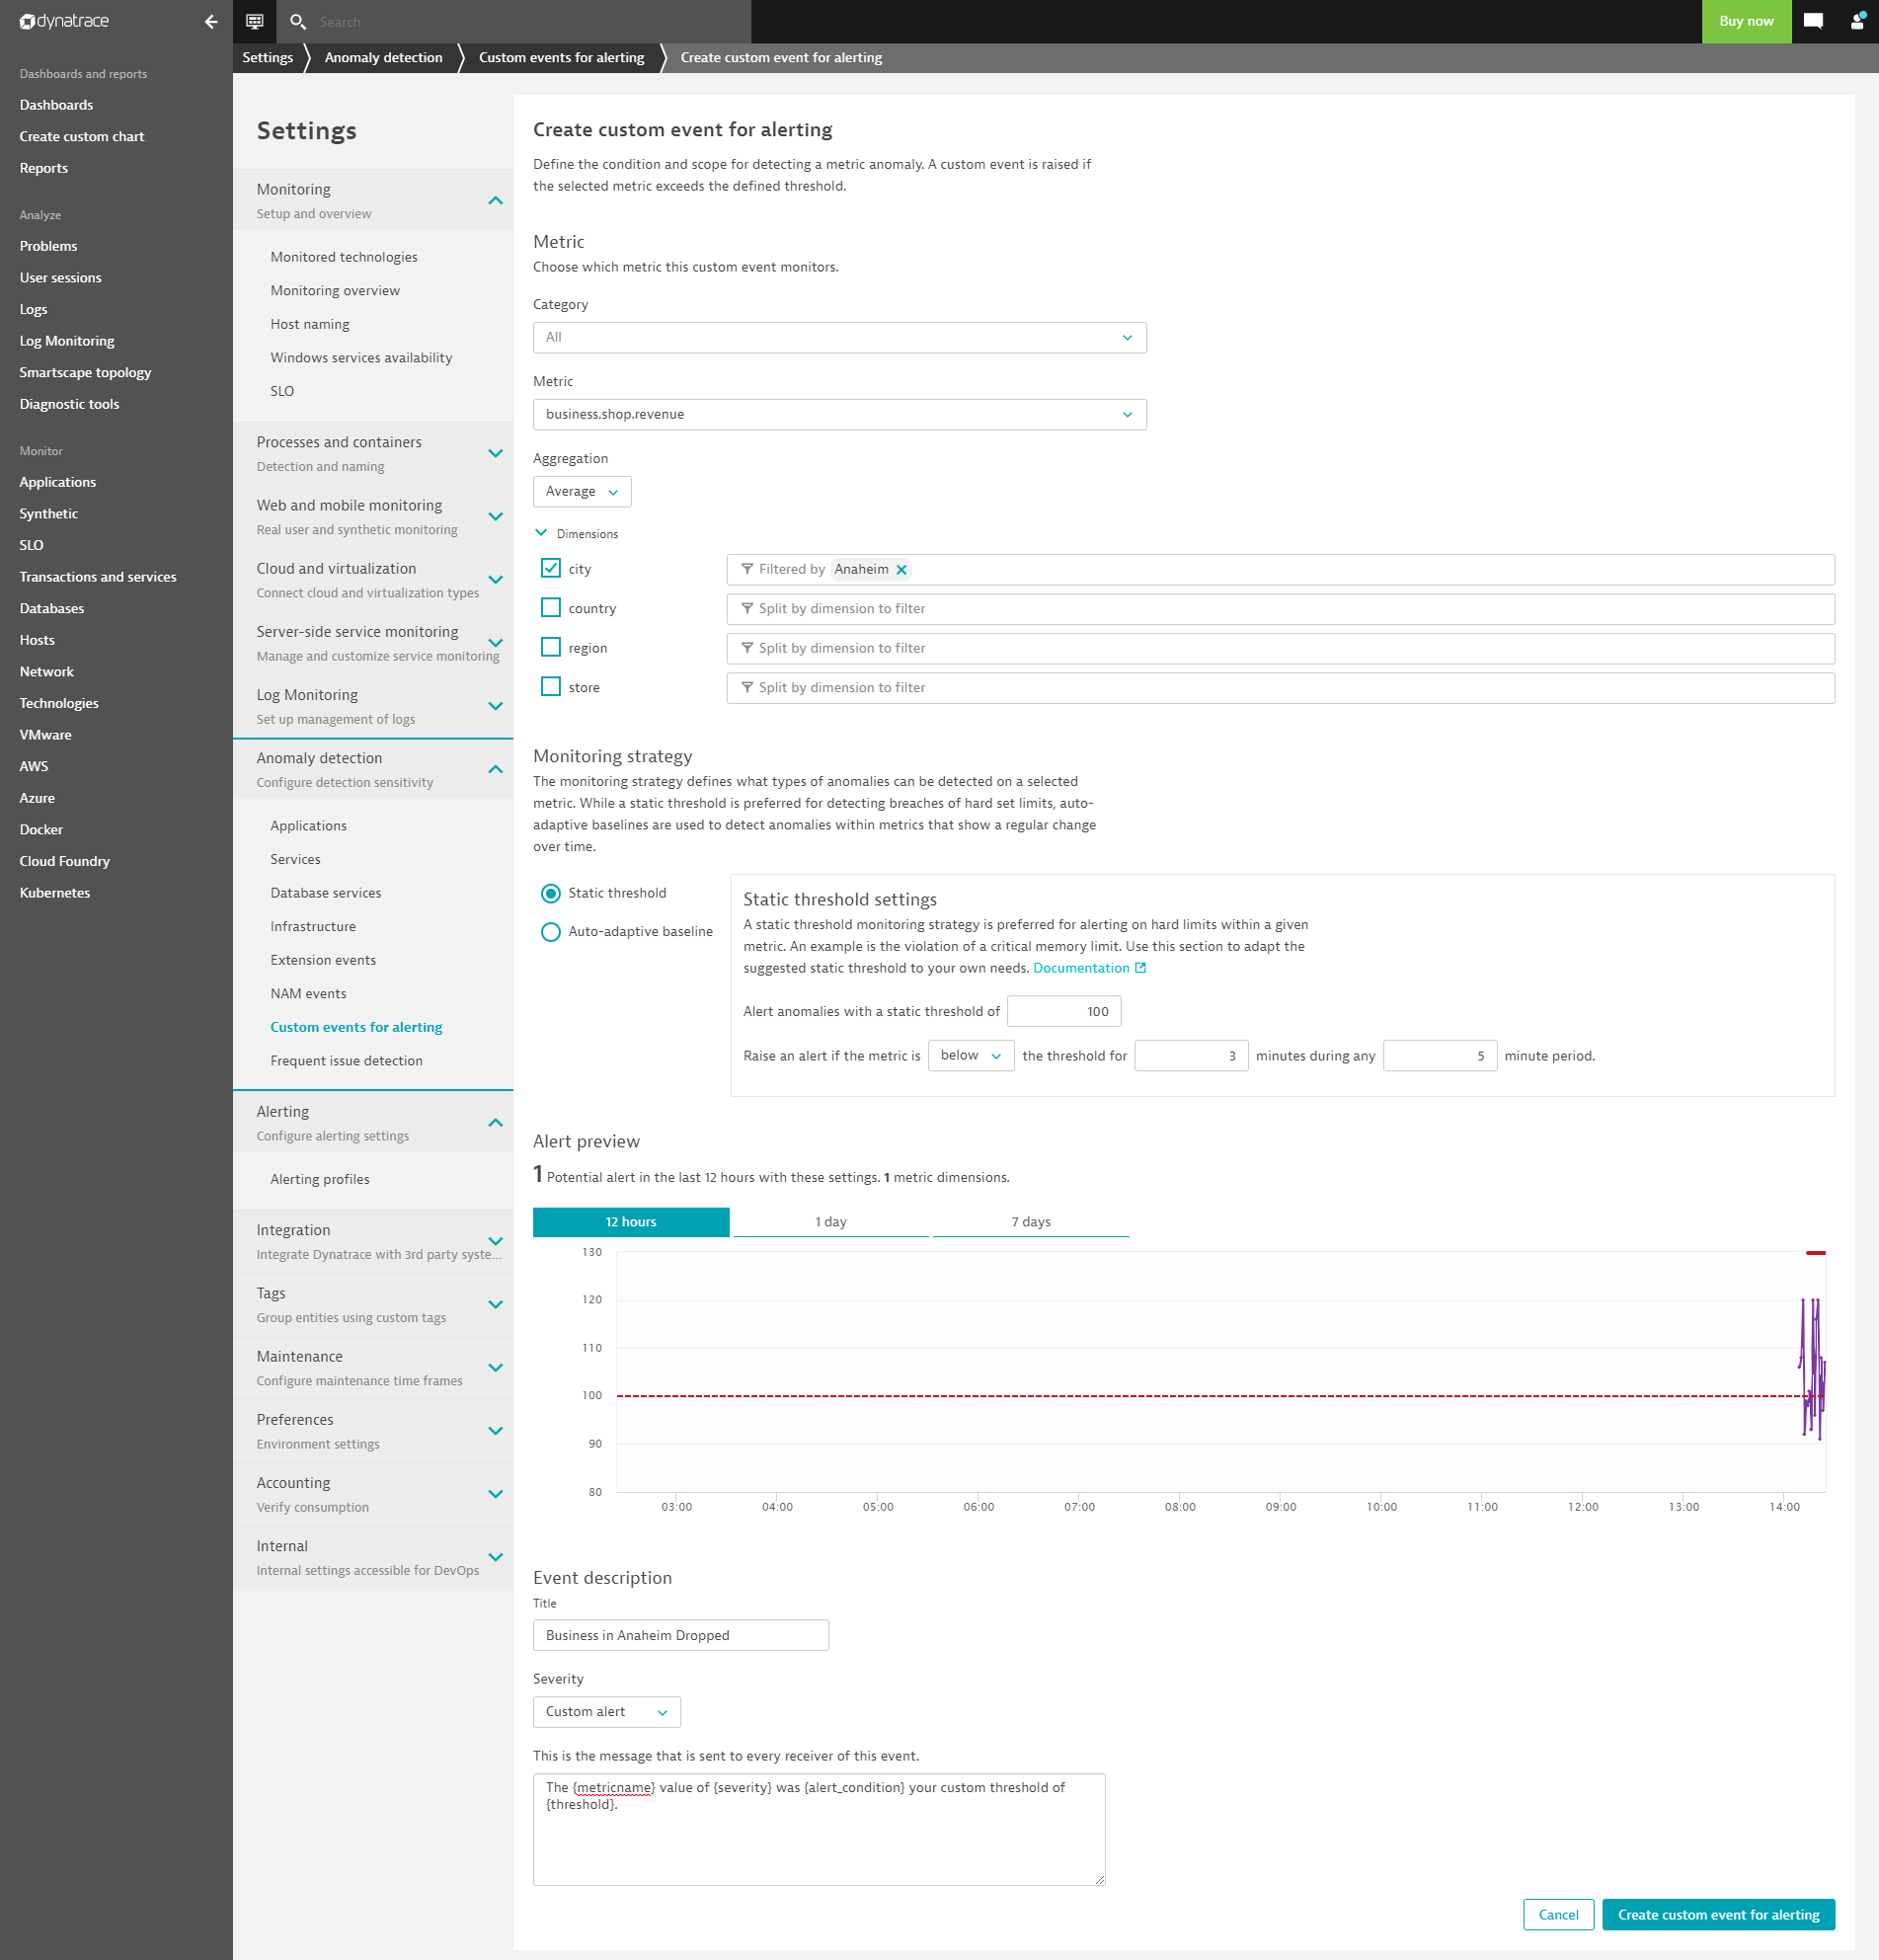
Choose the business.shop.revenue metric and select a dimension value, such as Anaheim, that you want to be alerted on if revenue drops for that city. Here, too, you can select a threshold (Monitoring strategy) and provide a name and description for the alert. Note in the image below that a Static threshold of 100 has been configured to immediately force an alert (for demonstration purposes).
Here’s the completed alert configuration for shops located in Anaheim:

This intentionally low threshold generates an event and an alert within a few minutes, as shown below. With non-topological metrics, you have all the benefits in Dynatrace that a metric storage system can provide, such as exploring and charting metrics, building dashboards, and alerting on anomalies.

It’s important to note that the alert above was raised at the environment level, as no topological entity is linked to the incoming business metric.
What if a topological connection makes sense after all?
That’s easy! Say that, after some time, you discover that a topological connection to an entity (such as an application or a purchase service) makes perfect sense for a business metric. The benefit of the new Dynatrace metric ingestion functionality is the flexibility you get in adding semantic links to Smartscape topology on the fly. You can do this by adding dimensions to your measurements.
For example, let’s assume that you want to link all the business measurements in the example above to an existing application, easyTravel.
We can link a measurement to an application (by ID) in the job/script sending the metric to Dynatrace. This simply adds the reserved dimension dt.entity.application to the metric stream. Depending on your use case, you might want to link different applications to each individual shop’s business measurement or use one application for all, as we’ve done in the example below. The added dimension is highlighted in each measurement.
business.shop.revenue,dt.entity.application=APPLICATION-A0641580EEB00D53,country=us,region=useast,city=Charlotte,store=shop1 73

business.shop.revenue,dt.entity.application=APPLICATION-A0641580EEB00D53,country=us,region=useast,city=Jacksonville,store=shop2 60

business.shop.revenue,dt.entity.application=APPLICATION-A0641580EEB00D53,country=us,region=useast,city=Indianapolis,store=shop3 90

business.shop.revenue,dt.entity.application=APPLICATION-A0641580EEB00D53,country=us,region=useast,city=Columbus,store=shop4 42

business.shop.revenue,dt.entity.application=APPLICATION-A0641580EEB00D53,country=us,region=useast,city=NewYork,store=shop5 42

business.shop.revenue,dt.entity.application=APPLICATION-A0641580EEB00D53,country=us,region=uswest,city=SanFrancisco,store=shop6 106

business.shop.revenue,dt.entity.application=APPLICATION-A0641580EEB00D53,country=us,region=uswest,city=Seatle,store=shop7 122

business.shop.revenue,dt.entity.application=APPLICATION-A0641580EEB00D53,country=us,region=uswest,city=SanDiego,store=shop8 137

business.shop.revenue,dt.entity.application=APPLICATION-A0641580EEB00D53,country=us,region=uswest,city=Portland,store=shop9 98

business.shop.revenue,dt.entity.application=APPLICATION-A0641580EEB00D53,country=us,region=uswest,city=Anaheim,store=shop10 120
Now, if we set up the same custom alert as shown above, we’ll get a topologically enriched event and alert. The event will therefore be raised with reference to the specific application instead of the entire environment.
This also means that if you choose a dedicated event severity level, your configured event will be fully Davis enabled and trigger root cause detection on the auto-discovered topology.
See the Custom info metric event below that was raised for the easyTravel application based on an anomaly that was detected in the business metric for stores in Anaheim.

If you selected the Error severity level in the alert configuration, you will also get an alert and Davis root cause analysis will be triggered for your connected easyTravel application, as shown below:

Summary
Dynatrace has achieved a breakthrough in augmenting open API interfaces like StatsD, Telegraf, and Prometheus by allowing you to feed third-party data from these sources into Dynatrace and map the metrics into real-time Smartscape topology.
As you stream in third-party metrics, you now have the full power of Davis AI on these metrics—topology visualization, anomaly detection, auto-baselining, root cause analysis, and even business-impact analysis. You can either ingest these metrics with no topological connections (using Dynatrace as a metric storage system) or you can enrich the incoming metrics with semantic links to your autodiscovered Smartscape topology model.
With this advancement, Dynatrace is now the data-to-answers-to-actions processing engine of choice that relieves you of the burden of manual health and performance analysis. By leveraging automation over existing data sources, Davis AI enables proven, state-of-the-art AIOps, including auto-remediation workflows.


Looking for answers?
Start a new discussion or ask for help in our Q&A forum.
Go to forum