
Anyone moving to the cloud knows that it isn’t just a change from running servers in your data center to running them in someone else’s data center. If you’re doing it right, cloud represents a fundamental change in how you build, deliver and operate your applications and infrastructure. And that includes infrastructure monitoring.
To take full advantage of all that the cloud has to offer means:
- Becoming more agile by breaking your monolithic applications into microservices and/or serverless functions;
- Running those microservices in portable containers that can run anywhere and be orchestrated to automatically spin up or down based on demand;
- Everything becomes software-defined, including your data center, networking, and storage, to enable flexibility and automation.
This also implies a fundamental change to the role of infrastructure and operations teams. Rather than just “keeping the lights on,” the modern I&O team must evolve to become responsible for building and maintaining the cloud platform, empowering DevOps teams to build, deploy and run applications themselves.
With all this change, thinking about infrastructure monitoring in the same way as you did before is a big mistake. It’s not a matter of finding a cloud-friendly tool that replicates what Microsoft SCOM or Nagios showed in your traditional environment. Just displaying a bunch of metrics on dashboards doesn’t help you solve problems – it overwhelms you with alerts and data.
For today’s dynamic, hybrid, multi-cloud environments, infrastructure monitoring must be:
- Automatic and easy
- Able to provide answers, not just data
- Part of a full-stack solution
- Wired into your enterprise ecosystem
Automatic and easy
When your infrastructure is complex and constantly changing, automation becomes essential. Deploying and maintaining agents must be easy. You can’t afford to spend time dealing with multiple agents, complex deployment, manual baselining and alert configuration.
When you deploy infrastructure monitoring tools that are primarily metric aggregators like Datadog or New Relic, you must know everything about your environment and what you want to monitor up-front. You’ll need to manually configure process-level monitoring by editing config files. Not too painful if you’re monitoring a few hosts but think about extending that to hundreds or thousands of hosts. It’s a ton of work just to collect a bunch of data.
That’s why we built the Dynatrace platform with simplicity in mind. We have one agent that can be deployed in full-stack mode, giving you visibility into infrastructure and applications, down to the code-level, or in infrastructure mode, which covers your infrastructure including servers, containers and orchestration platform at a fraction of the cost of full-stack.

With Dynatrace, everything is automatic. Once deployed to your hosts, the OneAgent automatically discovers and maps your environment, regardless of what technologies are running on those hosts. What happens next is pure magic. Dynatrace will automatically start looking for problems across your environment, telling you the business impact and the root cause.
The key point is that Dynatrace is completely automatic. However, if you do want that granular level of visibility and control you still have the option to view all the metrics and manually set baselines.

Answers, not just data
That brings us to the second key requirement for cloud infrastructure monitoring. Collecting and displaying a bunch of metrics may sound like a good idea, but what happens when something goes wrong?
Your dashboards are a sea of red. Alert notifications are piling up. There is a problem, but now what? How do you know what you should be looking at? What is the effort involved to get meaningful insights and answers from the data?
Infrastructure monitoring tools that just capture a lot of metrics and display the data on charts provide limited value for a complex, dynamic environment; at best they provide clues that your team will spend hours poring over in a war room.
Some infrastructure monitoring tools are adding AI as a new layer to their solution to try and make sense of all the data. Bolting on an AI solution can at best correlate events and alerts, but it can’t tell you anything about causation.
With Dynatrace, our AI engine Davis® is built into the platform at the core. It’s been in production and providing real answers to customers for years. Davis tells you when there is a problem, and it has the context to know which events are related to the same problem.
It’s not correlation – Davis knows because it is part of the platform and sees all the relationships and interdependencies in your environment. When it finds a problem, Davis tells you the business impact of the problem and the root-cause, whether that is a technology issue or a recent deployment event. It’s explainable AI, and there’s nothing else like it.
Part of a full-stack solution
In traditional environments, silos are bad. In the cloud, silos are lethal. That’s because the number of dependencies between various components of your stack is multiplied exponentially in modern, dynamic cloud environments.
When something goes wrong, it’s not enough to look at metrics or events in isolation – you need context. Without it, you end up with alert storms and war rooms, things you are most likely all too familiar with.
But you can’t just slap a correlation engine on top of all those metrics and events, as mentioned earlier. Correlation engines lack context. All they can do is look at raw data and try to make sense of it, with no understanding of the relationships and dependencies between the various elements; making only guesses as to what’s going on.
We built Dynatrace, not as an APM, ITIM or AIOps solution, but as a full-stack solution. That means one platform that can see everything, from the digital experience of users to the microservices that make up the application, the underlying processes, containers, and servers that it all runs on.
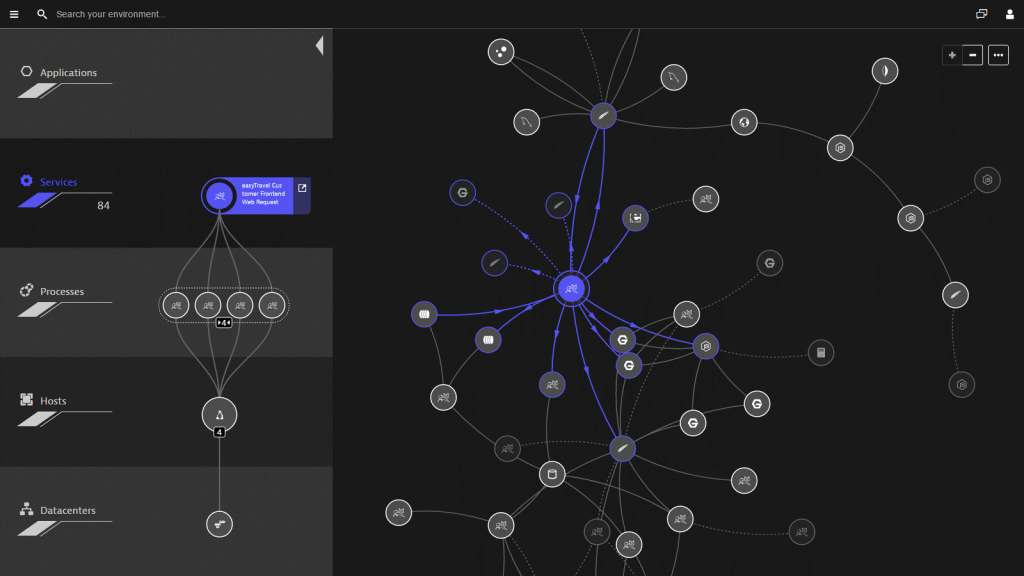
Even for hosts where you’re running the Dynatrace OneAgent in cloud infrastructure mode, the concept of full-stack is still important. For these hosts, you may not be getting code-level visibility, but you’re still seeing all the relationships and dependencies, something that is key when your infrastructure is complex and constantly changing.
It’s this full-stack context that enables Davis to be deterministic. It’s causation, not correlation, and it’s what you need to rid yourself forever of the alert storms and war rooms.
Wired into your enterprise ecosystem
Automated, AI-powered, full-stack monitoring is key for getting the answers you need, but there is one more key requirement for cloud infrastructure monitoring. Most enterprise I&O teams have a goal to automate as much as possible, and to do that infrastructure monitoring can’t exist in a vacuum. It must be an integral part of your enterprise ecosystem.
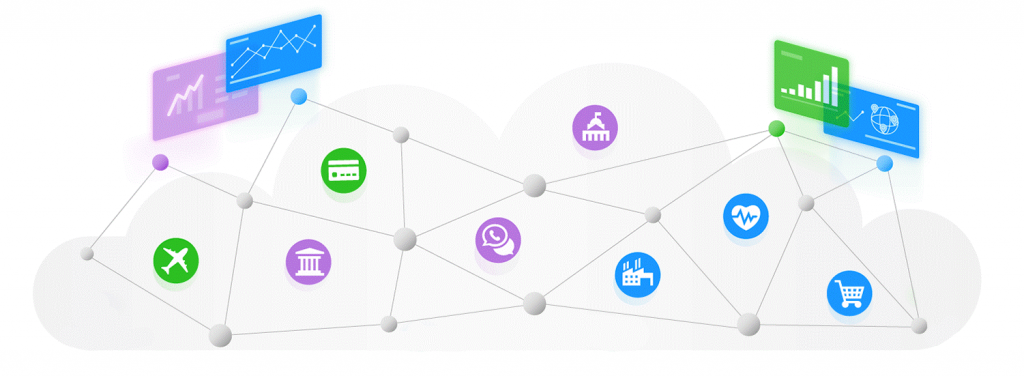
Many Dynatrace customers are moving quickly from a traditional delivery and operational model towards NoOps and a fully Autonomous Cloud approach – on the path to a self-driving enterprise. And much like self-driving cars, there are three key parts to a self-driving IT ecosystem – sense, think and act.
- Sensing – Observability; being able to see what’s going on across your environment, in real-time, including not only metrics, events, and traces, but also user experience and topology. Dynatrace does that through our OneAgent, and integrations to bring custom metrics and information like deployment events into the platform.
- Thinking – Done by the Davis AI engine. As I covered earlier, Davis is unique in that it is explainable AI. In other words, it provides deterministic answers, not just correlations or guesses, using the quality of data provided by OneAgent and our integrations; it’s high fidelity and goes beyond just data, to provide context in the form of relationships, dependencies and user experience.
- Acting – In an automated world, this is done by your ITSM or CI/CD tools. Davis also helps here, because contextual data and explainable AI are key for automating the ‘act’ part of the formula. You cannot act if your tooling is spewing alert storms, false positives and false negatives. The sensing and thinking must be precise. You need to trust the answers you’re getting before you can safely automate remediation.
Infrastructure and full-stack monitoring together
Having an all-in-one platform with a single agent that can be used in either full-stack or cloud infrastructure mode gives you the ultimate flexibility. Full-stack is great, but not everything in your environment needs full-stack. Many Dynatrace customers use full-stack mode on hosts running critical applications and services, while using cloud infrastructure mode for hosts running tier 2 and 3 applications or apps that can’t be instrumented, database servers where you don’t need code-level visibility, or just to get broad infrastructure visibility.
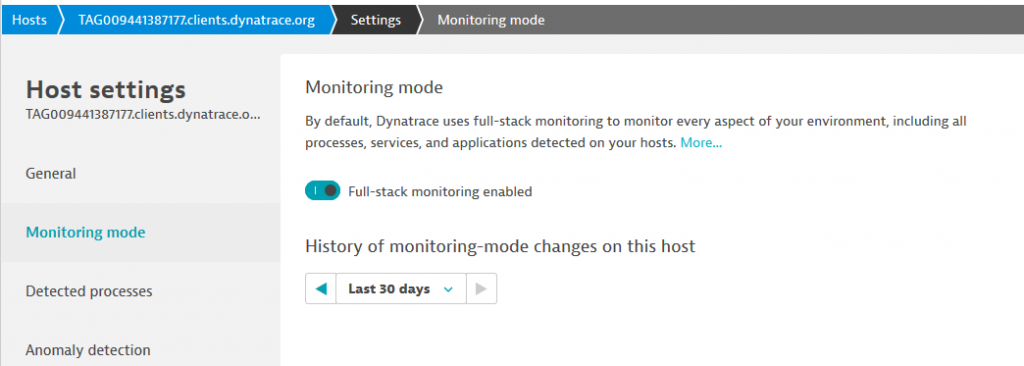
If you’re already using Dynatrace in full-stack mode, trying Infrastructure Monitoring is easy. Just deploy a new agent and flip the toggle switch to disable full-stack monitoring.

Or, to switch a host that’s already deployed, go to the host settings page and make the switch within the ‘monitoring mode’ panel.
If you’re not a current Dynatrace customer, head over to the free trial page to get started now!




Looking for answers?
Start a new discussion or ask for help in our Q&A forum.
Go to forum