Dynatrace introduces new enhancements to application problem analysis that allow I&O teams to identify and prioritize issues such as crashes and errors in the problem view. These enhancements add enriched context that help explain not just the “what” but also the “why” behind the issues so that DevOps teams can take corrective action based on reliable AI-driven answers rather than basic monitoring data.
Whenever a performance problem is flagged, Infrastructure and Operations (I&O) practitioners strive to resolve the issue as soon as possible by identifying the root cause, understanding the impact, obtaining the relevant details, and fixing the issue within the shortest possible timeframe—the meantime to resolution (MTTR). But this is often not as intuitively simple as it should be in other solutions where DevOps teams must click through a series of screens and dashboards to get to the root cause. This results in delays, frustration amongst team members, and lost conversions.
So, whenever your end users’ digital experience is bogged down by a problem, whether it’s the result of a synthetic monitor (browser as well as HTTP), mobile app monitoring, or web monitoring, your teams need to see the most pertinent information about the impact and the root cause at a glance. Often, raised problems are the result of custom settings with fixed thresholds or the creation of custom events for alerting. In large enterprise environments, it’s often difficult to determine who configured such settings and thresholds.
Leverage AI assistance to deliver better customer experience
At the heart of Dynatrace Digital Experience Monitoring (DEM) is Davis, the state-of-the-art AI engine that accurately prioritizes the severity of each detected performance anomaly in terms of its potential impact on real users and business KPIs. Without any configuration or the need for a data scientist, Davis provides instant and automatic answers to degradations in service, anomalies in behavior, and impact on user experience so that I&O teams can chart a clear course of action to resolve issues. To facilitate this further, we’ve introduced new information in problem details when Digital Experience Monitoring issues are raised.
Problem details have been further enhanced so that practitioners can confidently rely on summarized intelligence to ensure a better user experience. You can swiftly determine why an alert was raised or understand how a custom performance threshold that was set up previously by another person in the organization is related to a performance/slowdown issue.
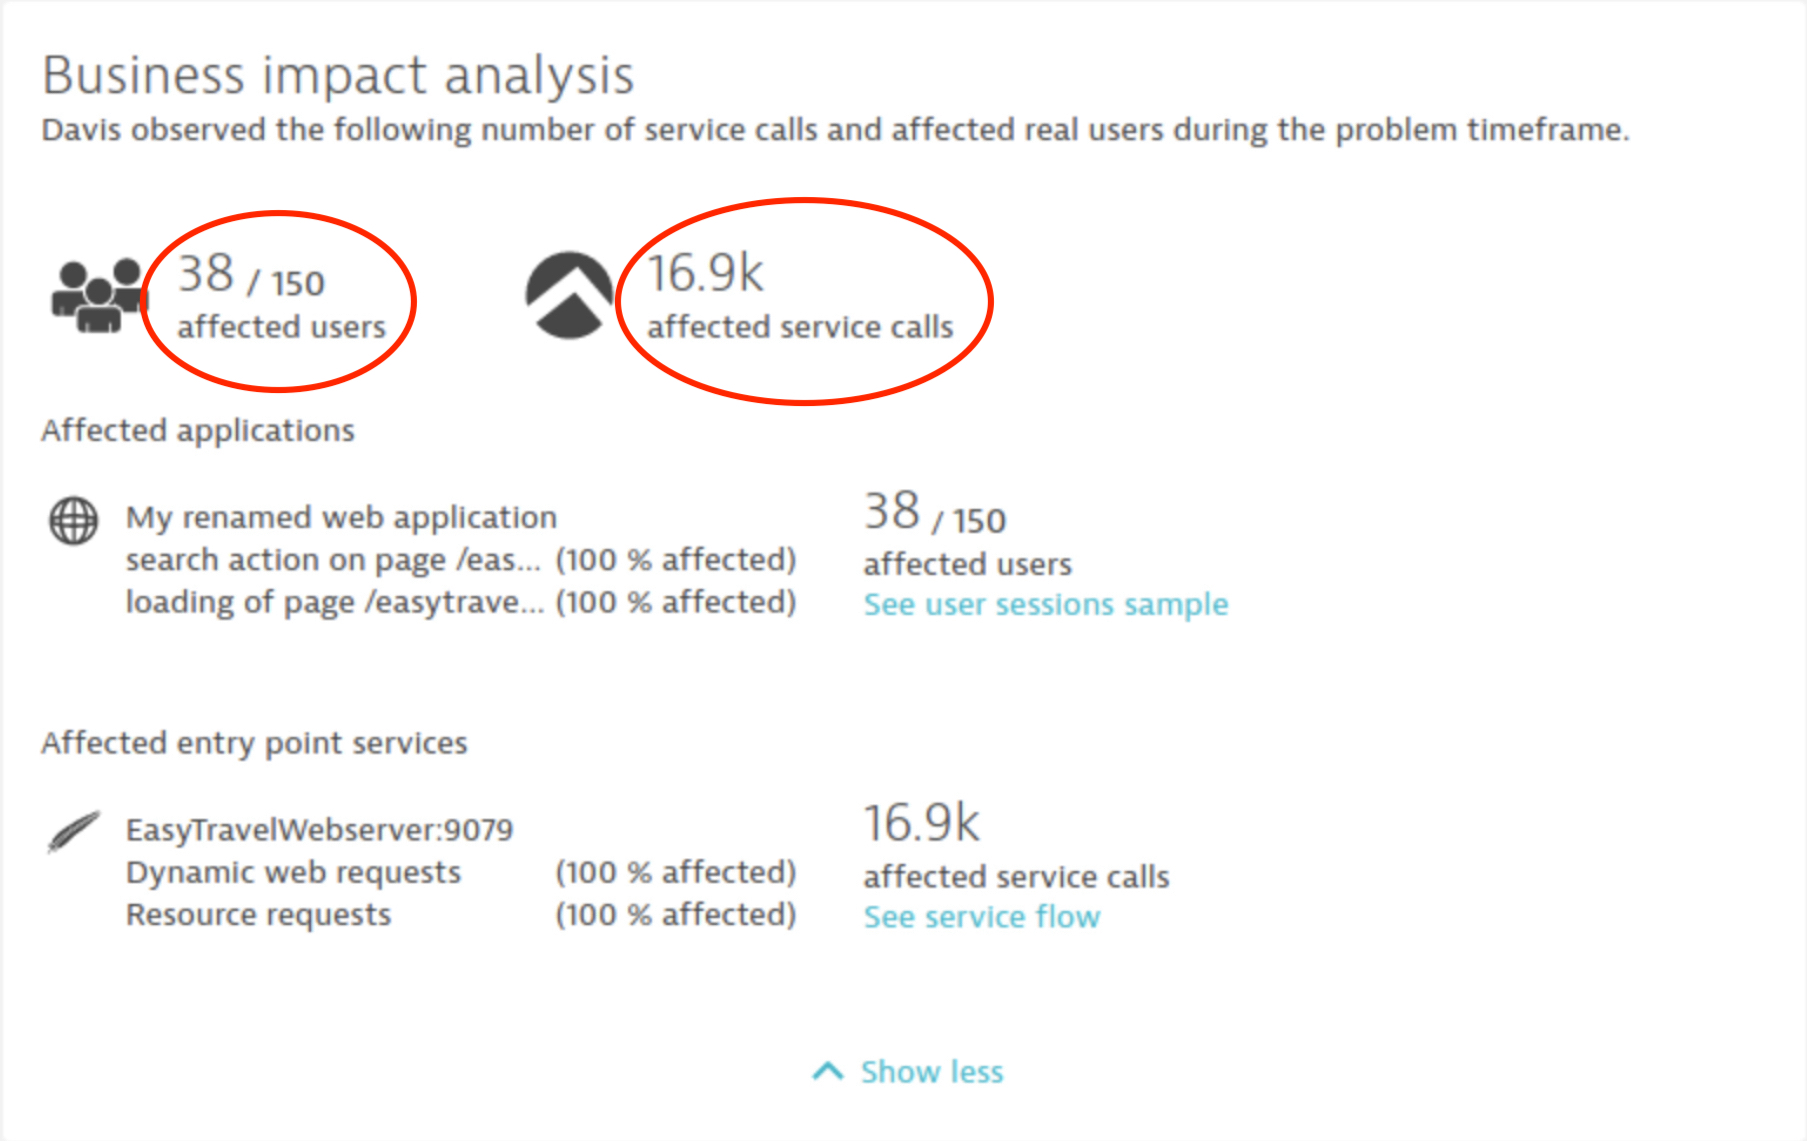
- For DEM problems, the business impact analysis shows the number of users that are potentially impacted by a problem. This section has been improved to show you the ratio of the number of users affected by the problem compared to the total number of users using the application during the problem timeframe.
- The impact section is now enriched with the list of affected applications, services, and other entities affected by the problem for increased productivity and data-driven decisions.
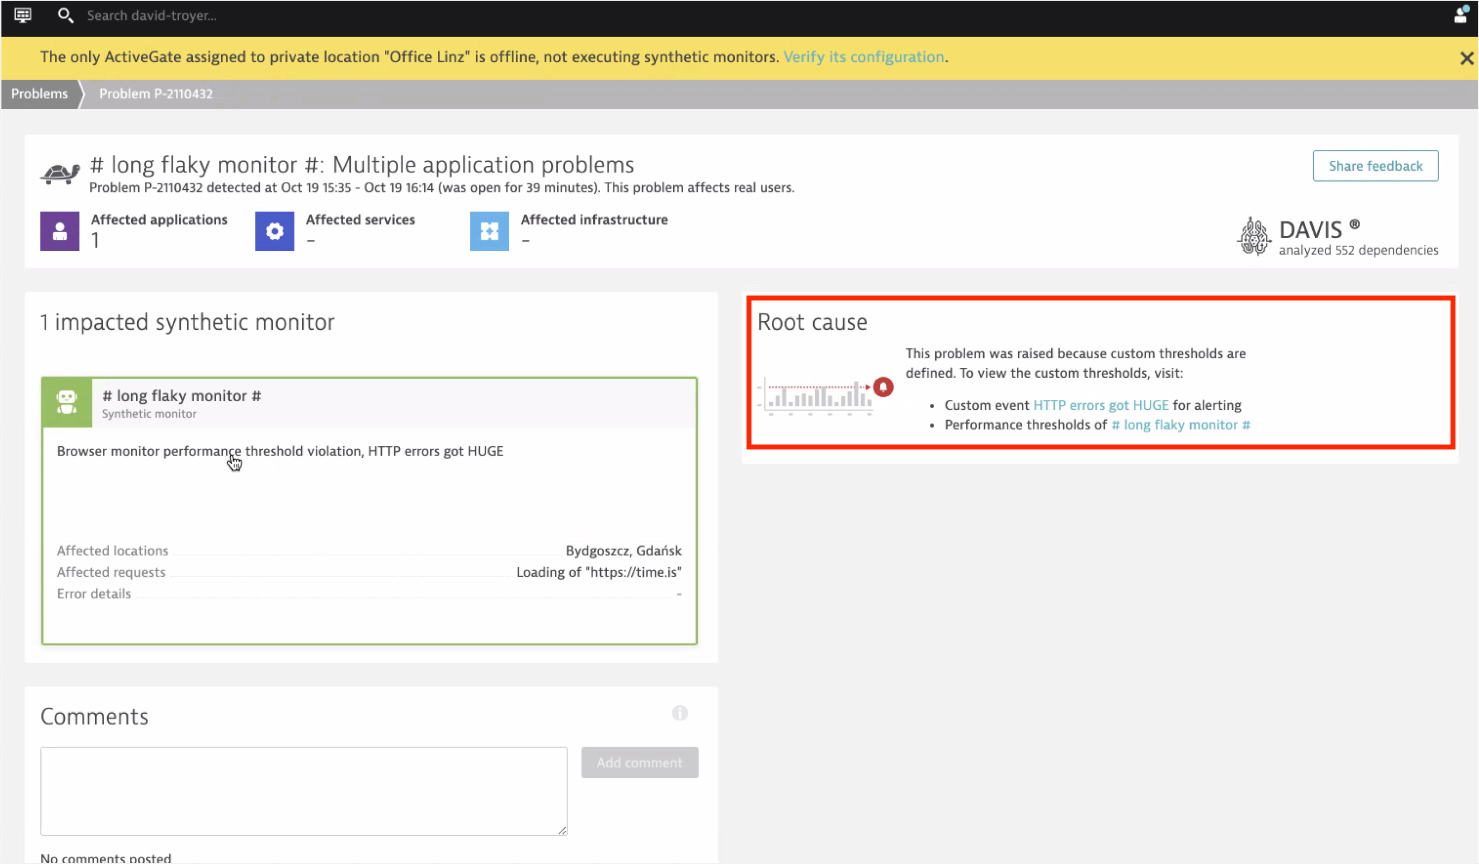
- The root cause analysis section now contains links to custom events for alerting and manual performance thresholds. This ensures greater agility and reduces the time to resolution.
How you can leverage the enhanced intelligence
Here are five use cases where you can benefit the most from the new information in DEM problem details:

- Problem prioritization: The ratio of affected users to observed users for web and mobile problems is clearly shown. This ensures that I&O practitioners are better able to understand the impact of a problem. With this information, you can prioritize problems that have the highest number of affected users, drill down to affected user sessions, and understand the impact of a problem.
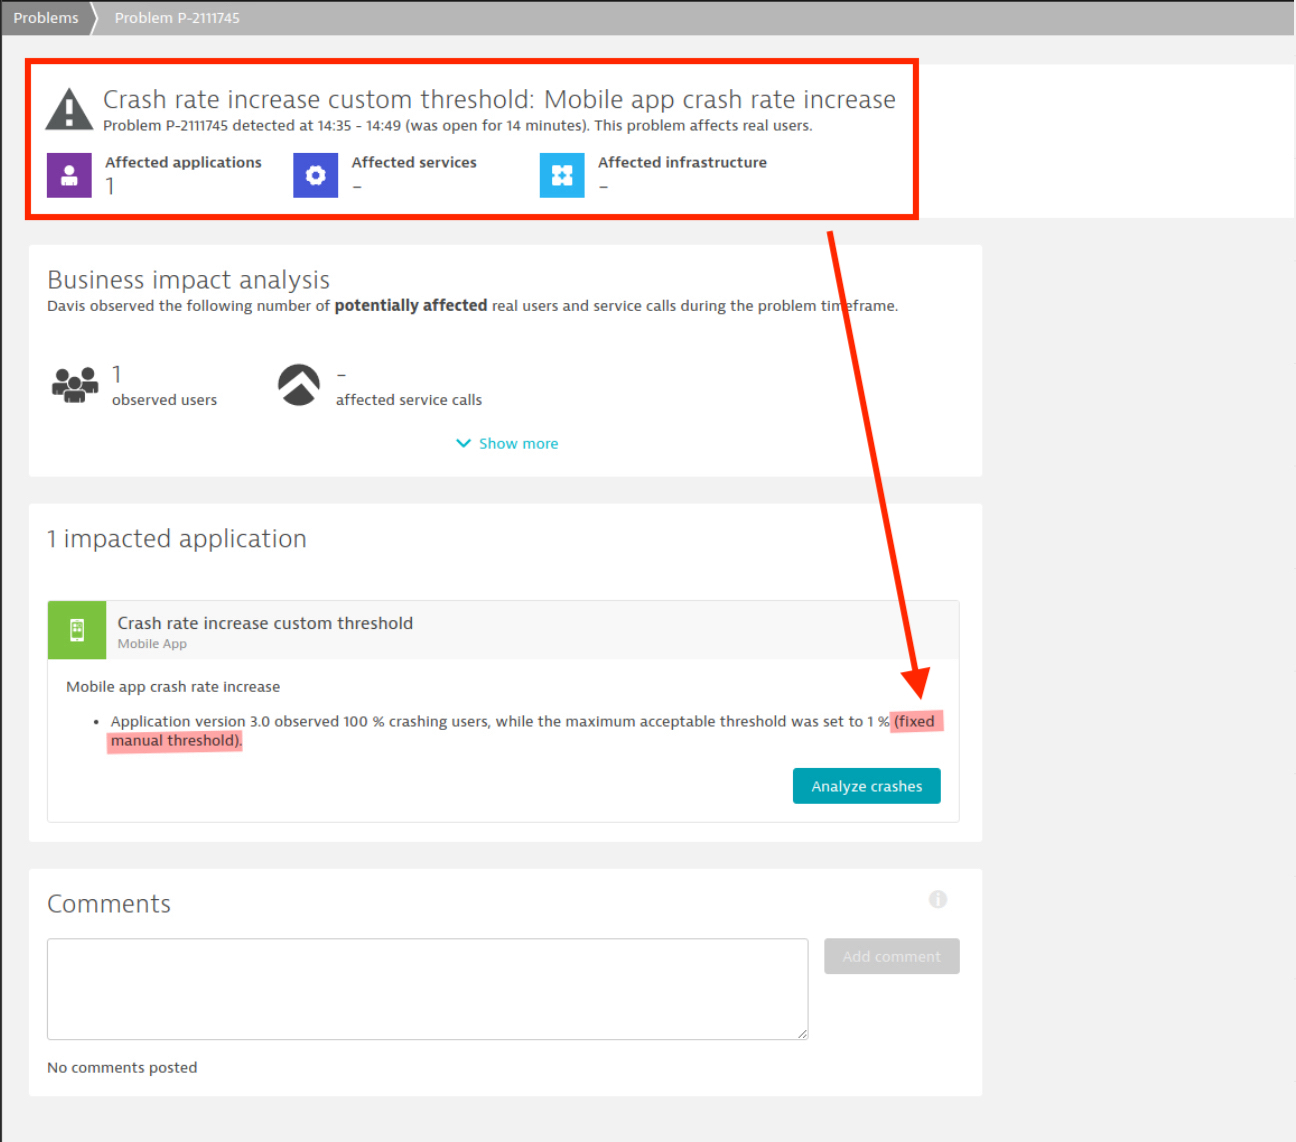
- Mobile crash increase troubleshooting: Your teams are short on time. In case of a spike in the crash rate for your app, you can go directly to the crash overview. With this update, your teams save time and can quickly access the crashes to analyze the root cause. The type of breached baseline (auto-detected baseline or fixed manual threshold) is also available as additional information in the crash rate increase section.
- Root cause and settings in enterprise environments: With a large user base, you face a mammoth task in identifying which custom events trigger certain alerts. With this update, any I&O practitioner who comes across a custom alert in problem details can identify exactly which custom event was manually set up for alerting. This is particularly handy in enterprise environments where only a select few people can create custom events for alerting.
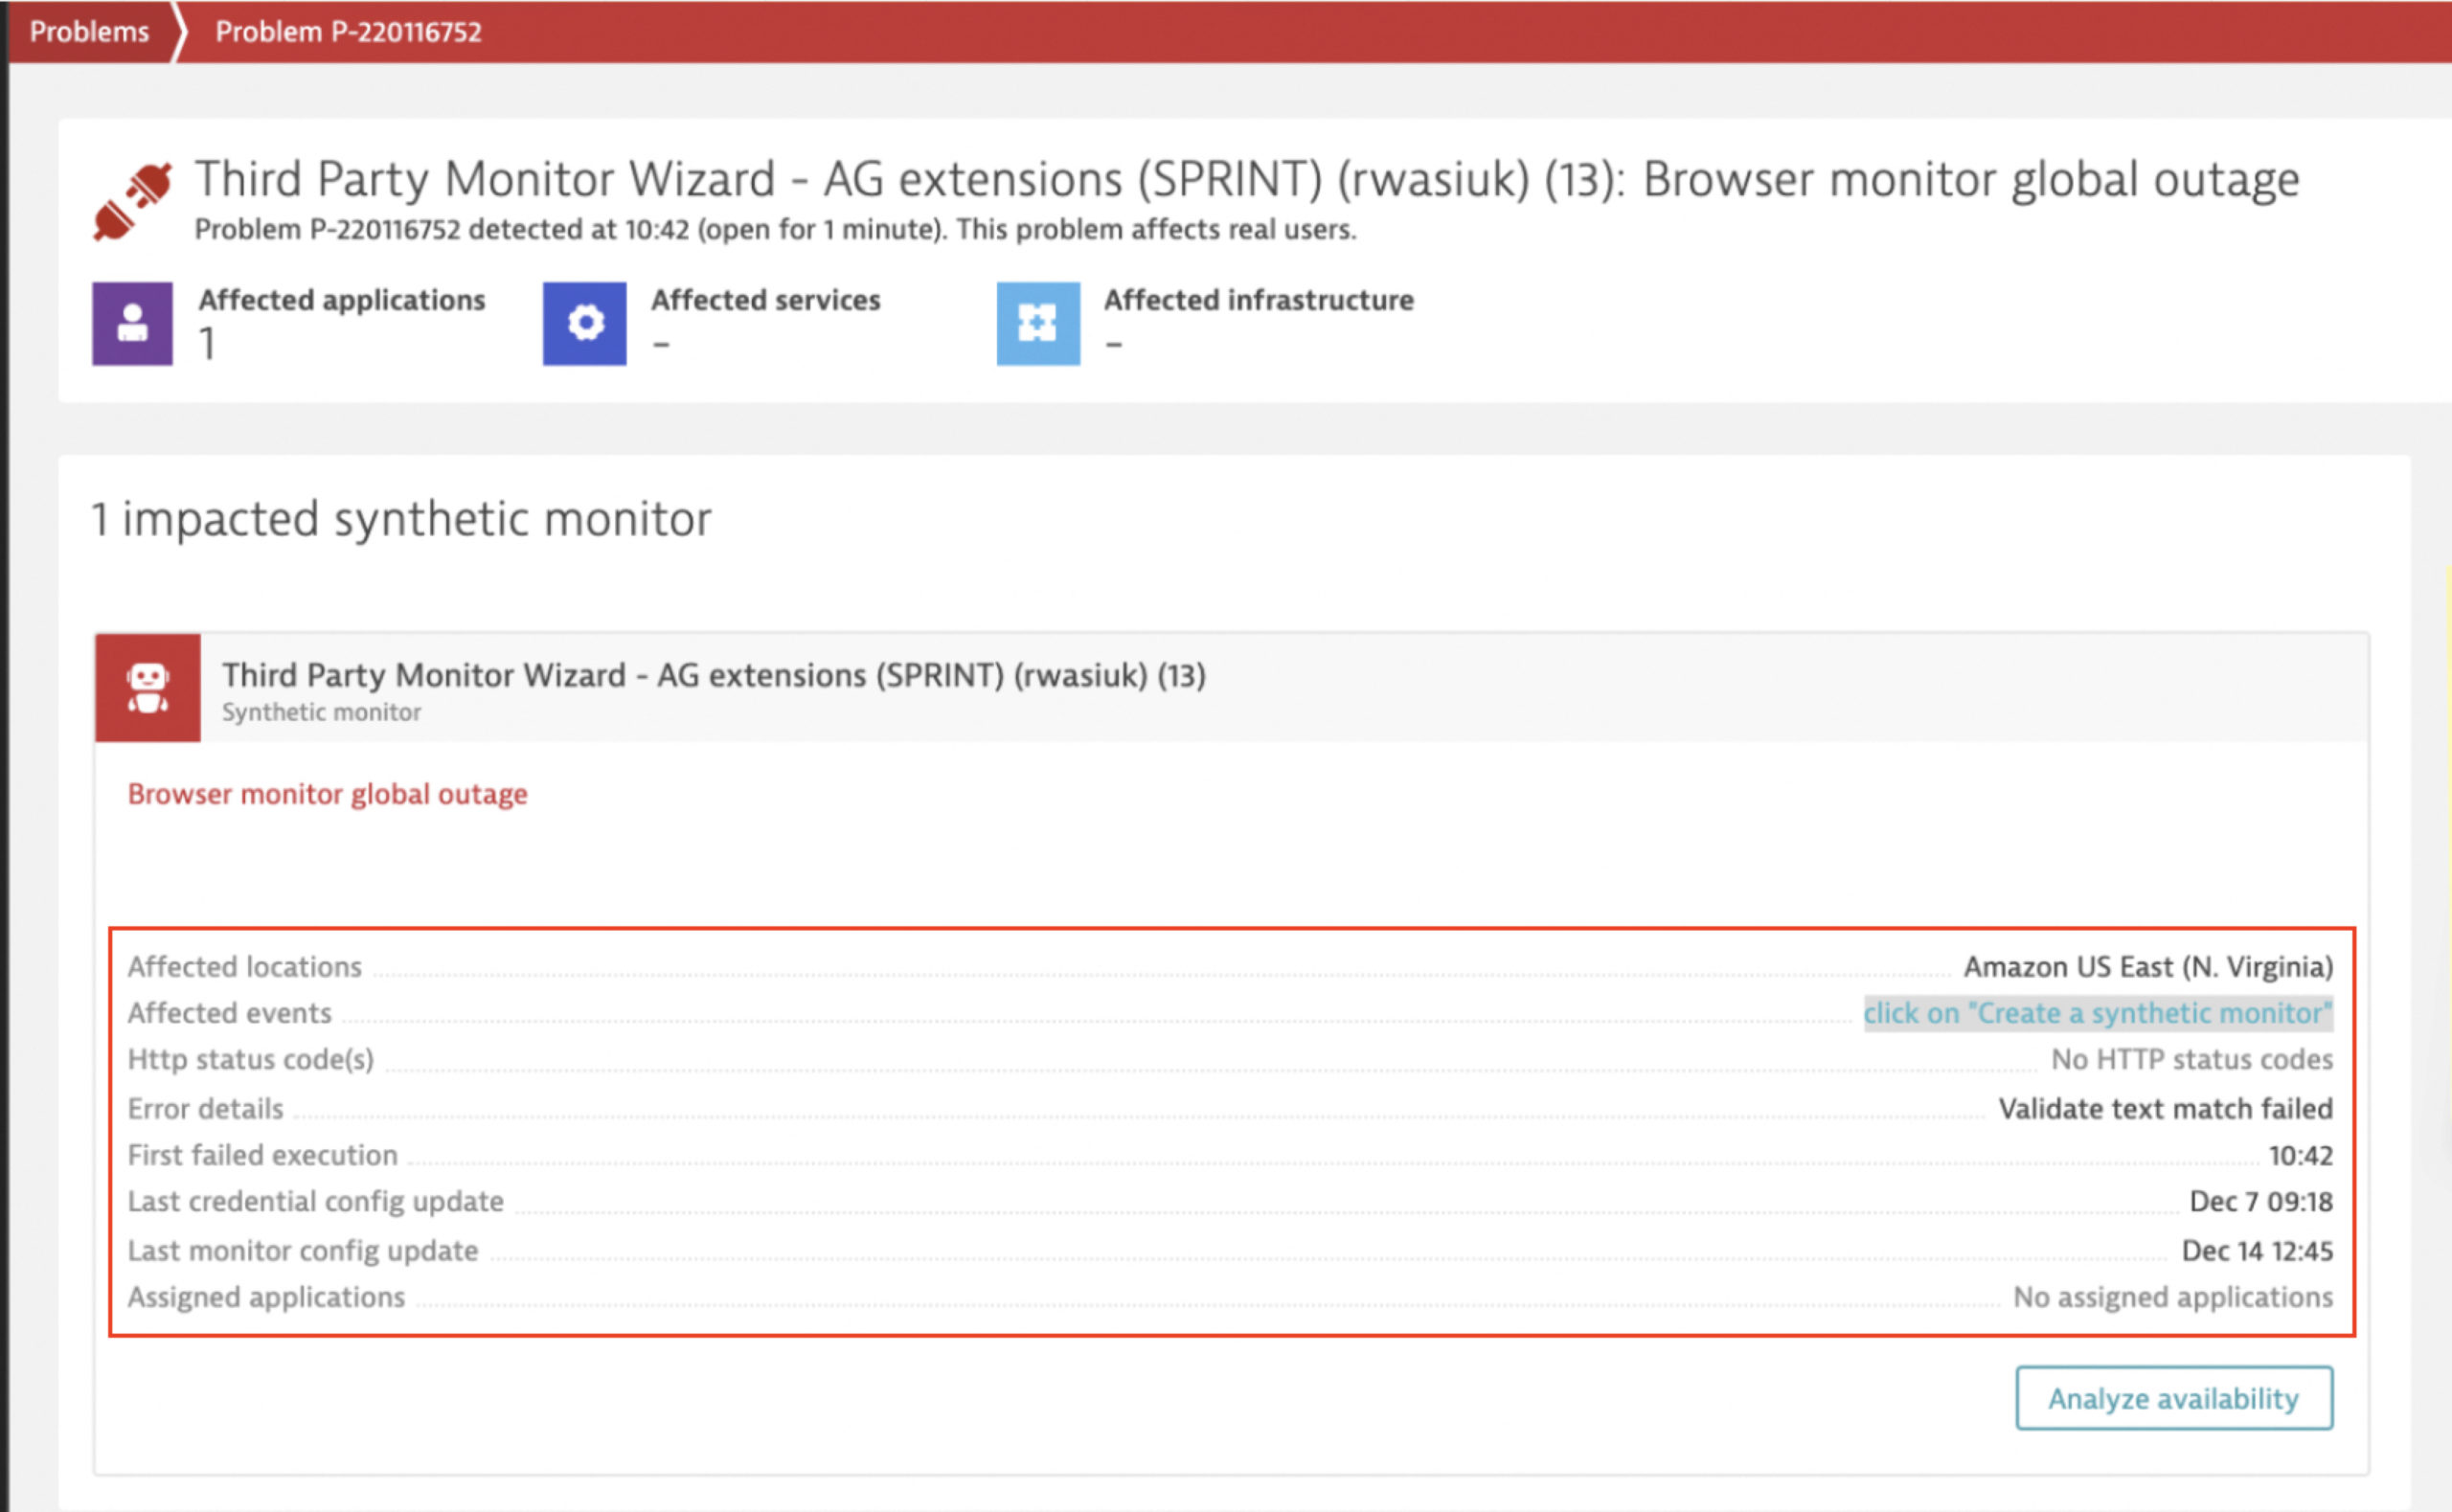
- Synthetic problem troubleshooting: Looking for the root cause of a failing synthetic monitor can be tricky, especially when the tested application is not fully monitored. To facilitate the troubleshooting of synthetic monitors (HTTP as well as browser monitors), we’ve added more actionable data directly in problem details (for example, direct links to recent failing executions, monitor settings, and monitor results pages filtered by the problem duration). You can also see more information like timestamps for recent configuration changes, which, in some cases, can be the cause of a synthetic monitor’s failure. Bringing this information into problem details saves you time in troubleshooting synthetic monitoring problems.
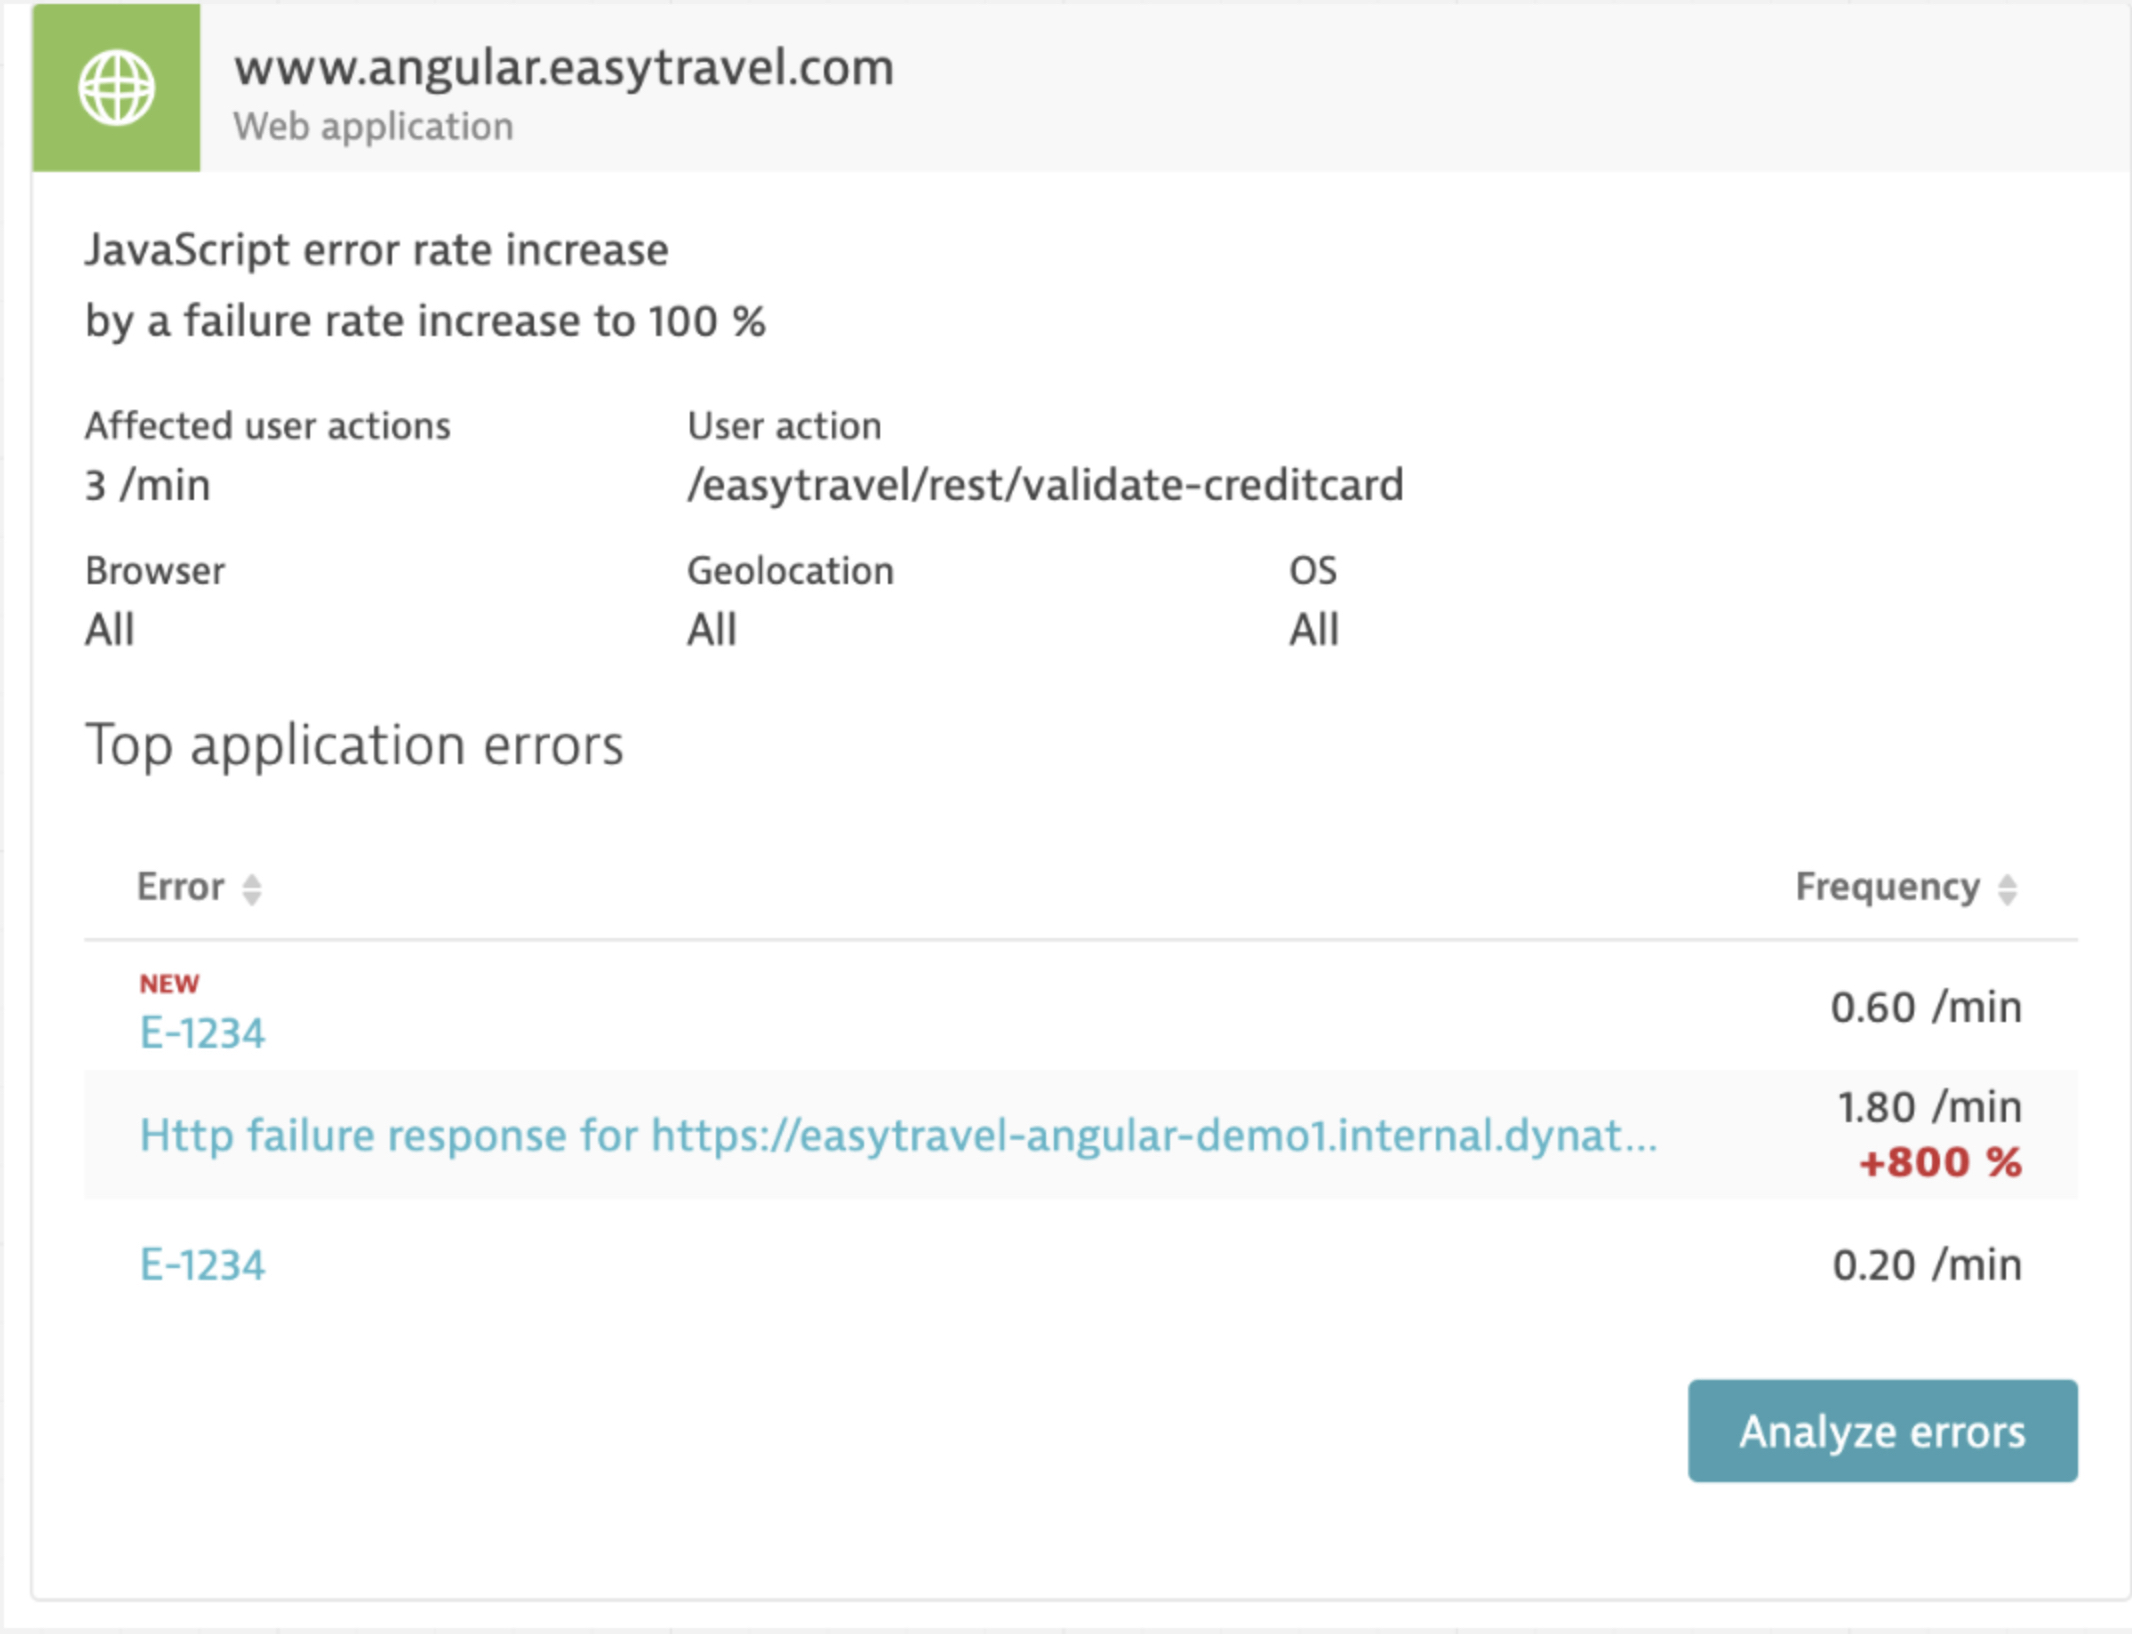
- Web error-rate increase troubleshooting: Looking for the errors that need to be assigned and subsequently fixed is time-consuming. Hence, the top errors can now be seen at a glance, and you can directly access the multidimensional analysis page by selecting the Analyze errors button. This enables you to quickly see the details of an error and spend more time solving the problem rather than looking for it.
How to get started
If you’re interested in seeing this in action, the good news is that most of this intelligence and analysis has been available since Dynatrace version 1.231; the root cause details and affected user ratios are available since Dynatrace version 1.238.
New to Dynatrace?
To learn more about how Dynatrace can help optimize your user experiences across mobile, web, IoT, and APIs, visit Dynatrace Digital Experience Monitoring (DEM) or sign up for a 15-day free trial.


Looking for answers?
Start a new discussion or ask for help in our Q&A forum.
Go to forum