Andi Grabner dives into how The Malaysian Administrative Modernisation and Management Planning Unit (MAMPU), has used Dynatrace to improve the digital experience of their users.
I was fortunate enough to get invited to our PerformGo! APAC Series. And while these events are a great opportunity for us Dynatracers to share our thoughts with our users, it’s also an amazing opportunity to for us to learn from our users about how they use Dynatrace to optimize digital experiences and digital operations in both the public and private sector.
In Kuala Lumpur, I got to listen to Zaiha Mat Nor, Deputy Directory at ICT, MAMPU. She was speaking about how her team is providing Visibility as a Service (VaaS) in order to continuously monitor and optimize their systems running across private and public cloud environments. Dynatrace and our local partners helped MAMPU to optimize the digital government experience on several dimensions:
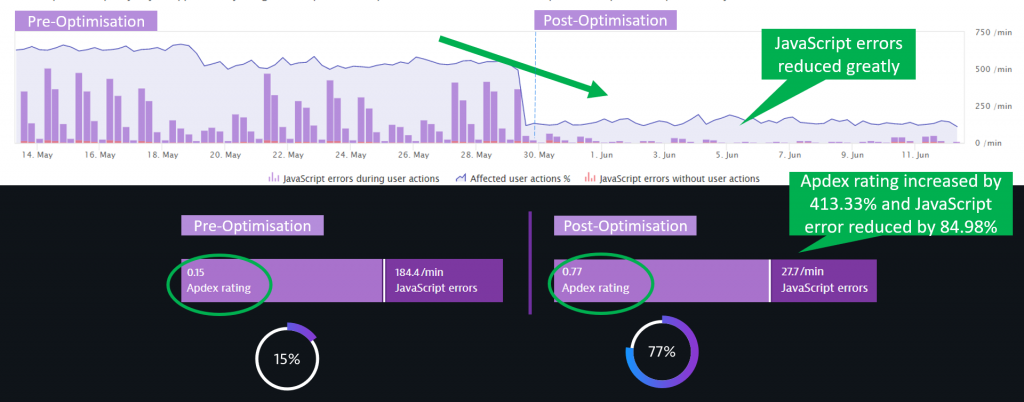
- Digital Experience: 413% improvement in APDEX, from 0.15 to 0.77.
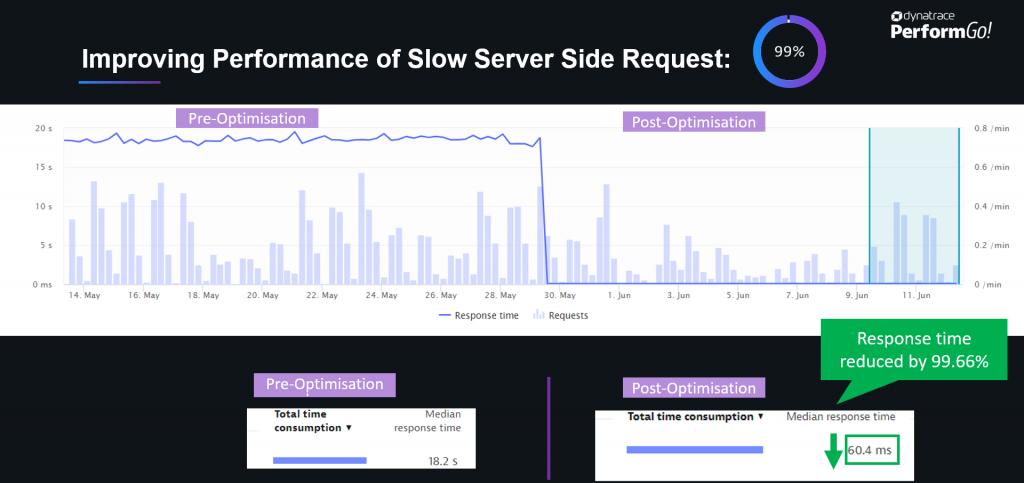
- Digital Performance: 99% reduction in Response Time, from 18.2s to 60ms in one of the more frequently used transactions.
- Infrastructure Optimization: 100% improvement in Database Connectivity.
These optimizations not only improved the overall digital experience for their Malaysian users but also led to a 68% adoption increase within nine months. The team also lowered the total cost of operations by reducing resource consumption, leading to a lower cost for both on-premise and cloud workloads:
- 66% reduction in memory utilization.
- Reducing CPU Utilization to now only consume 15% of initially provisioned hardware.
Let’s dig deeper into what they optimized, and let me give you some additional tips and tricks so that you can start optimizing your own digital full stack after installing Dynatrace.
If you don’t have Dynatrace, you can simply sign up for the Dynatrace Trial.
Digital Experience optimization
Dynatrace Real User Monitoring (RUM) captures very detailed user behavior, as well as experience and performance information, about every user on your applications. A well-established metric we provide is APDEX, which tell us how users are perceiving page load times (time to the first byte, page speed, speed index), errors (JavaScript errors, crashes,) and also factors in the overall user journey (each user interaction) including their environment (browser, geolocation, bandwidth).
The results for MAMPU speak for themselves; with the detailed Dynatrace RUM data, they were able to optimize web page load performance (reduce image and JavaScript sizes, leverage browser caching & CDNs), as well as reduce most of the JavaScript errors (updating broken libraries and fixing coding issues):

Impressive results I have to say!
You, my dear reader, can start optimizing your applications as well.
We have several YouTube Tutorials and blog posts available that show how you can use Dynatrace RUM data for Web Performance & User Experience Optimization. Here is one I would start with:
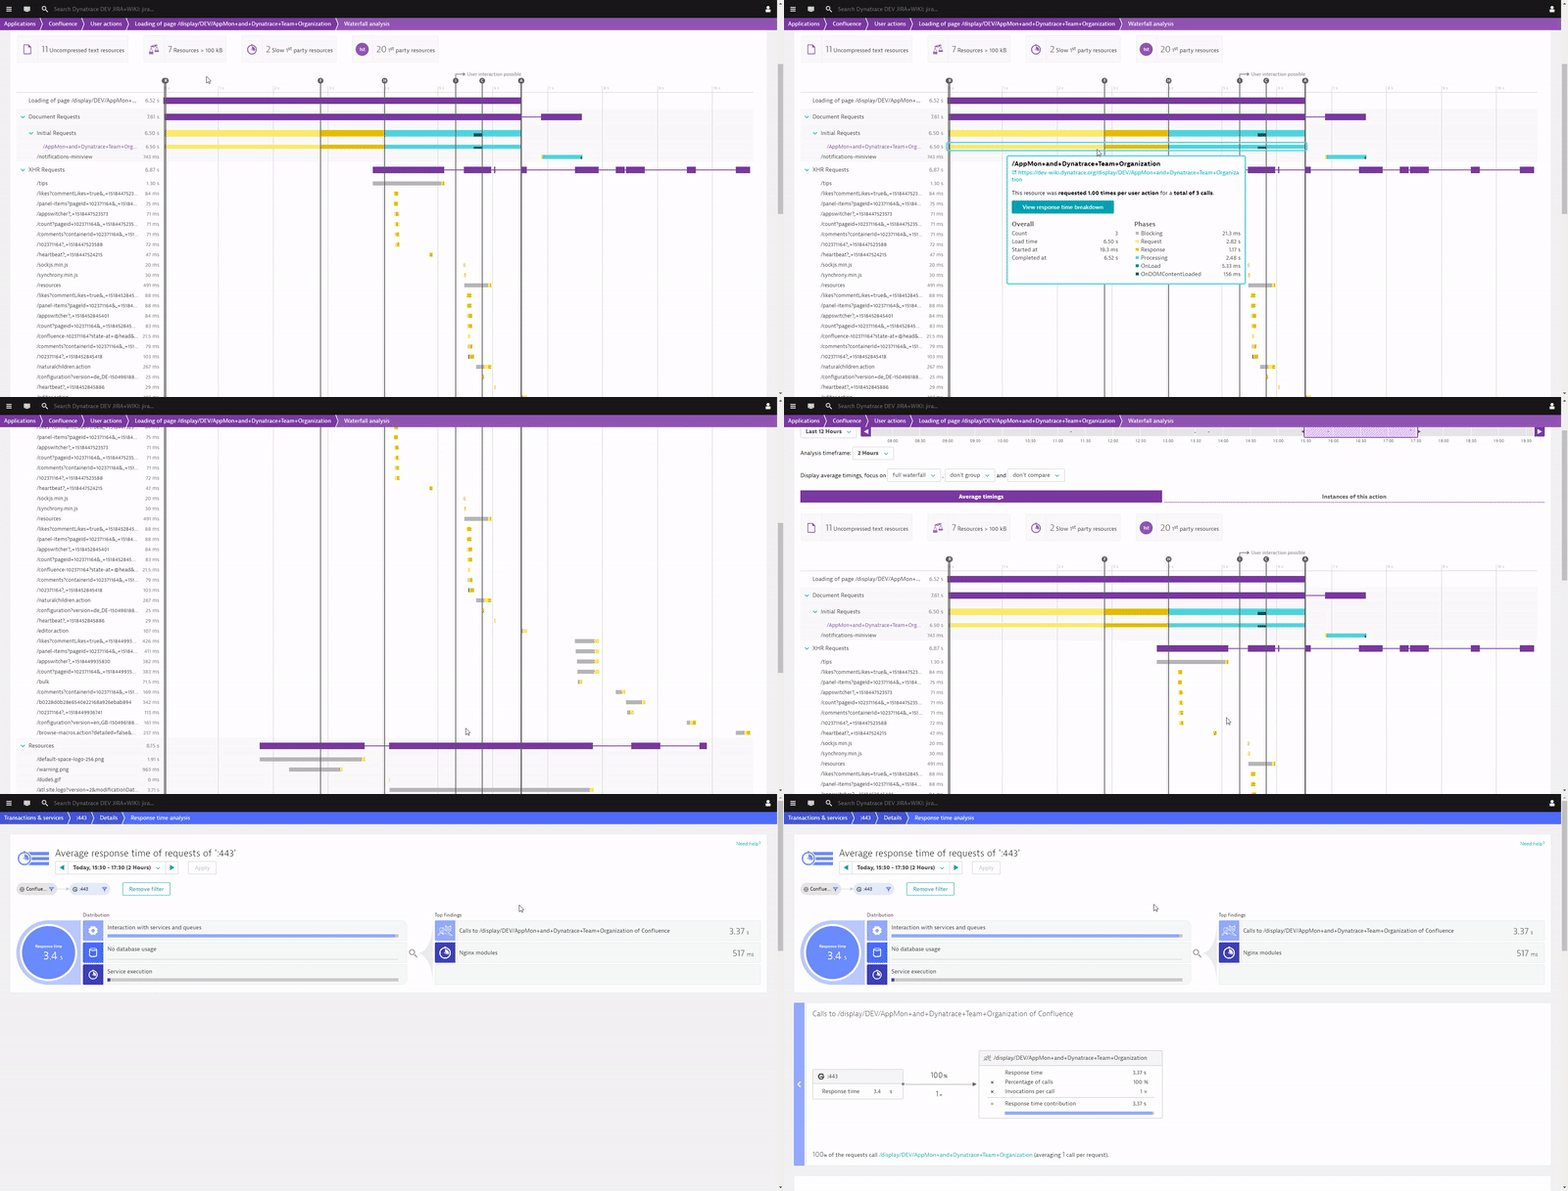
The foundation of all optimization work will be from the detailed technical data Dynatrace RUM captures, e.g. browser page load waterfalls for individuals or a group of users with all relevant W3C Navigation and Resource Timings. Dynatrace automatically highlights findings that are candidates for optimization such as:
- Too large resources (images, CSS or JavaScript) – Think about compressing images or using minified versions of JavaScript libraries and CSS files.
- Too many third party components – Evaluate whether you really need all these third party libraries of whether some are already obsolete or can be replaced with something better.
- Missing Cache Settings – Make sure you cache resources that don’t change often on the browser or use a CDN.
- JavaScript Errors – Fix JavaScript exception as they impact user experience.
Impacting Server-Side Requests: Dynatrace allows you to drill into your server-side requests to understand why your business logic is executing slow or fails.

There are a lot of things that can be optimized to make pages load faster. I’m sure your frontend developers already have their tools and techniques in place. If that’s the case, make sure to give them access to the Dynatrace RUM data so they can start optimizing based on actual page load waterfalls from your end-users and not just what they see on their laptops.
Digital Performance improvement
A big factor in good Digital Performance is the back-end system that powers your digitally offered use-cases.
Think of a user login which requires your back-end systems to validate user credentials and query required user profile information from the backend databases. Or think of requesting a new drivers license which requires your implementation to reach out to many dependent systems, e.g. DMV, police records that are needed to kick off the process of renewing or issuing a new license.
MAMPU showed their results when optimizing some of their critical end-to-end business transactions, which blew the audience away – as teams saw a 99% reduction in response time.

You may ask: How is this possible? How does someone end up with a system that has so much potential to be optimized? Well – there are many answers to this.
In most cases, I’ve seen it’s either through bad coding, incorrect use of data access frameworks, or simply architecture that has grown over the years into something that became overly complex in terms of participating components and services. And if you don’t constantly have an eye on it, it evolves into something very complex.
At our PerformGO! Singapore event last week, one of my colleagues showed a Dynatrace Service Flow for one of our customers, which consisted of 44 different layers of architecture that a single request had to travel through. That included web servers, app services, microservices, queues, databases, mainframe and external services. A highly distributed architecture like this has a lot of potential for performance and architectural hotspots. I assume most of you have distributed systems that are very complex. In order to understand, reduce and optimize your systems, I recommend you watch my presentation on Top Performance Challenges in Distributed Architectures, where I highlight the most common performance problems:
- Too many roundtrips between services, e.g. N+1 Query Pattern.
- Too much data requested from a database, e.g. Request all and filter in memory.
- Too many fine-grained services leading to network and communication overhead.
- Missing caching layers, e.g. provide a read-only cache for static data.
- Missing retry and failover implementations.
If you want to learn how you can use Dynatrace to identify these patterns in your architecture, check out the following YouTube Tutorials:
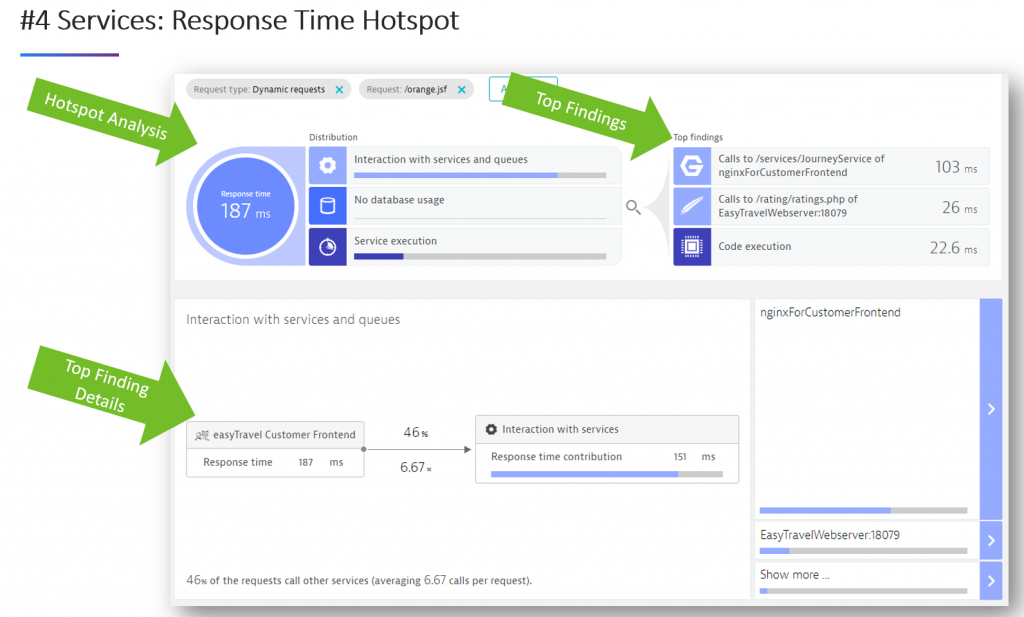
The below image is a screenshot taken from my Advanced Diagnostics YouTube tutorial, showing how Dynatrace automates the analysis of service and service-2-service hotspots, e.g. looking at where most of the time is spent within a service, and what are the communication hotspots between services:

Once you dig into the diagnostics data of Dynatrace, you’ll be surprised at how much potential for improvement you find. Besides what I just listed, there are other areas around optimizing memory, CPU and thread utilization as well as eliminating unnecessary exception handling.
If you have any questions on data that Dynatrace shows you, feel free to reach out. Myself and fellow Dynatracers are always happy to help analyze performance data, as there is typically always something new in there for us to learn as well!
Infrastructure Optimization
Infrastructure issues can either arise out of problems in the infrastructure, e.g. not enough bandwidth, full disk, network routing issues or a result of incorrect or inefficient usage of the available infrastructure by the application, e.g. sending uncompressed data, logging too much data or connecting to systems that are not accessible.
MAMPU showed two great examples for this section; database connectivity and web-server threats.
Starting with database connectivity, one of their applications experienced database connection failures that grew with load throughout each day. After taking a closer look, the teams found that they could eliminate all database connection issues by optimizing connection pool sizes and application code to only hold onto open connections as long as really needed to, and not for the entirety of the end-users’ request:

The second example was around web-server threads, which turned out that the team ran with default settings for Apache (200 worker threads) which was too low for the traffic the government agencies are receiving during business hours. Dynatrace gave them automated insights into traffic behavior and the impact of queued up requests to the end-users (up to 3s queue time). With that, they were able to adjust the worker thread pool size to 500 which is enough for their expected workloads. All this was made possible without any need for hardware upgrades:

If you want to learn more about this check out the tutorials on Advanced Diagnostics where I also talk about Database Diagnostics.
Benefits: Increased user adoption
We have several studies from Google, Facebook & Co that show that faster services and apps ultimately lead to increased user adoption. The same is true for governmental services as the following numbers from MAMPU confirm:

Benefits: Cost savings and an easier path to the Cloud
These optimizations are ideal win-win situations; they not only benefit the citizens of Malaysia, by providing rapid access to online governmental services with the digital performance experience they deserve, but the other bonus is cost savings from efficient use of resources. The following graph shows they now run both app and web server with about 6.3GB of Memory – nowhere close to the 20GB of memory they initially provisioned in order to keep the servers running:

A reduced resource footprint also makes migrating to a public cloud more cost-efficient. I’ve been advising for optimizing first, then migrating, over the past few years. And this use case from MAMPU is a testimonial to this approach, as moving a smaller and optimized system can be done faster and operated with reduced costs.
Start your own digital optimization
Thank you to MAMPU for sharing this story with the rest of Dynatrace community. I hope it inspires others to share their lessons learned as well.
Try it yourself
If you haven’t started your optimization journey yet, then get your Dynatrace Trial within minutes.


Looking for answers?
Start a new discussion or ask for help in our Q&A forum.
Go to forum