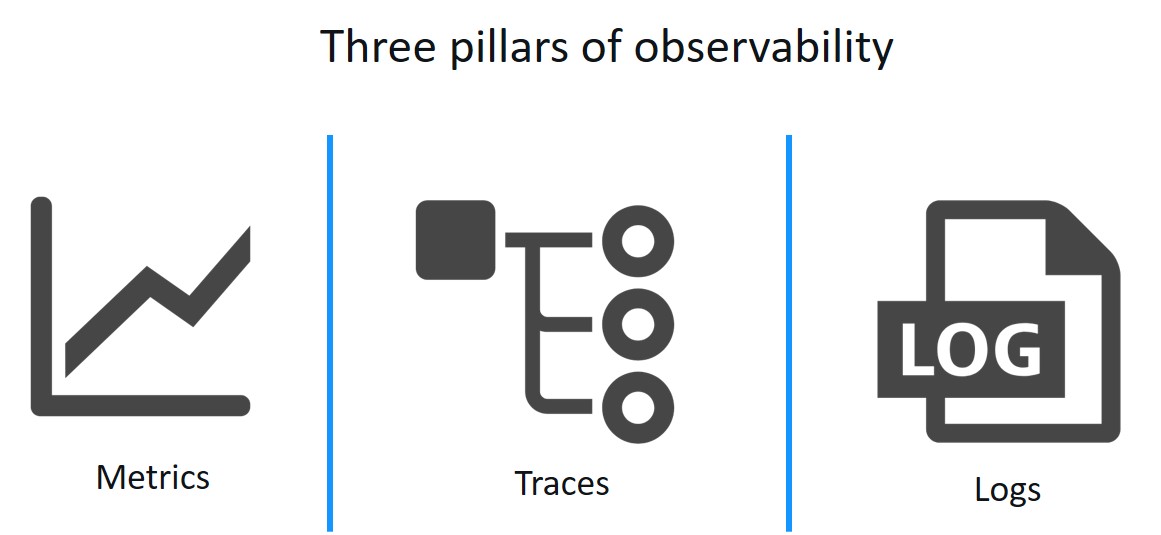
In software, observability refers to telemetry produced by services. Observability is divided into three major verticals—metrics, logs, and distributed traces—the so-called three pillars of observability. Thanks to projects such as OpenTelemetry, which promotes the standardization of data collection, and W3C trace-context, built-in telemetry will soon become a must-have feature of cloud-native software.
Here’s how Dynatrace uses the three pillars of observability in context for automatic problem detection and root-cause analysis.
The three pillars of observability—captured automatically, no code change required
With Dynatrace, you just install a single agent per monitored host to collect all relevant data with high fidelity. Dynatrace OneAgent discovers all the processes you have running on a host, including dynamic microservices running inside containers. Based on what it finds, OneAgent automatically activates instrumentation specifically for your stack. New components are auto-instrumented on the fly, with no code change required.
1) Metrics
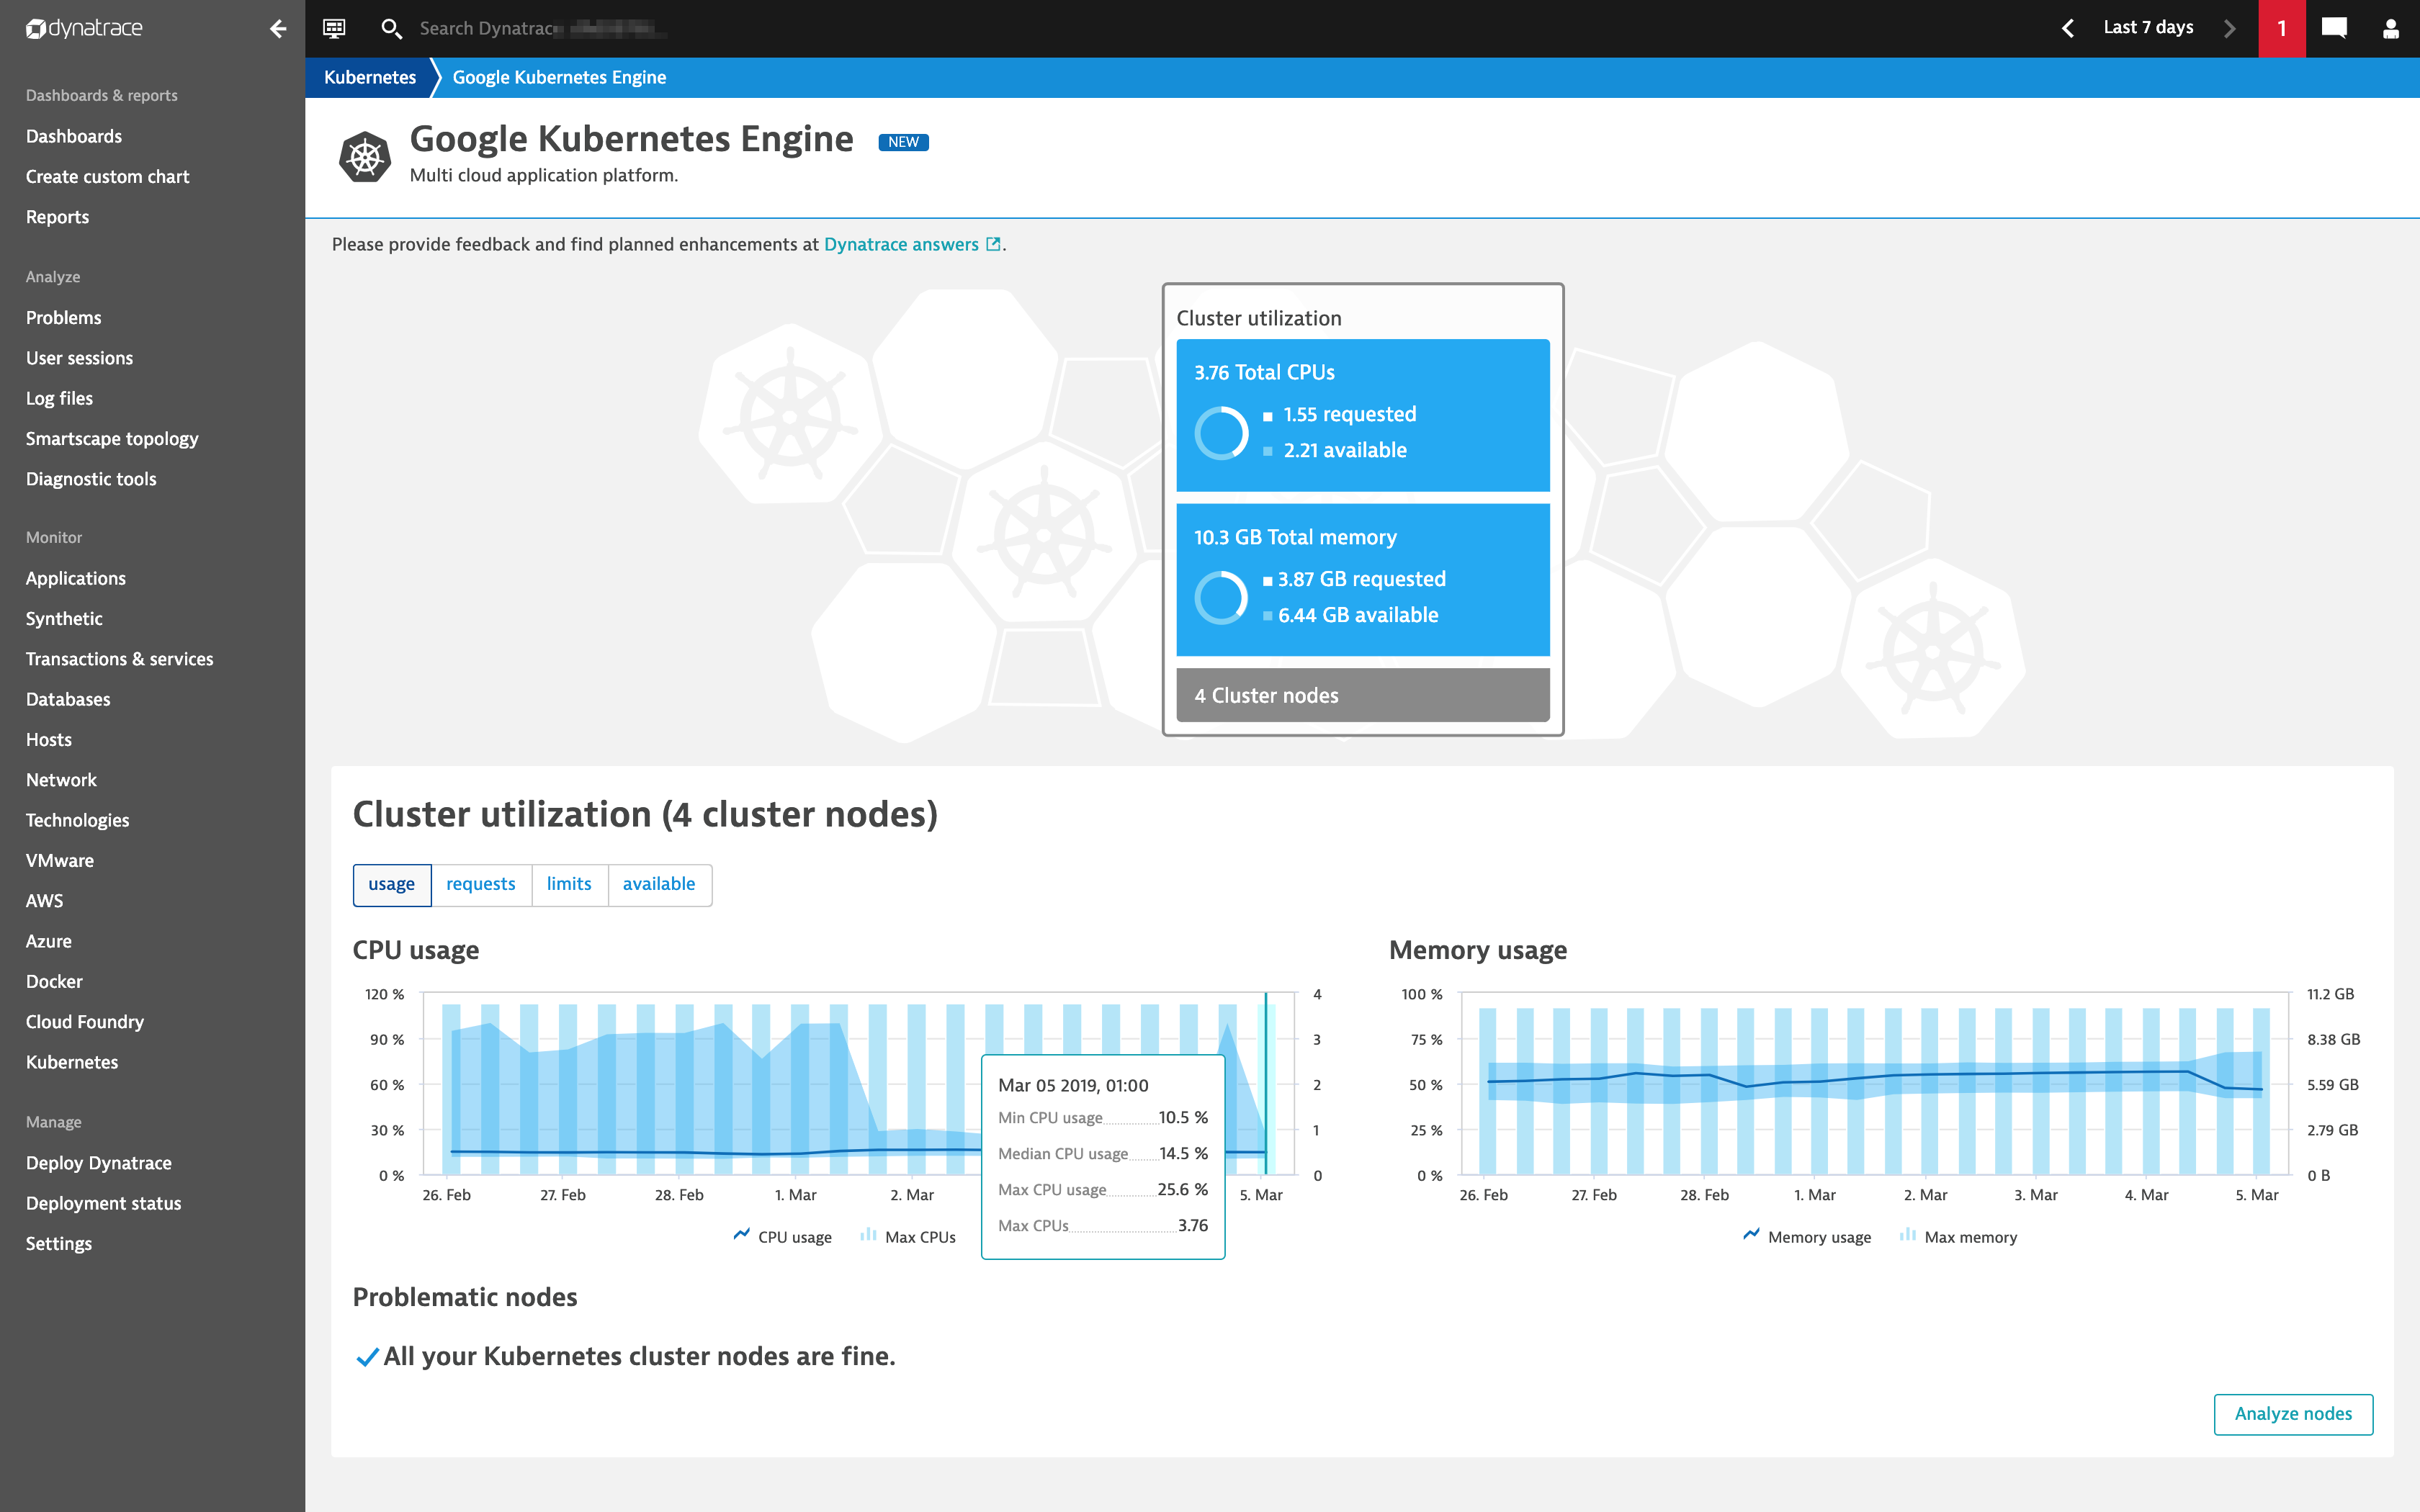
As a full-stack monitoring platform, Dynatrace collects a huge number of metrics for each OneAgent-monitored host in your environment. Depending on the types of technologies you’re running on your hosts, the average number of metrics is about 500 per computational node.
Besides all the metrics that originate from your hosts, Dynatrace also collects all the important key performance metrics for services and real-user monitored applications, as well as cloud platform metrics from AWS, Azure, Kubernetes, and Cloud Foundry. All told, thousands of metric types can be charted, analyzed, and used for alerting in your Dynatrace environment.
2) Distributed traces
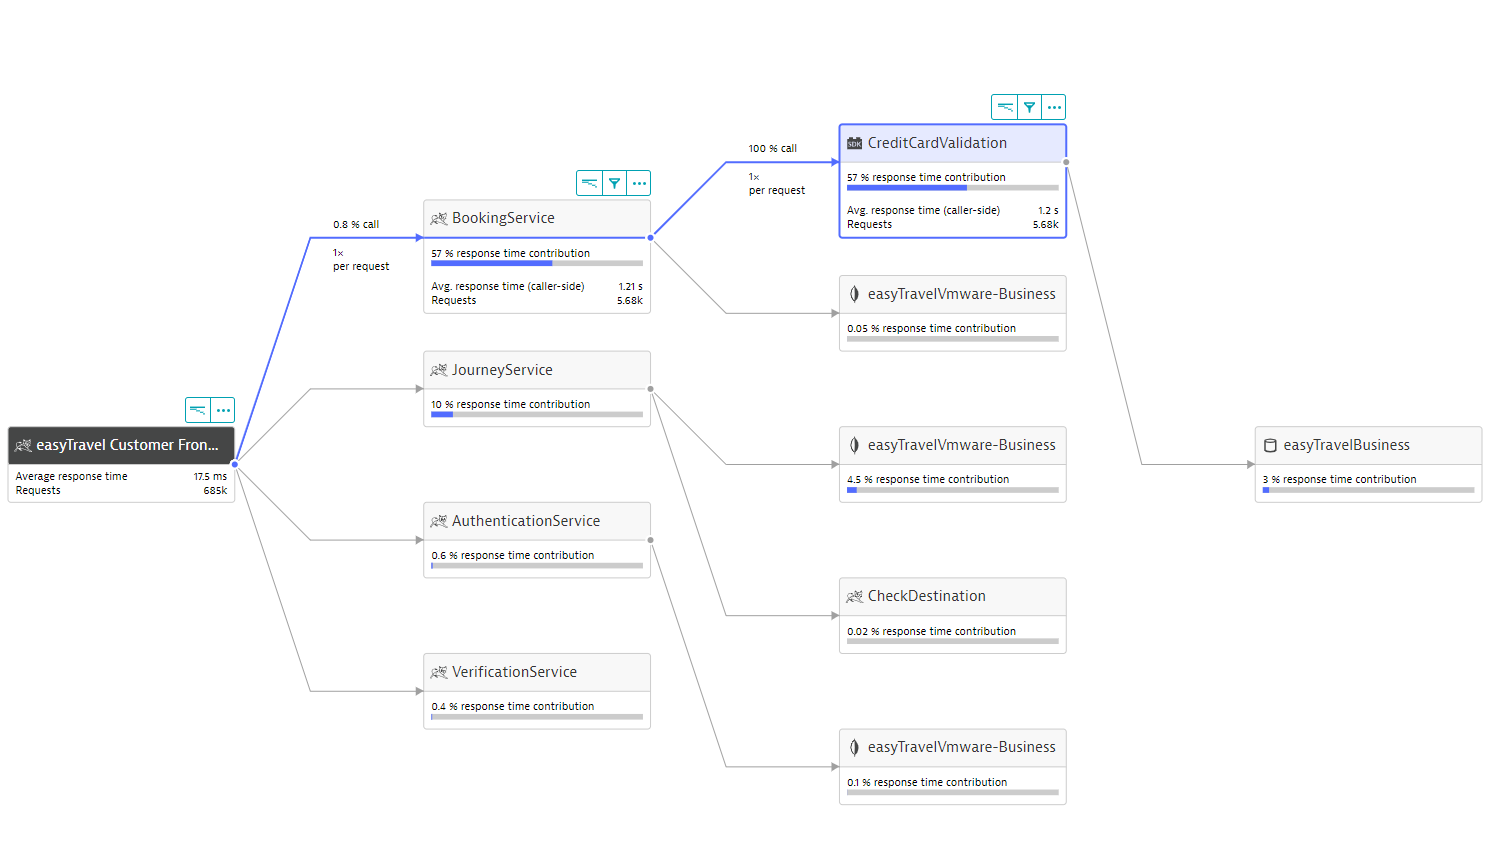
With a microservices environment, you can have dozens, if not hundreds, of services calling one another. Distributed tracing is used to understand how all those different services connect together and how your requests flow through them. The Dynatrace service flow is generated automatically from distributed traces.
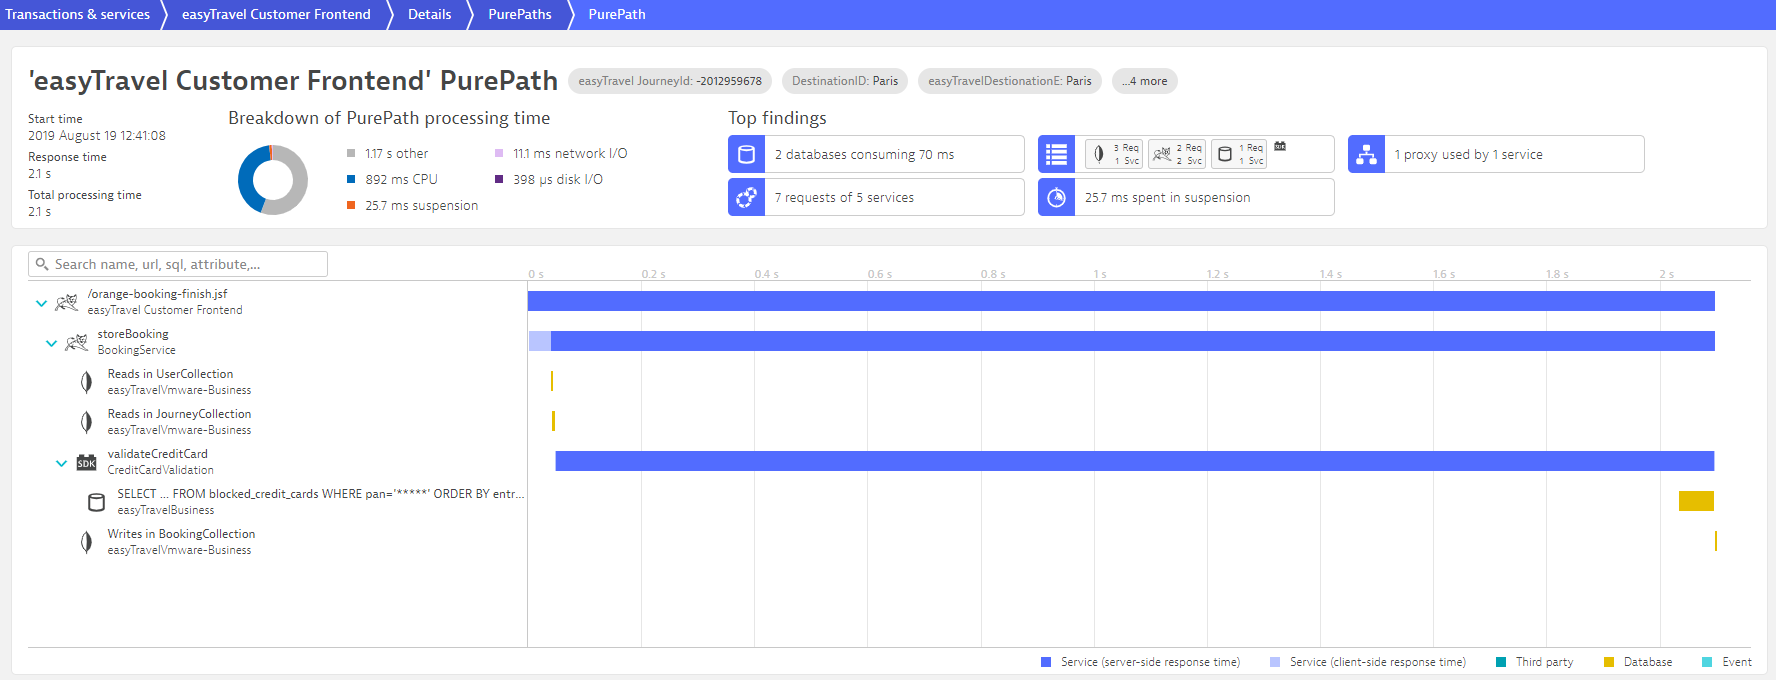
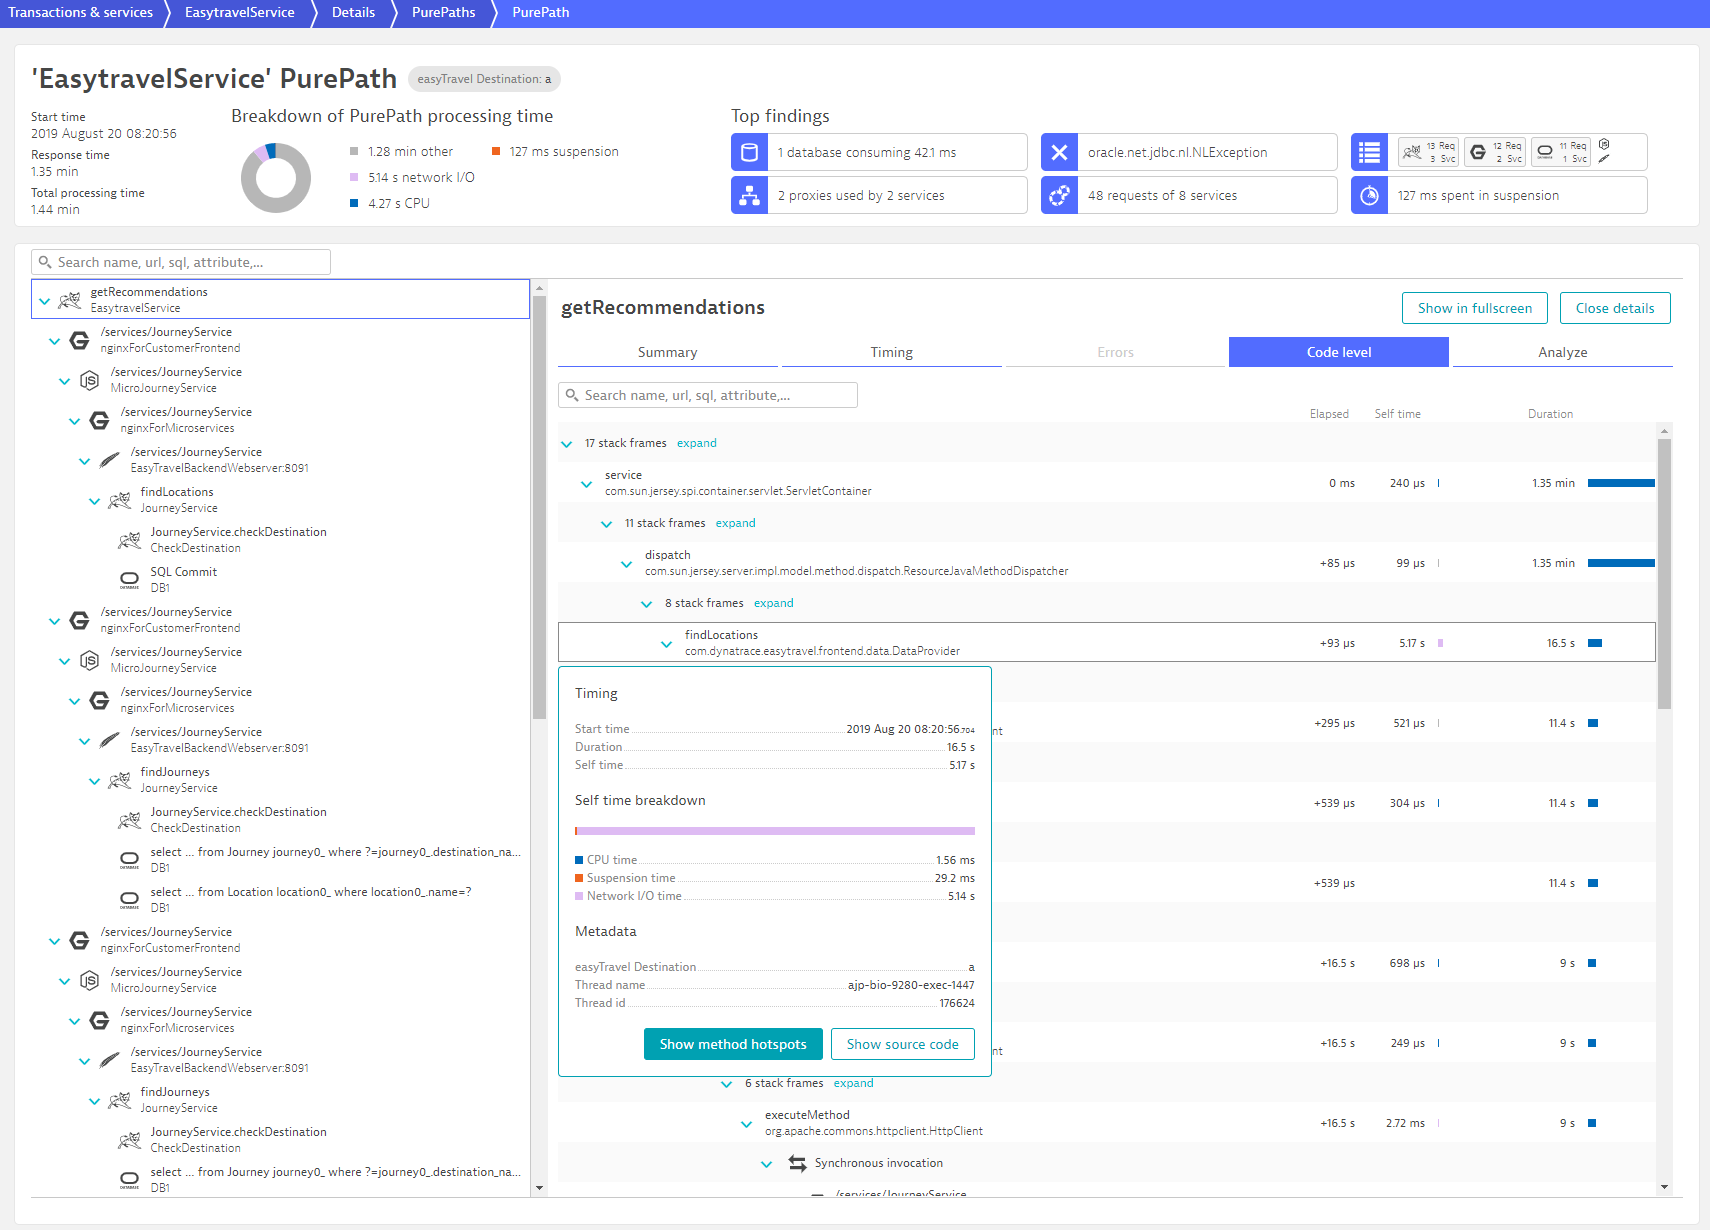
Distributed tracing, with no code changes required, has been a core component of Dynatrace from the very beginning. Our version of a distributed trace, Dynatrace PurePath, does even more as we not only capture tracing information but also code-level data.
Distributed traces are extended with code-level execution trees that include useful information such as CPU time, suspension time, and network I/O time.
Distributed tracing helps to rapidly localize the service that’s causing the issue. But distributed tracing won’t help you dig deeper into the code to get more details. For that, you need code-level visibility and CPU profiling. Additionally, OneAgent also captures information about background and service activity for CPU analysis and method hotspots. This is all done with OneAgent auto-instrumentation—no code changes are required.
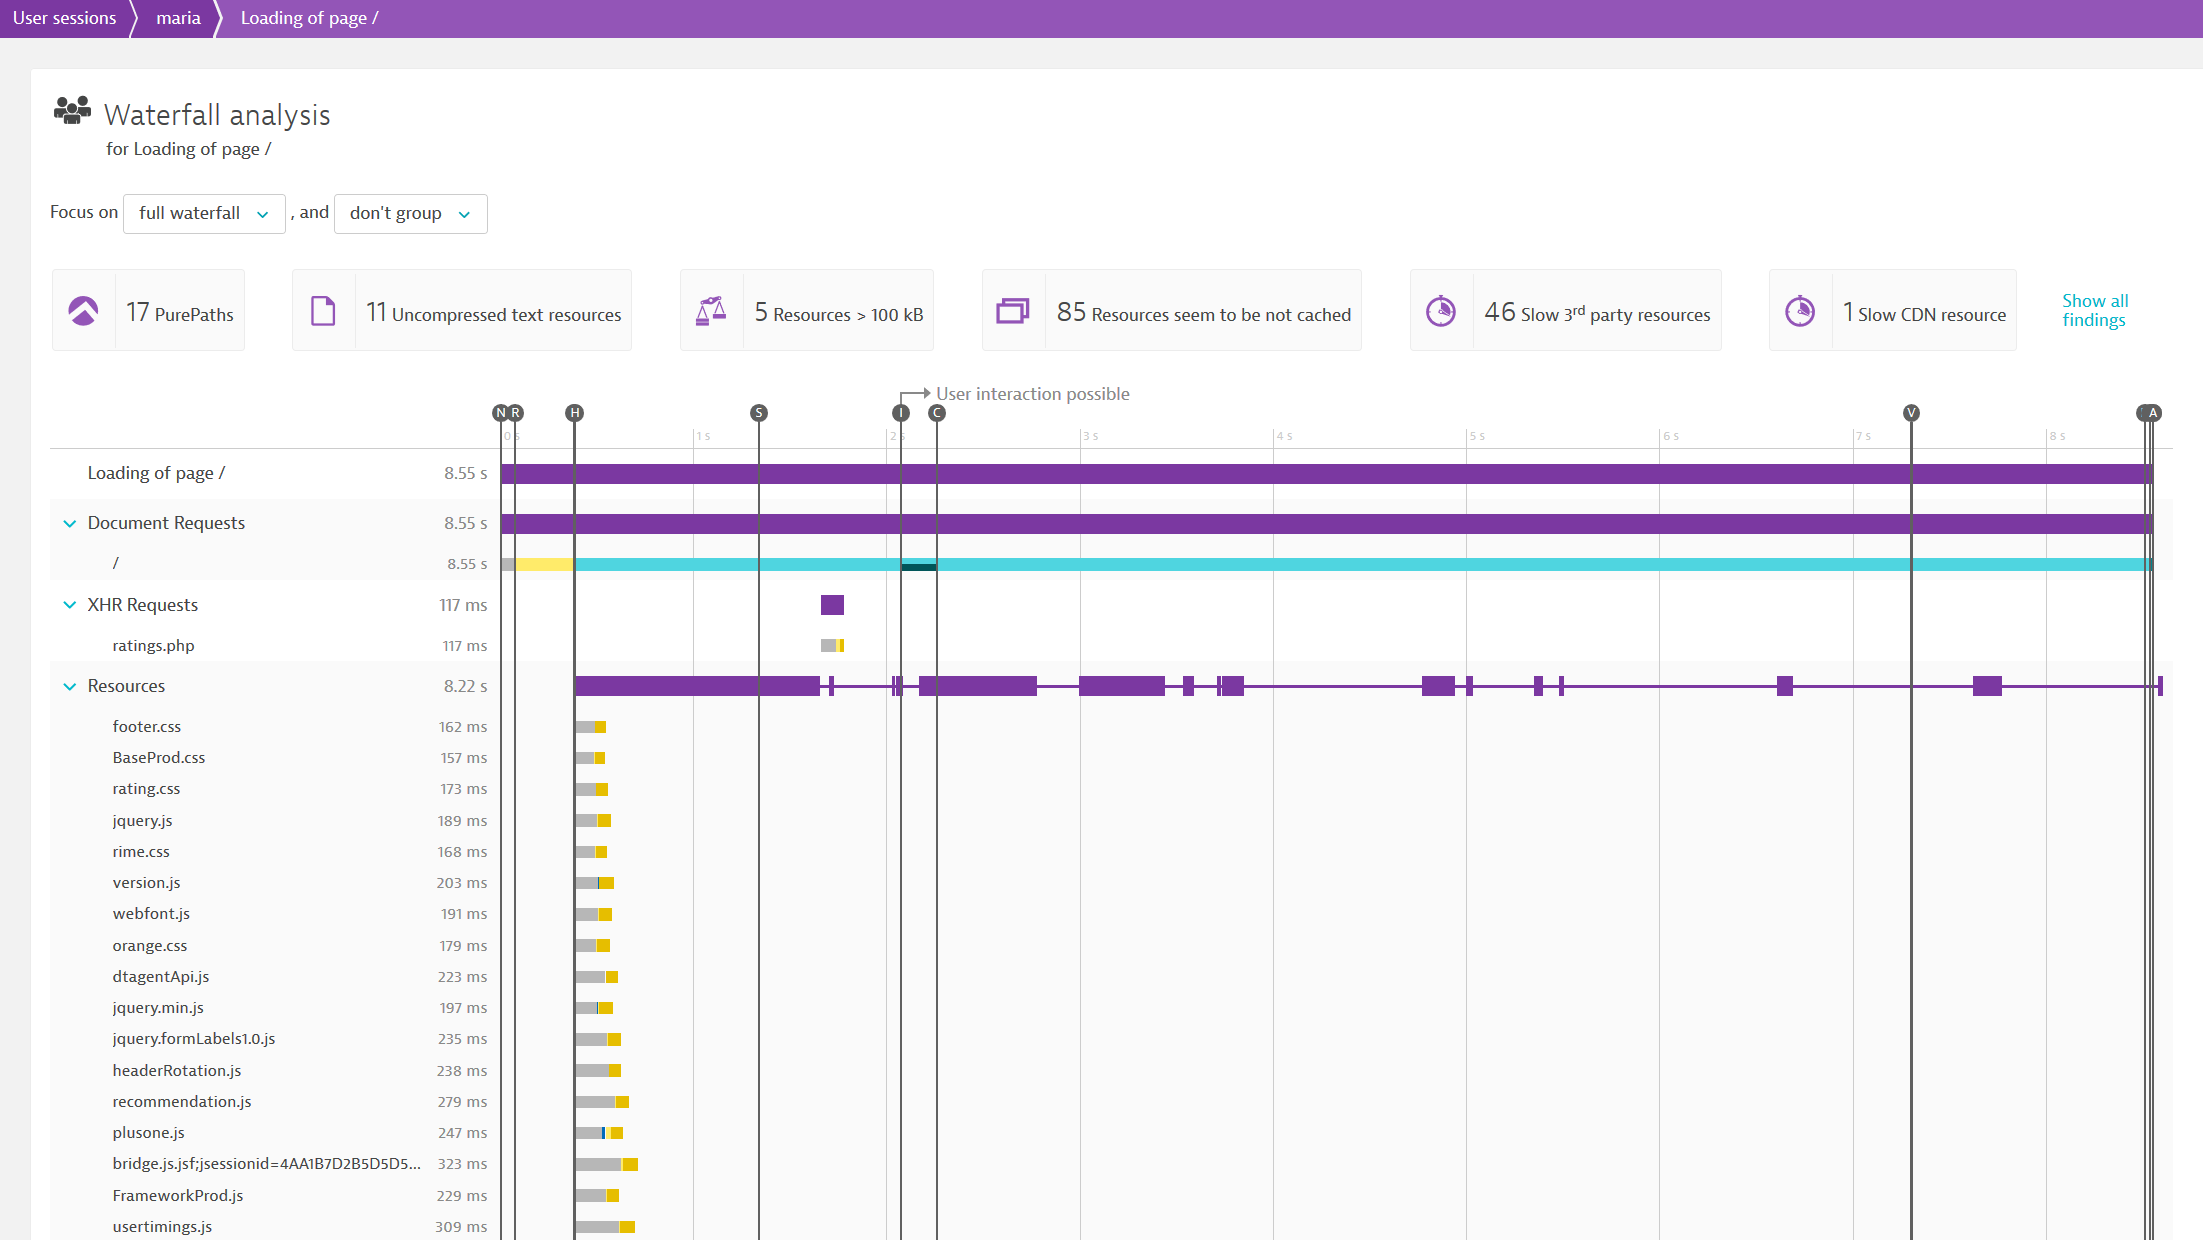
While people tend to focus on backend services when discussing tracing, there is great value in starting traces on the client side (in the browser, mobile app or any custom application). Dynatrace Real User Monitoring automatically captures full user sessions, providing you with complete visibility into the customer experience across every digital touchpoint.
As the popularity of distributed tracing is growing, it makes sense for the industry and community to standardize some of its aspects. So we’re leading the effort in the W3C distributed tracing working group. Take a look at my blog post on W3C Trace Context to learn more.
Also be sure to register for our online performance clinic about distributed tracing on September 18, 2019.
3) Logs
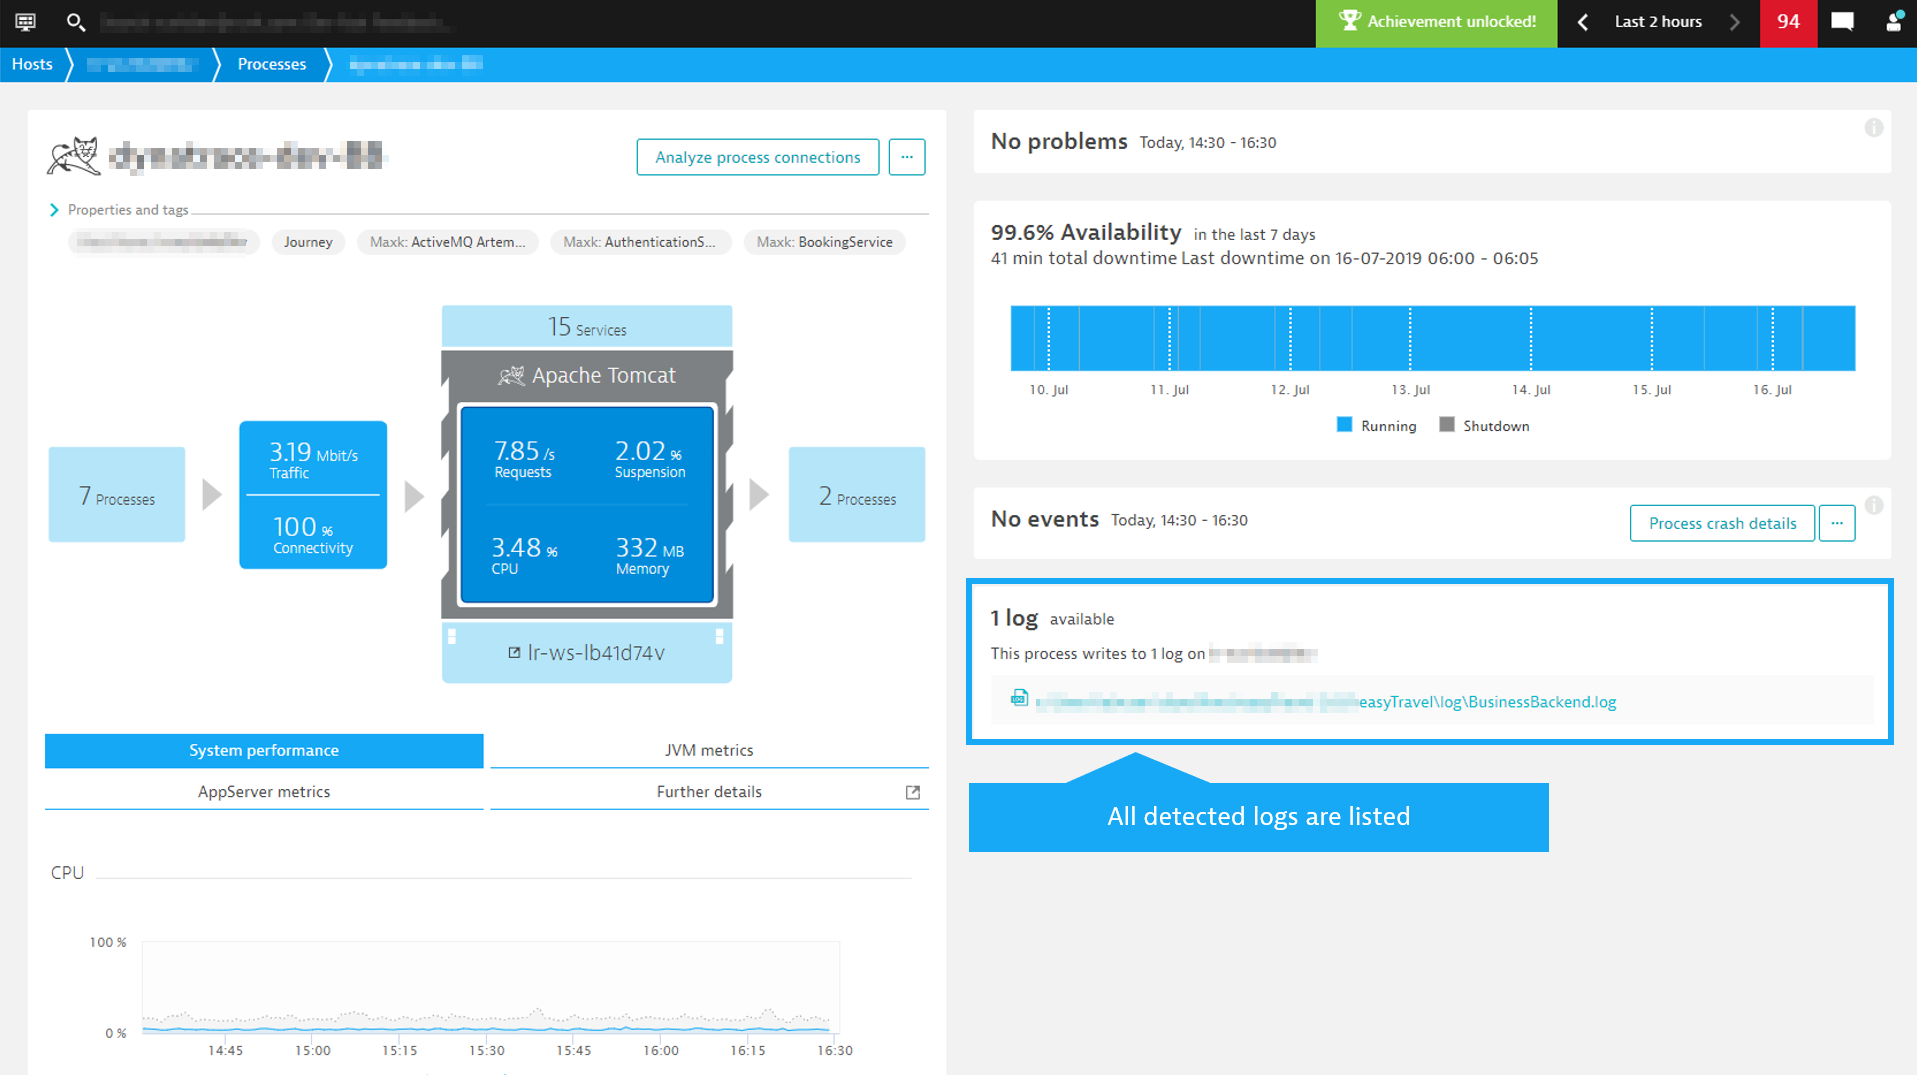
OneAgent automatically detects log files and puts them in context with the corresponding host or process with no manual configuration. All detected log files are listed on the corresponding process group/process or host overview pages. For details, see log detection and supported log formats.
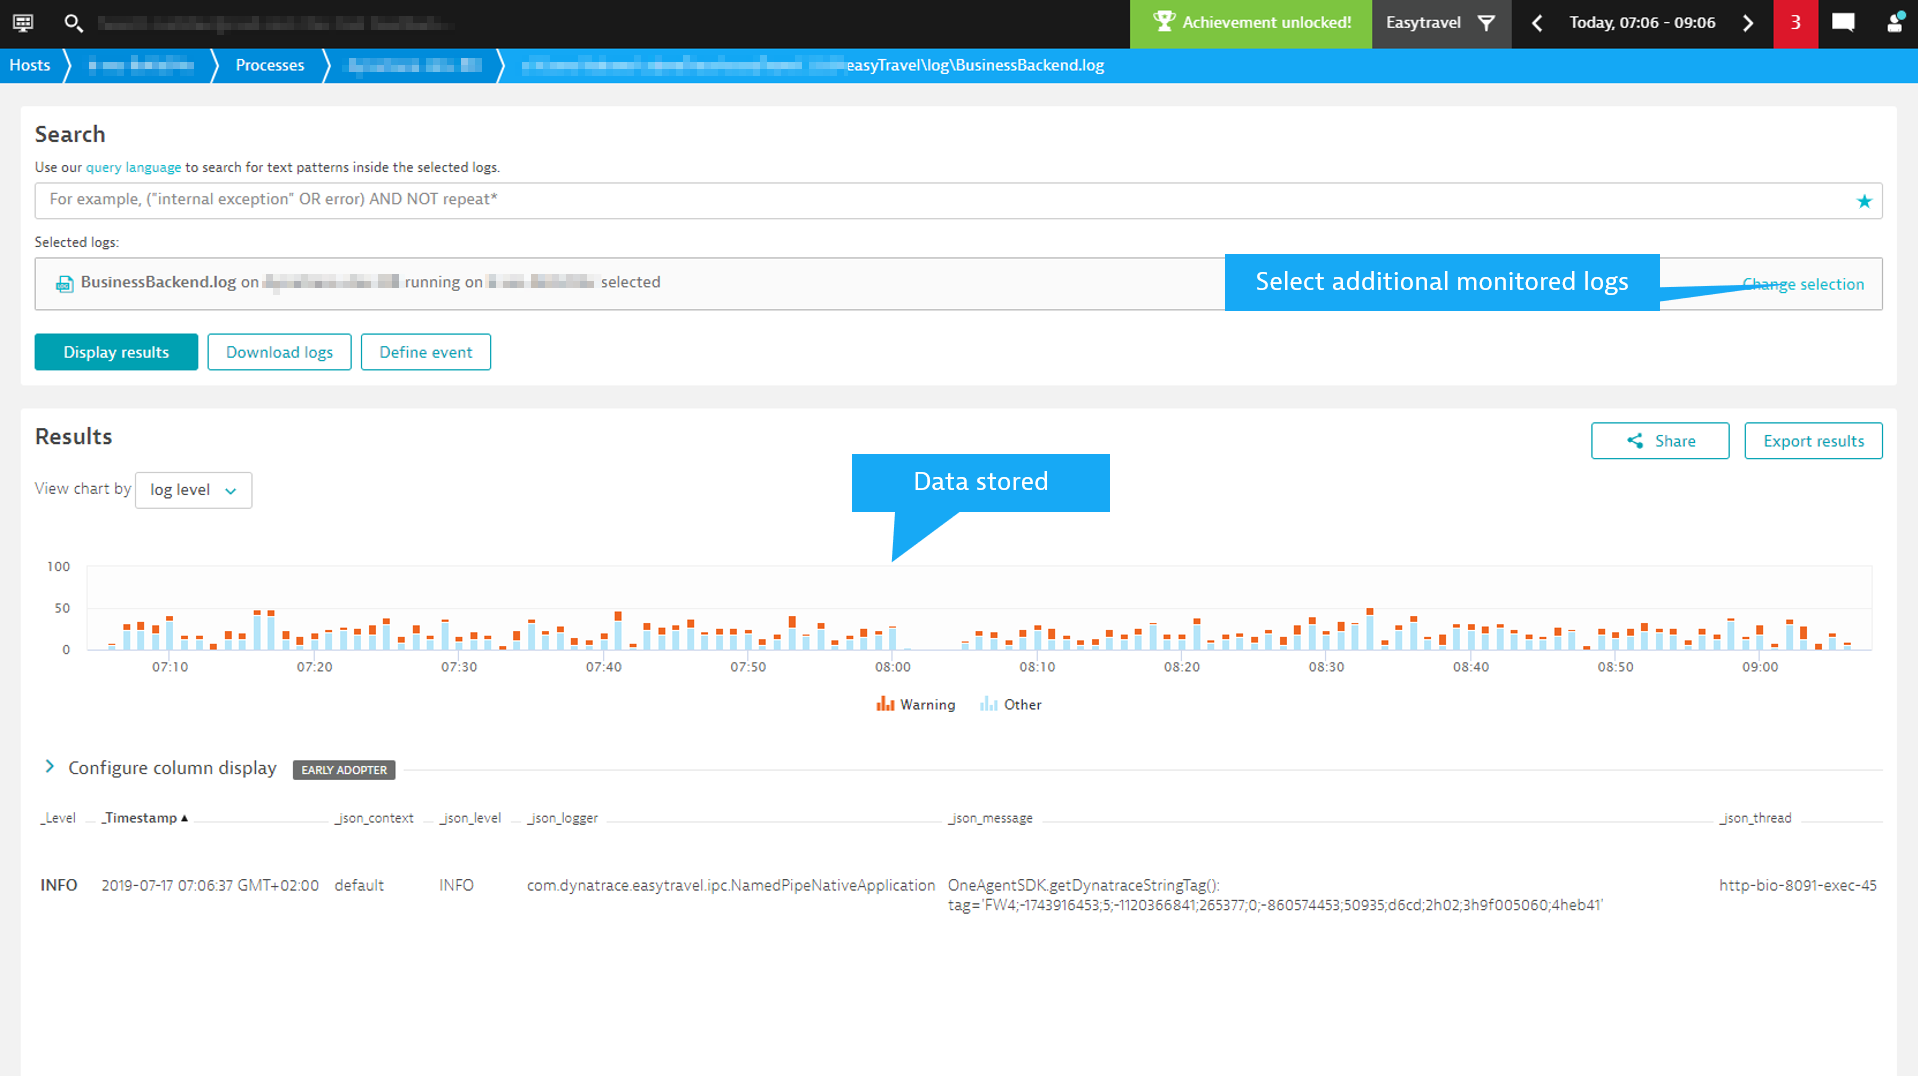
You can search for text patterns across multiple monitored logs and also for alerts that are based on occurrences of those text patterns.
In upcoming releases of Dynatrace Log Monitoring, we’ll also provide the ability to subscribe to custom metrics based on monitored log files.
Avoid data silos: Context matters
Capturing observability data is good. It’s even better when it’s done automatically, without code changes or cumbersome configuration, as OneAgent does. However, too often, metrics, traces, and logs are treated as data silos, with no relationships between them and aggregated in meaningless ways.
But what is the point of capturing and reporting metrics, logs, and traces? Looking at metrics, logs, or traces alone, without meaningful relationships between the pillars, is useless for root-cause analysis in highly dynamic and complex environments.
With silos, you might get an alert for an increase in the failure rate of service A. And then get an alert because process B has an increase in CPU usage. But you won’t know if these two alerts are related and how your users may be impacted by them. You need to dig deeper, but you’re looking for only a few traces amongst billions that document the issue. Good luck finding the needle in the haystack!
The secret? Real-time topology discovery and dependency mapping for precise answers
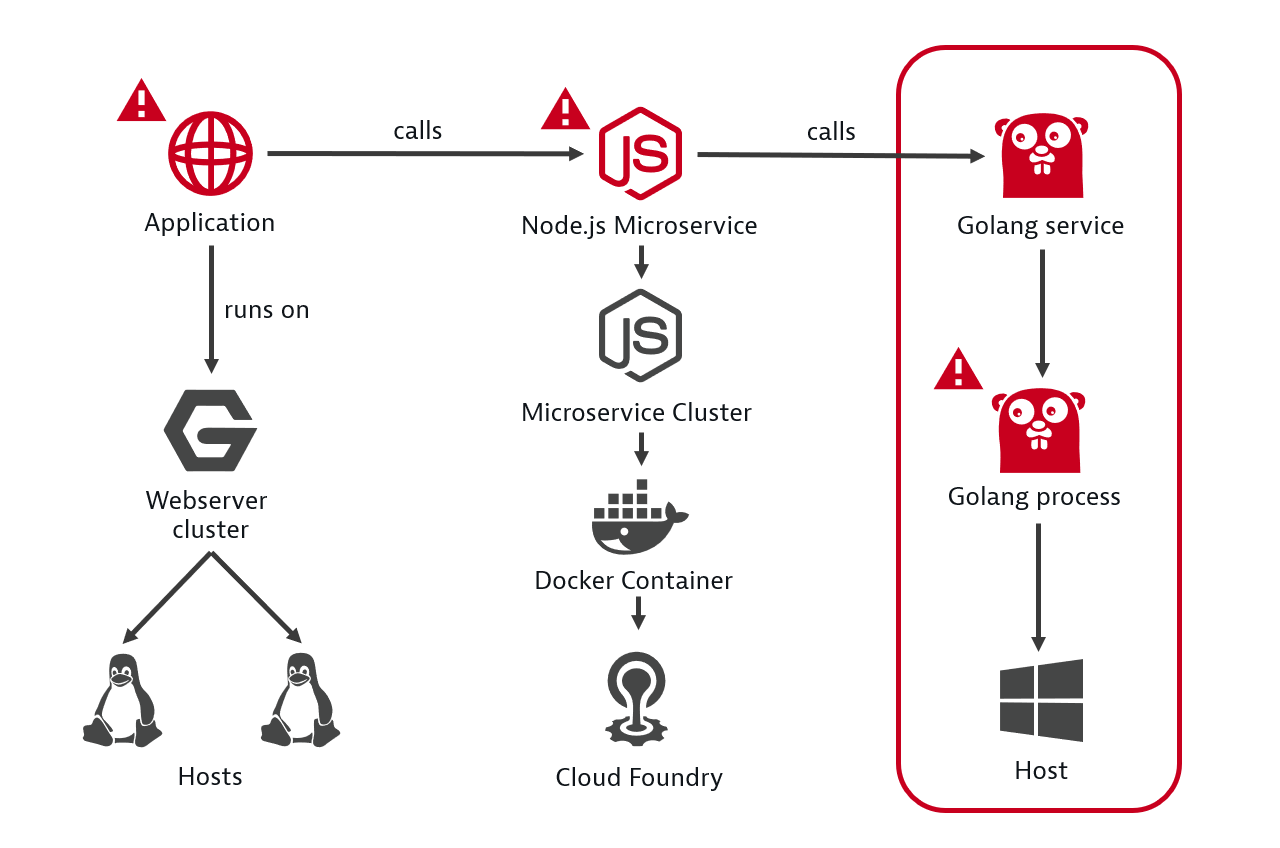
Dynatrace is radically different. With Smartscape, Dynatrace continuously and automatically maps data into a real-time dependency map that shows the relationships and dependencies for all entities, both vertically up and down the stack and horizontally between services, processes, and hosts. All captured traces, metrics, and log files are automatically mapped to the monitored entities they relate to.
By automatically analyzing the dependencies among components, Dynatrace identifies not just if a problematic service is the root cause of a problem, but also its dependencies on other services that run within different process groups in your data center.
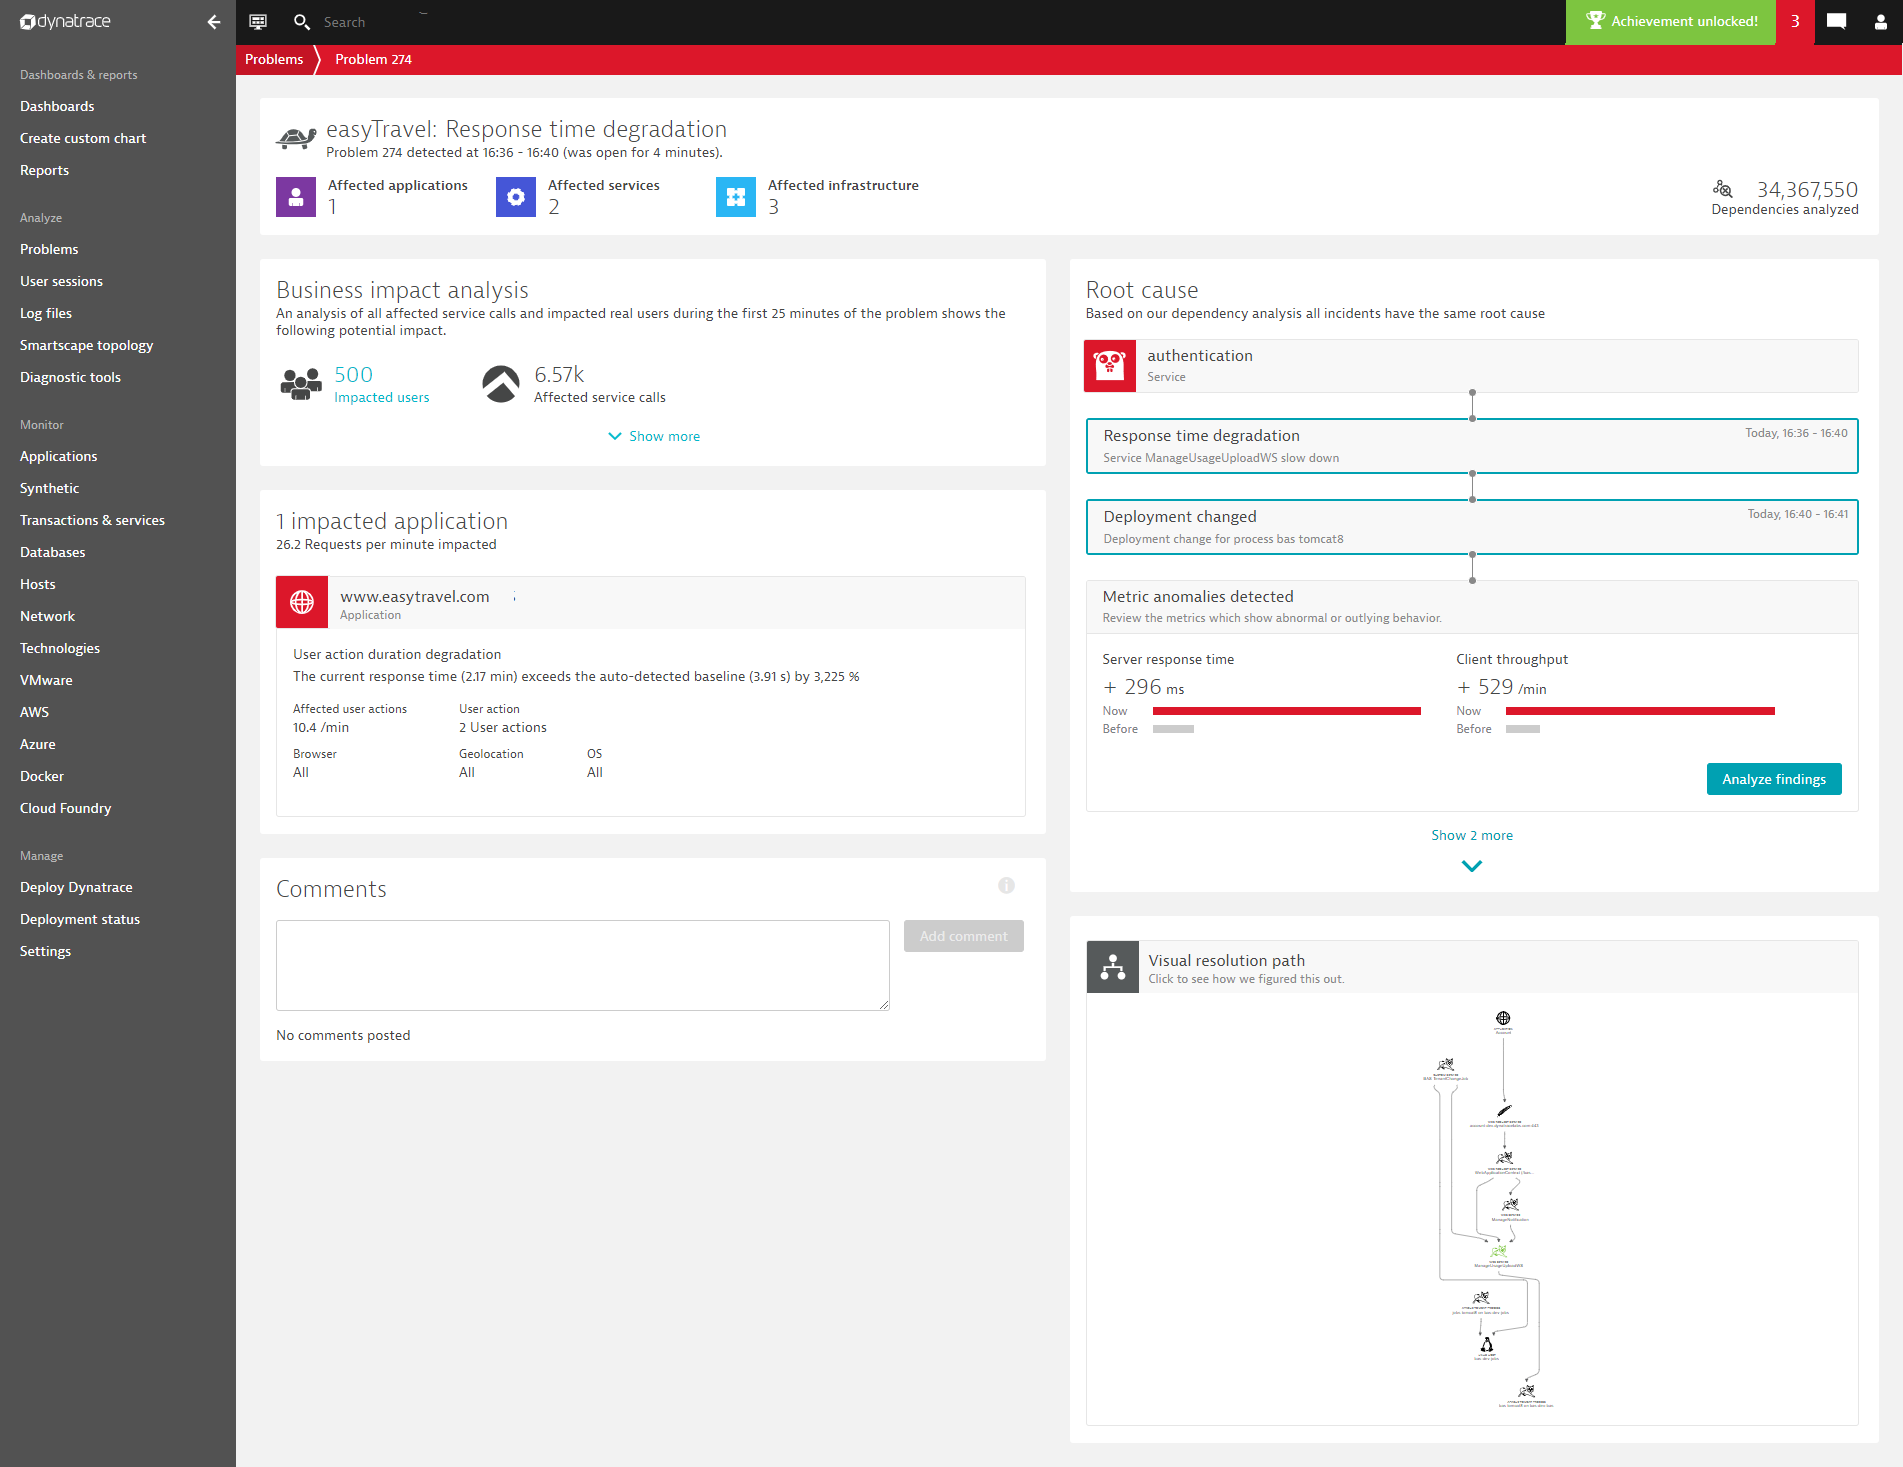
In the example below, Dynatrace AI automatically follows and evaluates the health of each relevant back-end service within the transaction and finally identifies a Golang service as the root cause.
As a result, Dynatrace AI presents the complete, vertical technology stack of the Golang service in the Root cause section of the problem details page (see below) and highlights all the relevant findings. With one click, you can then dive deep into the affected metrics, traces, and log files to analyze and fix the issue.
What can really ruin your business are the unknown unknowns. These are the things you aren’t aware of, don’t understand, and don’t monitor. Dynatrace automatically monitors for the unknown unknowns in your environment. We auto-instrument, capture high-fidelity data, and provide full-stack real-time dependency maps to enable instant, precise, AI-powered answers, not just correlations.
Finally, get the answers you deserve with Dynatrace!
What about OpenTelemetry?
OpenTelemetry is the next major version of the OpenTracing and OpenCensus projects. The community (Dynatrace included!) is currently working on the first production-ready release of OpenTelemetry.
Dynatrace will unlock the potential of OpenTelemetry traces and metrics (logging won’t be available initially in OpenTelemetry) in web-scale environments for effective and automated insights, including problem detection and root-cause analysis.
I’ll share more details about our work in the coming weeks, so stay tuned!
What’s next?
Join us for our upcoming performance clinic to learn more about distributed tracing with Dynatrace.
My next blog post will provide more details about our upcoming support for OpenTelemetry. If you’re a Dynatrace customer who’s using OpenTracing or OpenCensus, we invite you to reach out to us to discuss the details of our OpenTelemetry strategy.
Do you want to get the answers you deserve?
Then start your free trial and get ready to see how Dynatrace uses the three pillars of observability for automatic problem detection and root-cause analysis.





Looking for answers?
Start a new discussion or ask for help in our Q&A forum.
Go to forum