Failure detection with services
When I work with customers, I usually get their requirements to alert on failures. This is especially true when Dynatrace replaces an older generation of monitoring software. Typically, these products rely on hand-crafted rules from error logs. It is time-consuming and only works by highlighting what people are expecting to go wrong.
For instance, alert me when an error 999 is detected in application server logs or any HTTP 500 error from the web server access log. Dynatrace is far cleverer on how it detects failures and does it automatically! Once the failure is detected, Davis® our artificial intelligence engine will decide whether the issue should be reported or not. Automatic failure detection works well in most cases especially for web services and when developers follow good coding practices.
Dynatrace will report failures when the following criteria are detected:
- Any HTTP 5xx error
- Uncaught exceptions
You may wonder what an uncaught exception is? It is basically an exception which the code doesn’t expect to occur and therefore doesn’t deal with.
For instance, if I expect a “dataValidationException”, the code would look like this:
Try
{
# Code
....
}
Catch dataValidationException()
{
   # deal with the issue gracefully because it isn’t a problem after all.
   ...
}
If the code triggers an unexpected “connectionTimeOutException”, there is no “catch” so the application server will catch it and return an HTTP error. So, what does it means for you?
Typically, when things go badly wrong, unexpected exceptions are triggered and they won’t be caught by the code so Dynatrace will detect them.
This means that all the real failures (i.e. not data errors) will be picked up automatically.
How to fine-tune failure detection
Unfortunately, in the real world, things are not always so simple. However, this is not an issue as Dynatrace can be configured to change the way it detects failures!
Ignore noisy exceptions
Here is an example where a service constantly reports many failures with the out of the box settings.
The error rate is around 50%. In red, we can see the number of requests where the failure has been reported against the total in blue. The line chart shows the failure rate percentage.
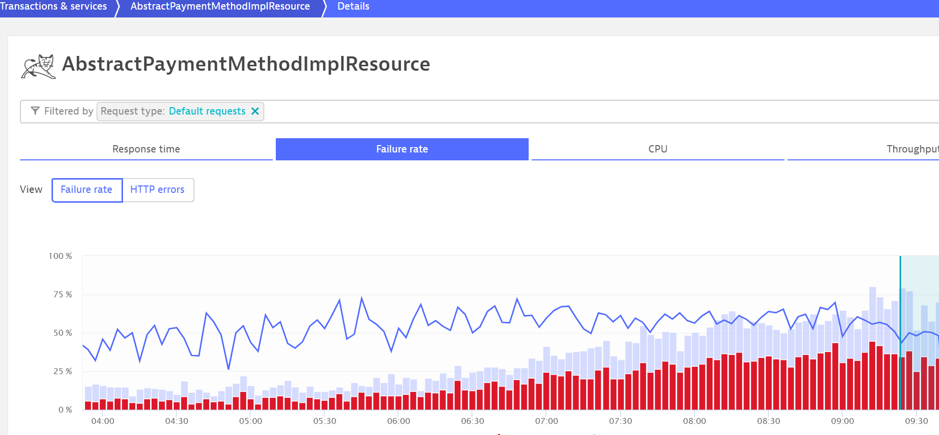
Because Dynatrace uses clever baselines, it will assume that it is normal and genuine issues could be missed unless the failure rate increases significantly. In the worst-case scenario, a service can report a 100% failure rate all the time so real errors will be invisible!
In this example, there was a genuine issue at 4:00 AM but it is buried in the noise. I have removed the noise in the screenshot below to illustrate it.
A small number of HTTP 500 errors in red were detected due to a connectivity issue with the database.
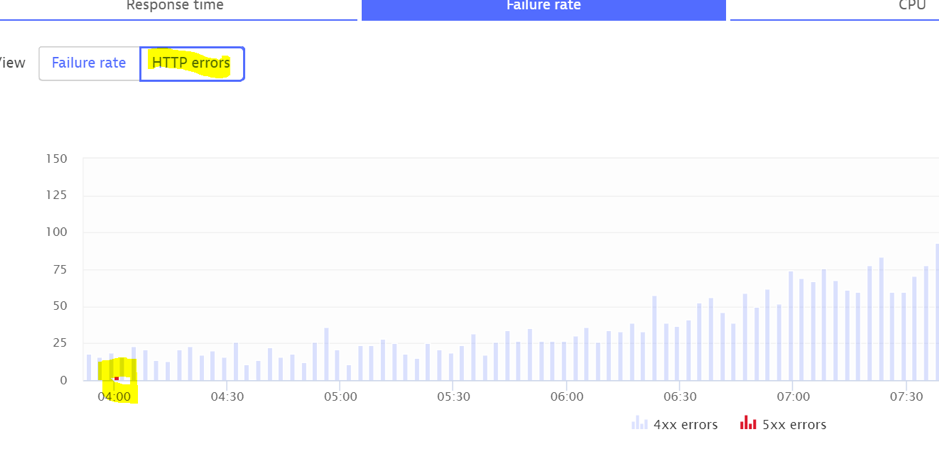
To see why Dynatrace thinks that this service is failing, let’s use the view detail of failure button.
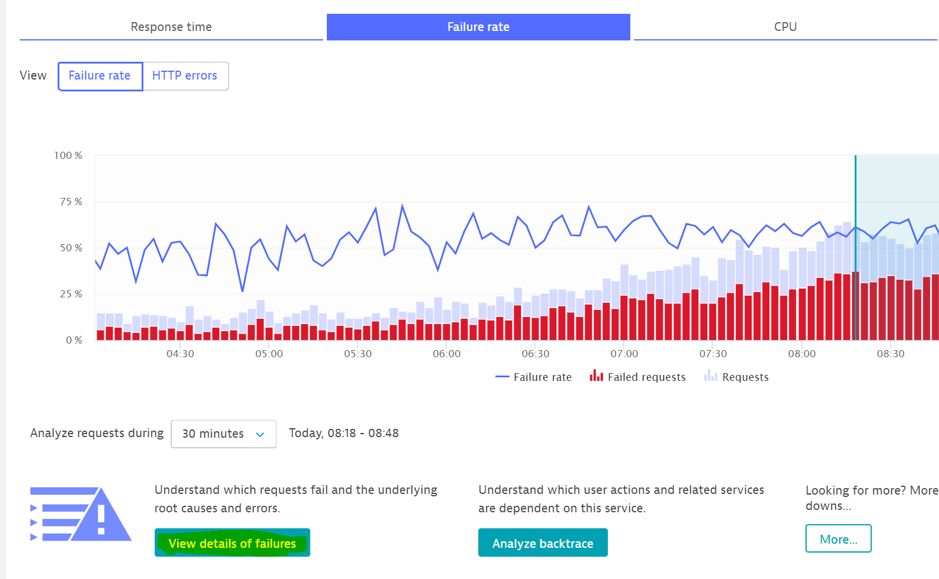
We can see that an org.apache/cxf/interceptor. Fault exception is thrown. It is a generic error handler but below we can see a business exception class. Further investigations revealed that it is a validation error which we don’t need to report.
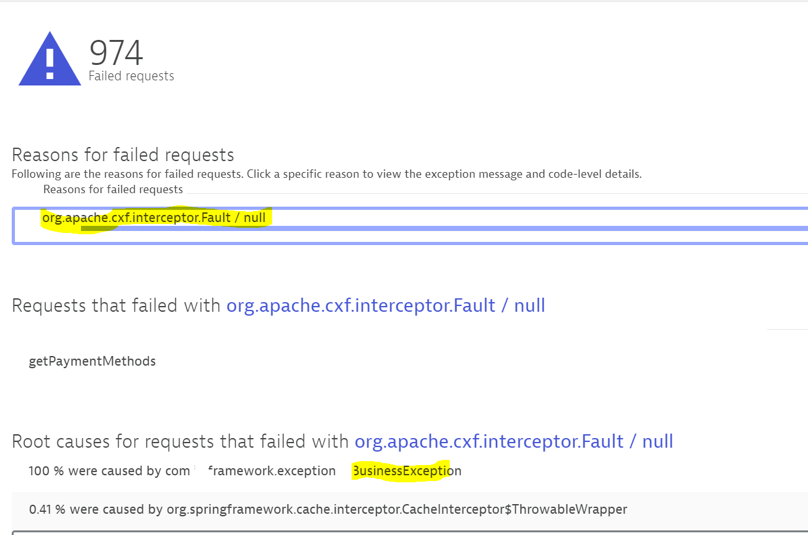
We need to tell Dynatrace to ignore this exception because it is just noise.
On the service screen, select “…”, edit and go to the error detection screen.
Under “ignore Exceptions”, add the exception class and optionally the error message.
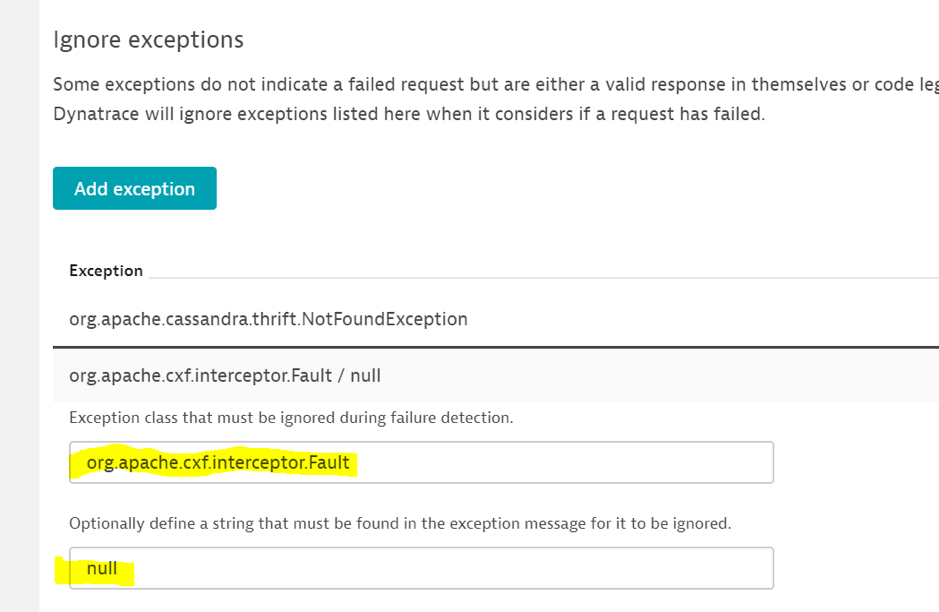
Save your changes and wait a couple of minutes.
The failure rate should be reduced. We can see below that I committed the change at 9:42 and the failure rate dropped to 0.
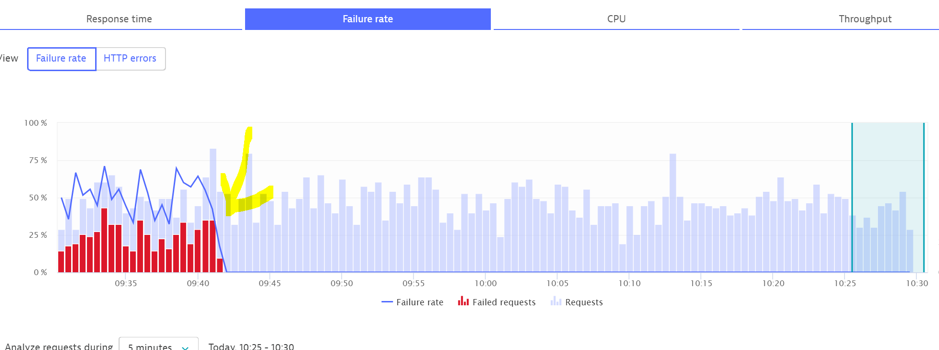
It is important to ensure that it isn’t ignoring all the errors so check thoroughly.
Include specific exceptions
In a similar fashion, application specific exceptions might not be reported by Dynatrace.
If the exception is gracefully dealt with (i.e. caught in developer’s speech) then Dynatrace will ignore it.
To see all the exceptions, use the “view exception analysis” button.
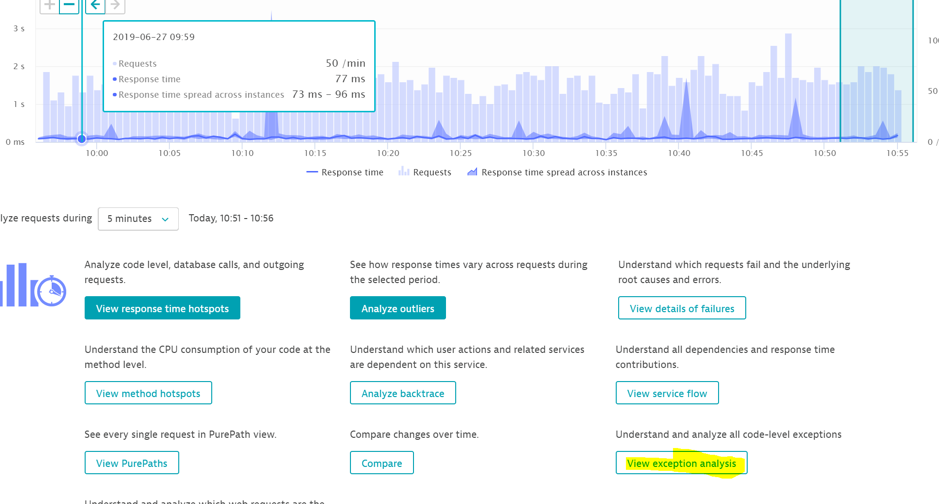
If you see an exception which you think is critical, add it to the error detection rules.
Advanced error detection
If your services, don’t rely on exceptions or don’t use HTTP, you can still define error detection rules to flag issues.
Many years ago, C programs were very common and most of them relied on return codes to highlight problems.
If you are using the same coding practices with your java, php, go or dot Net applications, request attributes can capture these return codes.
Request attributes fall outside the scope of this article so for more information please visit:
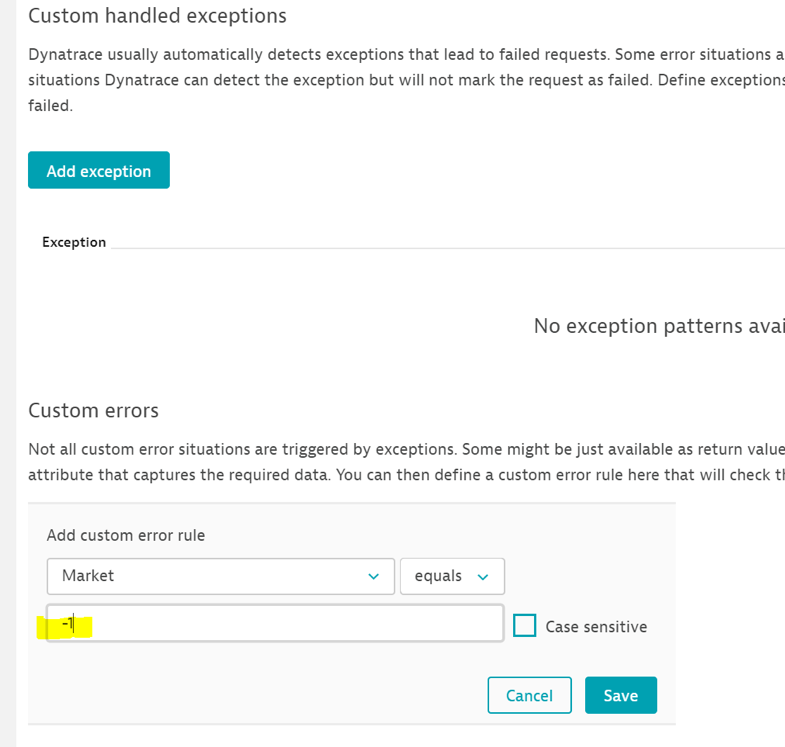
Once defined, the request attribute can be added to the error detection screen under custom errors and values can be specified.
See the example below where the request attribute called market to capture a return code and if the value is -1, Dynatrace will flag the request as a failed.
This is especially useful for backend processing services which may not be relying on HTTP for instance scheduled tasks.
What about HTTP error codes?
For each service, it is possible to change the way Dynatrace handles HTTP codes.
By default, Dynatrace only reports HTTP 5xx errors on entry. These codes can be amended to include or exclude specific ones.
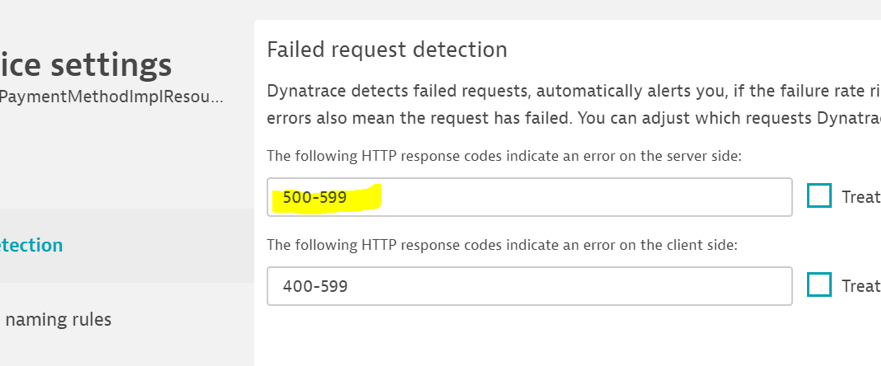
The first box lets you define codes that are seen by the caller.
The second box is for calls made to another service.
See the diagram below:

So, for instance, if service 1 is called and returns a code between 500 and 599, we have a failure.
What if the service returns an HTTP 200 we don’t. However, if service 1 calls service 2 and service 2 returns an error between 400 and 599, service 1 will be failing even if it returns an HTTP 200!
If it is not the desired outcome, change the second parameter to match your requirement.
Conclusion
So why is this important? Simply because if the data produced by the services are of good quality, you are giving Davis a better chance to detect genuine failures!
Start a free trial!
Dynatrace is free to use for 15 days! The trial stops automatically, no credit card is required. Just enter your email address, choose your cloud location and install our agent.


Looking for answers?
Start a new discussion or ask for help in our Q&A forum.
Go to forum