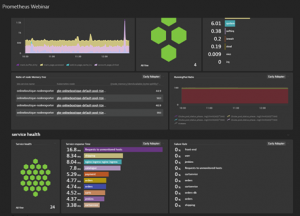
Dynatrace has recently extended its Kubernetes operator by adding a new feature, the Prometheus OpenMetrics Ingest, which enables you to import Prometheus metrics in Dynatrace and build SLO and anomaly detection dashboards with Prometheus data. Here we’ll explore how to collect Prometheus metrics and what you can achieve with them.
What is Prometheus?
Before we get into how to collect Prometheus metrics in Dynatrace, let’s first outline what Prometheus is and what it does.
Prometheus is an open-source software toolkit used for event monitoring and alerting. It records real-time metrics in a time series database with flexible queries and real-time alerting.
How to collect Prometheus metrics
Since its launch in 2012, Prometheus has become the standard technology to collect metrics in a Kubernetes cluster. Prometheus pulls (scrapes) real-time metrics from application services and hosts by sending HTTP requests on Prometheus metrics exporters. It then compresses and stores them in a time-series database on a regular cadence.
The new Dynatrace Kubernetes operator can collect metrics exposed by your exporters. This means Dynatrace isn’t collecting the metrics on the Prometheus server, but directly at the source of truth – the exporters.
Additionally, you don’t have to worry about scaling the Prometheus infrastructure because it doesn’t even have to be collected by the Prometheus server.
Once the data is ingested by Dynatrace, users can then take advantage of all Dynatrace features:
- Manage zones to control access to your data
- SLO and anomaly detection rules to handle your alerts directly in Dynatrace
- Dashboards to visualize metrics in context including Dynatrace metrics, Prometheus, custom metrics, logs, and so on.
How do you configure the Prometheus OpenMetrics Ingest?
For Dynatrace to take advantage of all the metrics exposed by the various Prometheus exporters, simply add a few annotations to your exporter’s deployment file. The Dynatrace Kubernetes operator automatically scrapes metrics on pods and services that have Dynatrace annotations. Dynatrace needs to know:
- The HTTP endpoint of your exporter that exposes Prometheus metrics
- The port
- Any required authentication settings
With that in mind, here’s a step-by-step guide on how to:
- Identify the scraping configuration of your exporter
- Add the Dynatrace annotation
- Know where to find your Prometheus metrics ingested by Dynatrace.
1. Identify the scraping configuration of your exporter
Every Prometheus exporter can have different settings to collect the metrics exposed. These are Port, Path, and Protocol (HTTP or SSL). Those settings are crucial to allow Prometheus (or Dynatrace in our case) to scrape the metrics.
Port
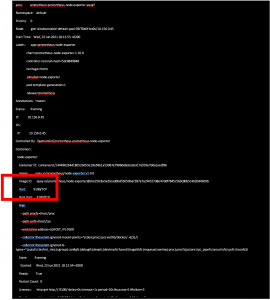
How do you get the port of your exporter? You can find the information related to the port in the description of your pod. If you run the command shown below, you’ll get all the information related to your pod:

Example of output of the command:
Path
Most of the exporters are exposing the metrics on the path: /metrics. But /metrics is not standard, so it means exporters can use any path to expose their data.
We highly recommend reading the documentation of your exporter to get the right path.
Here is a website listing the various exporters: PromCat.io – A resource catalog for enterprise-class Prometheus monitoring
Protocol:
By default, Prometheus utilizes the HTTP protocol to scrape the metrics out of the exporter.
But to add extra security, you can deploy NGNIX to enable the SSL encryption and also add an extra authentication policy.
2. How to test the configuration?
To ensure the correct configuration of the Dynatrace annotations, we recommend testing the settings by sending a request to the exporter’s HTTP endpoint.
Once you have identified the port of your exporter you will simply have to create a port forward:

Then direct your browser to http://localhost:9090/metrics (see my example) and see the metrics in the Prometheus format.
You can also test the settings by deploying a pod with Curl installed to test your request directly within your cluster.
3. How to add the Dynatrace annotation?
Similarly to Prometheus, Dynatrace needs to be able to “discover” the pods exposing Prometheus metrics. To accomplish this, add an annotation on your pods/services deployment file.
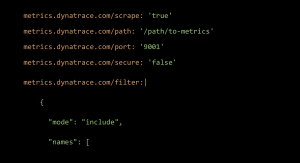
If you are not comfortable with changing the deployments of your exporters, you can also create a new “fake” service with the required annotations and settings to select the pods to scrape.
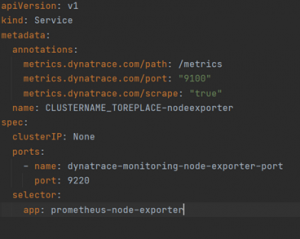
Keep in mind that Dynatrace will not be able to ingest Prometheus metrics if the annotations are not configured properly.
Where can I see my Prometheus metrics in Dynatrace?
You can see the Prometheus metrics in:
- Metrics
- Or the Data explorer.
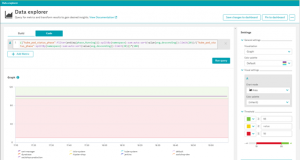
The Data Explorer will allow you to build queries on your Prometheus data.
One of the advantages of the Prometheus ingest is that all the Prometheus labels will be available as dimensions in Dynatrace.
Dimensions allow you to achieve various operations such as:
- Grouping and filtering in the Data explorer
- Defining management zones
- Create anomaly detection rules
Once the metrics are ingested, we will of course be able to analyze our Prometheus metrics in Dynatrace, but the other great advantage of Dynatrace is the ability to create anomaly detection rules based on your “queries”.
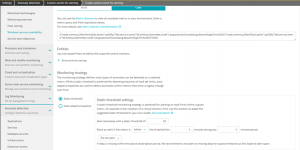
How can we automate the deployment and the configuration of Dynatrace?
As a Prometheus user, you will probably expect to be able to deploy new exporters, build graphs and define alerts automatically through a CI process or a script.
Dynatrace has a tool named Monaco (Monitoring as Code) that allows you to automate the configuration of your Dynatrace tenant.
Monaco is a command-line tool that interacts with the configuration API. This tool enables you to implement
- Dashboarding as code
- Creation of management zones
- Alerting as code
- And much more
With Prometheus OpenMetrics ingest and Monaco, you can implement the following pipeline:
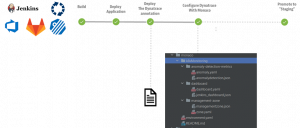
This automates:
- The deployment of your new exporter and the “fake” service that will add the Dynatrace scraping annotation
- The configuration of management zones
- The creation of the new dashboard and anomaly detection rule.
Getting started with Prometheus
Over the years Prometheus has become an industry standard. Most software technologies currently on the market are exposing observability metrics related to their product (CI/CD, network appliances, databases).
As a cloud-native engineer, the Prometheus OpenMetrics ingest capability is amazing news because it allows us to fully take advantage of these external metrics within Dynatrace to observe our IT environment, our CI/CD process, our backup process, and more.
Once Dynatrace ingests the external metrics, you will be able to take advantage of all the great features and proactively avoid customer-facing breakdowns in case of an issue.
Similar to the configuration of Prometheus, adding external metrics means you can add the right annotation on your Pods/Services deployment files.
By importing Prometheus metrics into Dynatrace you also gain :
- User permissions management of top of your Prometheus metrics
- Significant reduction of maintenance tasks related to Prometheus infrastructure
- Full advantage of all Dynatrace features (notify your teams in case of problems, define dashboards, SLOs, etc.) on the top of Prometheus native metrics.
Prometheus is a powerful tool, but it also comes with a few challenges. To learn more about these challenges, check out my other blog – What is Prometheus and Four Challenges for enterprise adoption.


Looking for answers?
Start a new discussion or ask for help in our Q&A forum.
Go to forum