Distributed Traces are “the source of truth” for developers and architects as they capture the true end-to-end execution path for each individual request processed by your applications and services. When running unit or API tests in a local dev environment, IDE (Integrated Development Environment) and test tool integrations with observability platforms make it easy for engineers to run distributed trace analysis on the distributed traces they just generated. Answering questions like “Does my code correctly call the new backend service version for my specific use case?” becomes easy as the outgoing call with request and response details will be shown in the distributed trace.
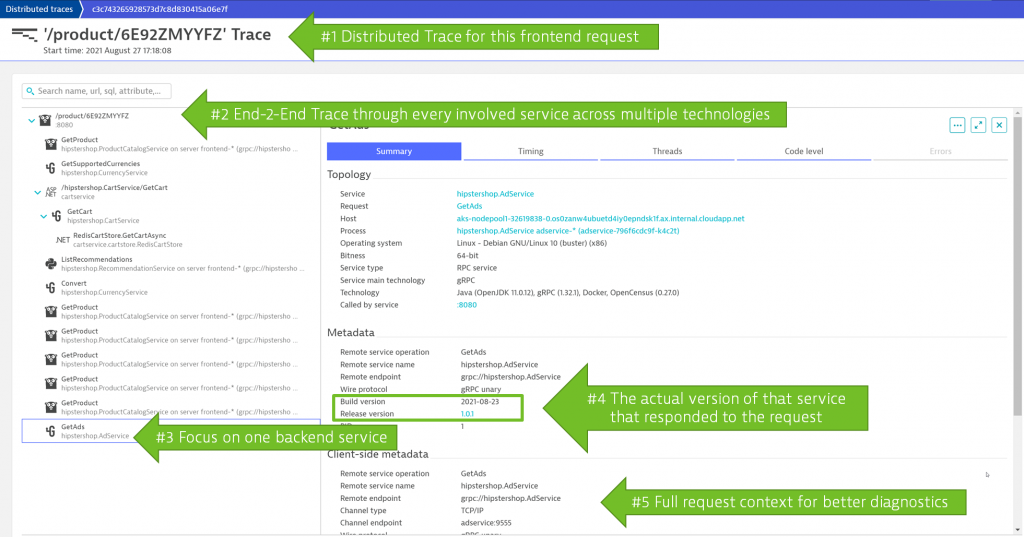
The following screenshot shows a distributed trace in Dynatrace with detailed version information of every service call involved. In the rest of the blog, you will learn more about how to capture version information and use it to answer your version-specific questions:

If you’re not already capturing distributed traces in your development environments, I hope this blog enables you to make the case for it.
From a handful to millions of distributed traces requires automation
When distributed traces are captured in shared testing or production environments, where hundreds of services/microservices are deployed in one or multiple versions, you potentially end up with millions of captured traces in a short time span. If you then figure out how to automate the analysis of those traces you can empower DevOps and SRE teams as they need answers to questions such as:
- “Which versions of our services are currently processing our critical transactions?”
- “How does an overloaded backend service impact the SLOs of the frontend service?”
- “Which frontend services are responsible for the changed traffic behavior on the backend services?”
- “Is there a different behavior between two versions of a service? If so – shall we stop the rollout into production?”
I personally keep hearing those questions more frequently these days, which is somewhat worrying. Many members in our Dynatrace community are moving towards k8s and microservices which allows DevOps and SREs to leverage zero-downtime update strategies (also known as Progressive Delivery), such as Blue/Green, Rolling Updates, Canary Deployments or Feature Flags more easily. To answer version-specific questions like the one above it’s not only necessary to capture version information on every distributed trace but you must also automate the analysis as no one can dig through millions of traces manually to end up with answers that lead to better delivery and release decisions.
The good news is that Dynatrace PurePath, our leading automated distributed trace technology for the past 15+ years, is version aware by default meaning that it automatically captures the version information on every PurePath and provides automated analysis options to answer those version specific questions. But it’s not just the raw data that matters – it’s what Dynatrace does with the data, which I’ll delve into now. , which I’ll delve into now.
To learn more about Dynatrace’s version aware analysis capabilities I invited Thomas Rothschaedl, Product Manager at Dynatrace, to my latest Performance Clinic where he explained how version aware PurePaths are captured, how Dynatrace provides real-time release overview, and how Dynatrace provides automated answers to DevOps & SRE based on version-aware PurePath data.
While I encourage you to watch the full 30 minutes recording on YouTube or Dynatrace University I captured the key learnings in the remainder of this blog:
Dynatrace real-time release and version overview
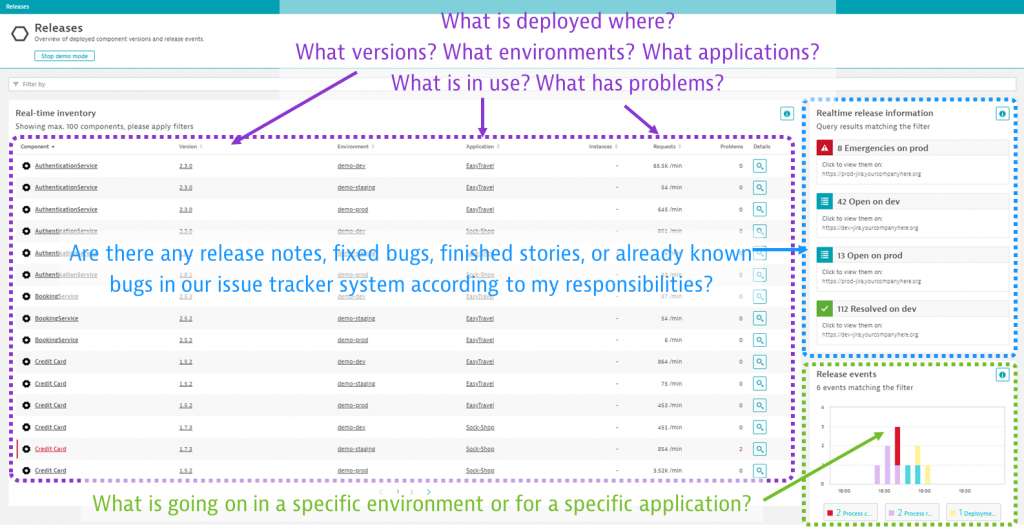
Thomas started of reminded me about the Dynatrace Releases screen, which gives our users a live overview of all deployed releases in every monitored environment, even providing release lifecycle events (deployment, tests, quality gate, promote, rollouts, rollbacks, problems, etc.) as well as direct access to any open development or support tickets:

If you’d like to learn more about the releases overview make sure to watch my Performance Clinic on Risk-Free Delivery with Dynatrace Cloud Automation Release Management.
Analyzing rolling version updates through multi-dimensional analysis
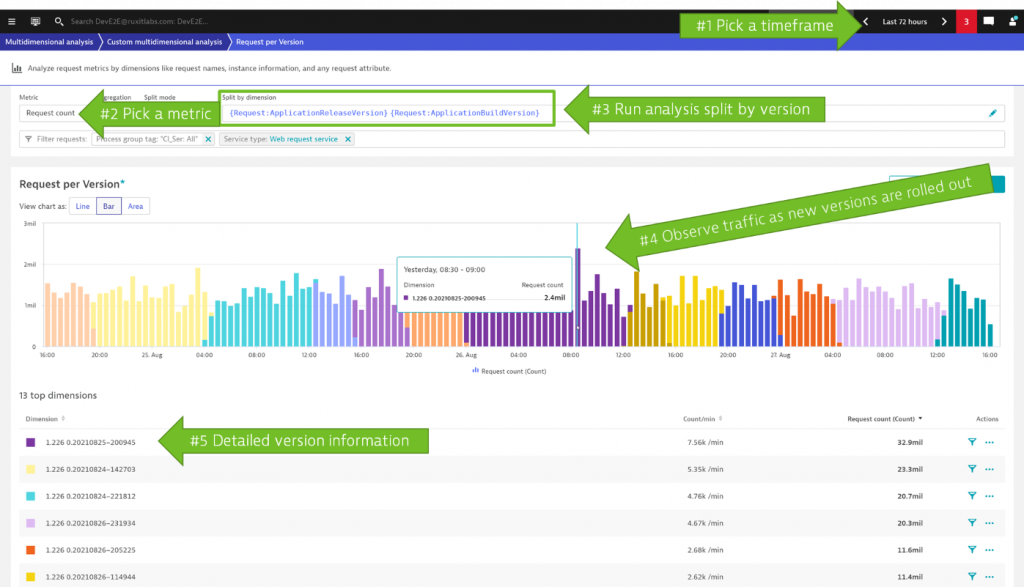
At Dynatrace we’re proud to use Dynatrace on Dynatrace which allowed Thomas to show an internal example of analyzing rolling software updates. The screenshot below shows a 72-hour analysis window of the rolling updates we do in our end-to-end testing environment. Here, we continuously roll out the latest Dynatrace versions that come out of our build system. The environment is constantly under load and it’s therefore great to see how the rolling update is truly and smoothly updating from one version to the next:

Analyzing request count (=throughput) is just one option, as you can see in the next section.
Automatic regression detection across versions
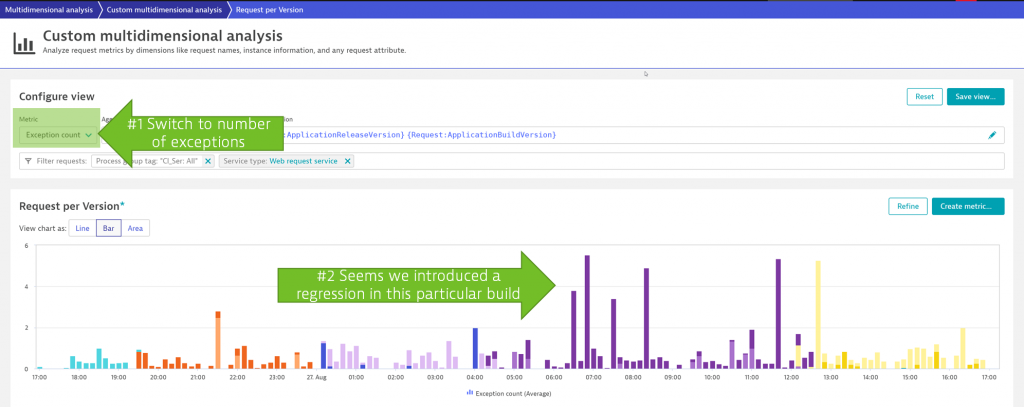
While the above example nicely shows the rolling updates that happened during constant load on the system, it also only focuses on throughput. What’s more interesting is if you switch to a different metric that can be extracted from PurePaths such as “Number of Exceptions Thrown”, “Number of Database Calls Made”, “Number of Database Rows Fetched”, or “Time Spent in I/O”.
Thomas demonstrated this in the performance clinic I mentioned above, where he wanted to know if any of our builds introduced a regression that caused more exceptions to be thrown. Exceptions are by default captured by Dynatrace OneAgent as part of the version aware PurePath. As you can see from the below screenshot, he immediately found a regression that was introduced in one of the builds that were rolled out earlier that day:

This is the true power of analyzing a massive amount of PurePaths in an automated way. No one would be able to identify those problems quickly by manually digging through millions of PurePaths. That’s why Dynatrace’s automation is valued by our users as it finds these issues automatically without any manual effort. But there’s more than what Thomas showed us.
Diagnostics, metrics, dashboards, and alerting
In the 30 minutes I had, Thomas walked me through the use cases he additionally demonstrated how to:
- Drill to the offending line of code of the exception regression
- Create metrics, put them on a dashboard and roll those out across all teams
- Get alerted on version-specific anomalies

If you want to see all these demos, then check out the Performance Clinic recording. The live demo piece starts at the 15:35 timestamp.
Make better release decisions through version aware distributed traces
Whether you use Dynatrace or any other tool to capture distributed traces, it should be clear that you must make sure to capture version information on each trace and have a way to analyze large volumes of distributed traces to make better release and deployment decisions. If you don’t yet have a distributed tracing option, or if your current tooling doesn’t support what Thomas has shown in his demo, then feel free to sign up for a Dynatrace trial and try it out yourself.
To end this, I’d like to say THANK YOU Thomas for your great preparation of the Performance Clinic content. You did an amazing job in showing the value of the latest capabilities in Dynatrace. I also want to say THANK YOU to Dynatrace engineering, which has not only built a great platform but also uses Dynatrace on Dynatrace and with that, makes our demos and storytelling even easier.


Looking for answers?
Start a new discussion or ask for help in our Q&A forum.
Go to forum