What is the purpose of monitoring tools?
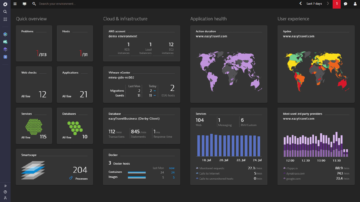
Monitoring Tools ensure high performance for your software. Constant monitoring of your system allows you to manage the performance and availability of software applications. This leads to quick response times, improved computing processes and satisfied customers. Especially digital end user experience is one of the main goals when dealing with real user interactions and business transactions. Dynatrace monitoring tools save the effort of interpreting such dependent events on your own and directs you to the component that might cause performance issues or problems for your customers. Fixing, accelerating, and optimizing your servers and software applications has never been so easy.
Why use an observability platform?
Traditional monitoring tools are often siloed and cannot deliver answers. When issues arise, teams are left searching for the proverbial needle in the haystack amongst their siloed data. This reduces productivity and negatively impacts user experience.
Dynatrace’s observability platform leverages the power of automation and AI to ensure that even the most complex environments are fully monitored and instantly provides answers. Fixing, accelerating, and optimizing application environments in the modern cloud has never been so easy.
All your data in a unified monitoring tool
Dynatrace provides the only solution in the market, providing all capabilities required to empower digital enterprises with hybrid multi-clouds to deliver great digital customer experience.
Monitor cloud environments and serverless functions out-of-the-box. See the full picture of your dynamic infrastructure in real time and gain observability into hosts and containers.
Application performance monitoring
Ensure application performance, innovate faster, collaborate efficiently, and deliver more value with dramatically less effort.
-
Application monitoring
Dynatrace provides application performance monitoring with code-level insights for Java, .NET, Node.js, and PHP. Track each transaction, across all tiers, with no gaps or blind spots.
-
Database monitoring
Dynatrace monitors and analyzes all of your application’s database activities, providing you with observability all the way down to individual SQL and NoSQL statements.
-
Continuous delivery analytics
Accelerate innovation with Dynatrace continuous delivery and test automation capabilities. Effectively monitor key architectural metrics with every single build.
-
Mainframe monitoring
Easily manage complex mainframe applications. See and understand transactions at the mainframe level—out of the box.
-
Application performance monitoring
Application performance monitoring enables the detection and diagnosis of availability and performance problems across your entire stack
-
Service backtrace
Automatically analyze service call sequences from back-end performance to front-end impact and understand how requests or database statements impact customers.
-
Full stack monitoring
Full stack performance monitoring provides unique insights into your application environment, combining big data analytics with digital experience monitoring, application performance management and cloud, container and infrastructure metrics.
Cloud, container, & infrastructure monitoring
Advanced observability across cloud and hybrid environments with continuous auto-discovery.
-
Server monitoring
Dynatrace brings your entire data center into view to help you with capacity management. Whether you’re monitoring physical servers or cluster nodes, Dynatrace shows you CPU, memory, and network health metrics all the way down to the process level of each Linux and Windows host.
-
Network process monitoring
Dynatrace network process monitoring ensures high-quality process communication, revealing the quality of all process connections on your network—including processes distributed across virtualized cloud environments and data centers.
-
Container monitoring
Monitor containerized applications in dynamic environments out-of-the-box. Get real-time observability into dynamic container environments.
-
Virtualization monitoring
See the full picture of your dynamic virtualized environments. Dynatrace connects the dots between the dependencies of the vCenters in your data center, the processes that run on them, and your applications.
-
Microservices monitoring
Dynatrace automatically discovers all microservices running in your container environment. Get real-time observability into dynamic environments.
-
Cloud monitoring
Dynatrace monitors your entire stack, including private, public, and hybrid clouds. Whether you run on AWS, Azure, Cloud Foundry, or OpenStack, Dynatrace auto-detects all virtualized components and keeps up with all changes.
-
Log analytics
With Dynatrace log analytics, you gain direct access to the log content of all your system’s mission-critical processes. It’s easy to search for specific log messages that you’re interested in. You can even analyze multiple log files simultaneously—even when log files are stored across multiple hosts.
AIOps
Dynatrace’s AI continuously looks for problems and provides the precise root cause.
-
Application topology discovery
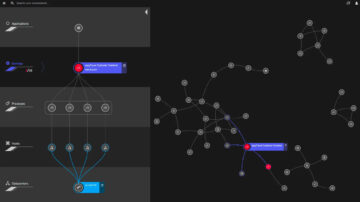
Dynatrace continuously auto-detects dependencies within your entire application stack. It visualizes your web application architecture end-to-end in real-time.
-
Root-cause analysis
Dynatrace detects anomalies before they affect your customers. Find out where and why applications break in seconds.
-
Advanced observability
See it all in-context, including metrics, logs, traces, entity relationships, UX and behavior
-
Continuous Automation
Make it easy with automatic deploy, config, discovery, topology, performance, updates, and more.
-
AI-assistance
Free your time with precise answers for proactive problem resolution and performance improvements.
Digital experience monitoring
Improve user experiences by ensuring every application is available, functional, fast and efficient.
-
Real user monitoring
Dynatrace monitors the activity of all your mobile and web application users, across all devices and browsers, analyzing the data in real-time to assess user satisfaction.
-
Synthetic monitoring
Measure and compare your mobile and web channels using the world’s best synthetic-monitoring network. Monitor performance from the locations where your customers are located by emulating real user behavior from key geolocations around the world.
-
Mobile app monitoring
Dynatrace mobile solutions deliver real-time insights to help you optimize each digital moment—from each customer swipe and click all the way to your back-end services.
-
Session replay
Understand UX problems intuitively and provide proactive customer complaint resolution. Session replay records every single user sessions and provides a visual replay for faster troubleshooting.
-
Digital Experience Insights
Get detailed analysis with actionable Insights that guide you to take the best actions that improve your digital business. Digital Experience Insights provide this as well as day-to-day management of synthetic and real-user monitoring technologies, daily triage, expertise on-demand, and best-practice measurement design and management.
Business and performance analytics
Gain real-time visibility into business KPIs—enable more efficient IT and business collaboration.
-
User behavior analytics
Find out how successfully your latest features are adopted by your customers and know if you’ve optimized the right entry points. Dynatrace provides facts to accelerate your business with highly accurate real-time insights.
-
Business transaction monitoring
Dynatrace monitors every single business transaction end-to-end, with no gaps or blind spots. It shows the execution of each individual request as it travels through your technology stack.
-
Business Observability possibilities
See how Business Observability provides real-time, AI-powered answers to your organization's unique business questions.
Application Security
Empower DevSecOps at scale with a unique approach to securing cloud-native applications at runtime combined with intelligent automation.
-
Runtime vulnerability analysis
Reduce the time and cost to find and fix application vulnerabilities. Leverage runtime context to precisely implement countermeasures and remediation.
-
Runtime application protection
Reduce exposure to missed and zero-day vulnerabilities. Continuously detect and block common application attacks, like SQL injection and command injection.
-
Log audit and forensics
Quickly gain actionable insights that enable proactive security risk mitigation and remediation. Leverage observability context to reduce the time and effort required to investigate security incidents.
-
AI-assisted prioritization
Free your teams from war rooms and focus them on bringing innovation to market. Stop wasting time sifting through the noise and chasing false positives.
-
DevSecOps automation
Accelerate speed to market and productivity through improved DevSecOps collaboration. Increase confidence in application releases with security gates.
A Leader in the 2025 Gartner® Magic Quadrant™ for Observability Platforms
Read the complimentary report to see why Gartner positioned us highest for Ability to Execute in the latest Magic Quadrant.
This graphic was published by Gartner, Inc. as part of a larger research document and should be evaluated in the context of the entire document. The Gartner document is available upon request from Dynatrace. Dynatrace was recognized as Compuware from 2010-2014.


What killed traditional monitoring?
As software development transitions to a cloud-native approach that employs microservices, containers, and software-defined cloud infrastructure, the immediate future will bring more immense complexity than the human mind can envision.
You also invested in monitoring tools—lots of them over the years. But your traditional monitoring tools don’t work in this new dynamic world of speed and scale that cloud computing enables. That’s why many analysts and industry leaders predict that more than 50% of enterprises will entirely replace their traditional monitoring tools in the next few years.
Built for the modern cloud: Dynatrace monitors and analyzes everything, from top to bottom
Dynatrace not only sees every component of your modern cloud environment, but we also understand how everything is connected. Our AI engine considers applications relationships and interdependencies to provide causation-based answers and proactive, actionable insights. No more wading through alert storms from dozens of monitoring tools.
You may be also interested in...
 eBookUpgrade to advanced observability for answers in cloud-native environments
 eBookFive Key Considerations for Cloud Monitoring
 BlogAPM tools vs. APM platform: What’s the difference?
 eBookCharting an application performance monitoring roadmap
 CLOUD DONE RIGHT WEBINAROvercome tool sprawl with AI-powered answers
 WEBINARConsolidate your tool stack for end-to-end observability
More than just a bunch of tools: Take the Dynatrace platform for a test drive
You’ll be up and running in under 5 minutes:
Sign up, deploy our agent and get unmatched insights out-of-the-box.
