I'm often asked by customers and prospects evaluating Dynatrace, “How do I get started integrating Dynatrace into my software delivery pipelines?” and I hope this blog will show you how you can using example code within Azure DevOps.
I’m often asked by customers and prospects evaluating Dynatrace, “How do I get started integrating Dynatrace into my software delivery pipelines?” and I hope this blog will show you how you can.
More specifically, I’ll demonstrate how in just a few steps, you can add Dynatrace information events to your Azure DevOps release pipelines for things like deployments, performance tests, or configuration changes. This means, your development and operations teams have additional context information during review and analysis of your applications.
Microsoft DevOps Azure is one of the best CI/CD systems and a strategic technical Dynatrace partner. Together, we offer a variety of integrations for Microsoft Azure, as well as the option to host the Dynatrace platform in Azure.
What are Dynatrace information events?
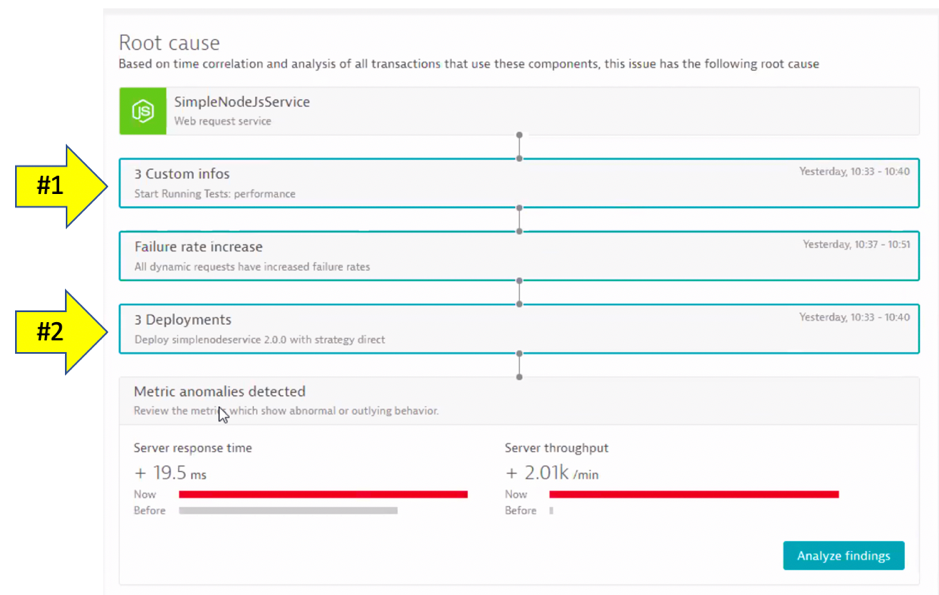
Dynatrace information events enable CI/CD tools, such as Azure DevOps, to provide additional details for Dynatrace. Below we can see both the information (#1) and deployment events (#2) for a service that was the root cause to a problem the Dynatrace AI engine, Davis®, determined.
Information events are also viewable on the entity page. Below (left) is an example deployment event and an example custom information event (right).
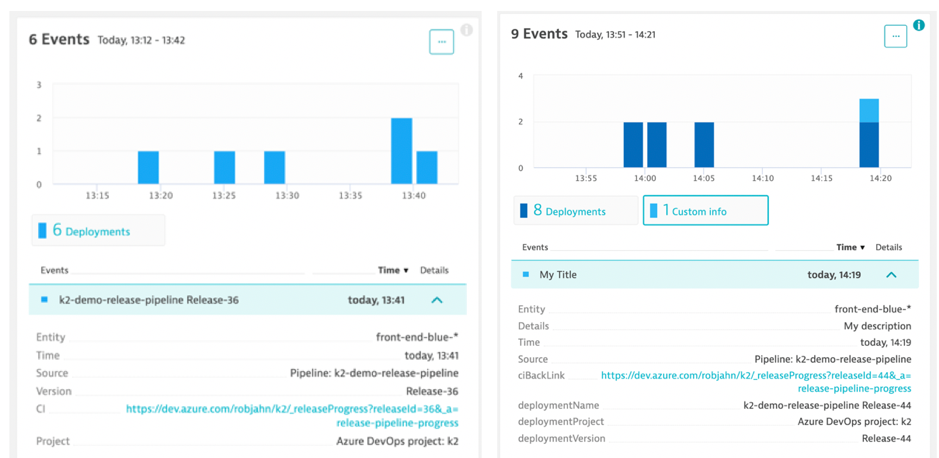
There are four Dynatrace information event types: deployment, annotation, configuration, and info. Each event has a timestamp, event source, a few standardized fields (depending on the event type), and the option to add additional custom fields.
Having information events speeds up triage by adding context to what’s happening with the application. Just imagine getting alerted about an issue and immediately seeing a load test or deployment took place, and in one click of the event, URL review the system, job, and team responsible!
What are Dynatrace tags?
When creating information events, you must target the entities to receive the event so that it’s only associated with the relevant component. That is where Dynatrace tags come in.
In a nutshell, tags in Dynatrace are labels or markers used for organizing entities in large monitoring environments. Below shows a few tags for my front-end service; “environment:orders-project-staging”and “service:front-end”.
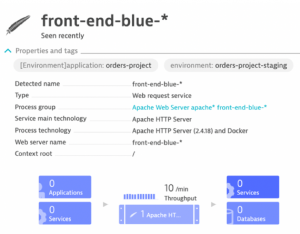
For custom tags, Dynatrace recommends using automatic tagging rules to reduce maintenance and ensure changing infrastructure is automatically updated with tags.
These rules dynamically match the metadata detected by the Dynatrace OneAgent. Once a match is made, the rule will automatically assign the tag and a ‘tag value’ which is defined in the rule.
For additional information on tagging, check out these resources:
- Tagging 101 – Tagging Essentials Video
- Automated rule based tagging for services blog
- Dynatrace automatic tagging rules documentation
Dynatrace API
The Dynatrace event API is how scripts can automate information event creation. The type of event, event information, and the entities to send the event to are passed in the API request.
As mentioned above, tags are used to match entities for example: “Add a deployment event to the entities with the service tag equal front-end and environment tag equal staging”.
To use the Dynatrace API, you must pass in a Dynatrace API token within the HTTP request header as to secure the API request. An API token is created within Dynatrace by following the Dynatrace documentation.
Calling the Dynatrace Event API using a PowerShell script
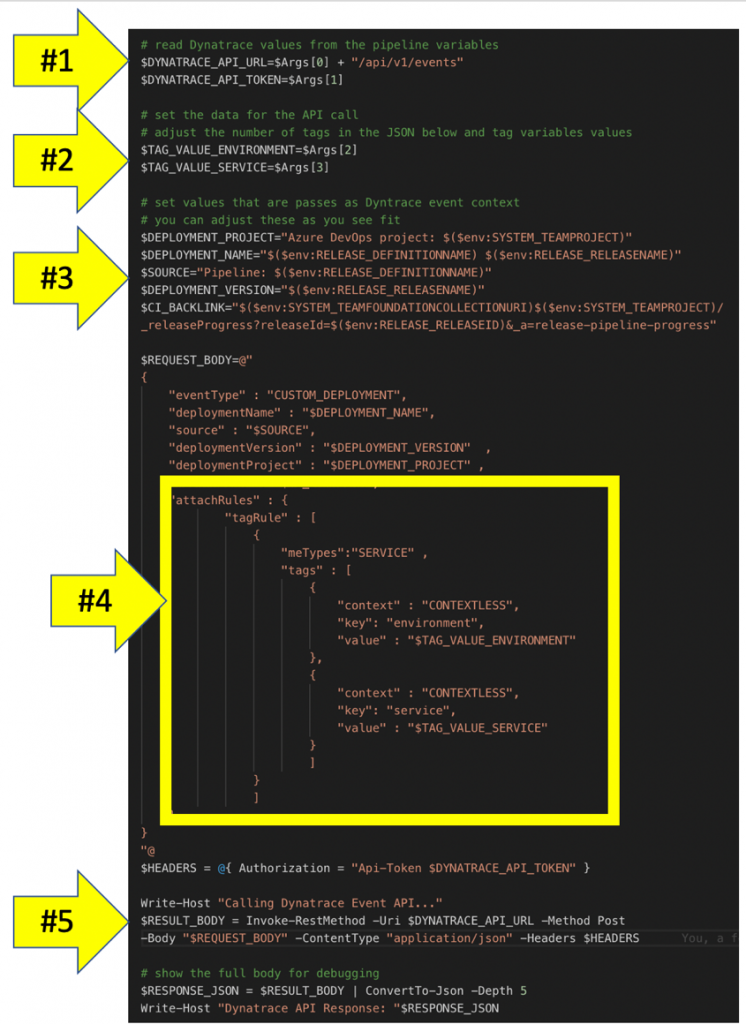
This PowerShell script example below builds up the POST request and calls the Dynatrace events API to add a deployment event.
Let’s break this script down:
- Dynatrace tenant and API token that is passed in as arguments. We do this as to not hardcode the URL and the API token in the script.
- The “environment” and “service” tag values are passed in as arguments. You’ll likely have different tag names, and several tags for your environment, so you’ll need to adjust your arguments and script for your requirements.
- Create variables with the strings and URLs that make up the information event. This script assumes it will be run within Azure DevOps, and by assuming it’ll be run within Azure DevOps, it can use the large number of built-in Azure DevOps release variables for constructing the event title, source and deployment values of the new event.
- The event API request has a section in the request body for defining the tags to match. This section uses the “environment” and “service” tag arguments passed into the script.
- Call the Dynatrace API with the API Token and the request body.
Call the PowerShell script from an Azure DevOps release pipeline
To call the PowerShell script, let’s use the following design:
- Use the Azure DevOps PowerShell script task.
- Read the PowerShell script from a GitHub Repo.
- Use DevOps variables for the argument values passed to the script. Variables can also be protected as to not have the API token appear in logs.
STEP 1 – Create a “variable group” for Dynatrace URL and API Token
A variable group can be shared across pipelines in an Azure DevOps project and is perfect for storing the Dynatrace URL and API token.
To add one, navigate to the DevOps project library adding these two variables:
- dynatrace-api-token – use the API token you created for your Dynatrace tenant and click on the “lock” icon to mask this value.
- dynatrace-base-url – use the base URL for your environment for example https://{your-environment-id}.live.dynatrace.com for SaaS or https://{your-domain}/e/{your-environment-id} for managed.
STEP 2 – Link variable group to the release pipeline
Link a variable group within a pipeline variables section as shown below. Notice how the Dynatrace API token value is masked.

STEP 3 – Create variables for tag inputs
Since the tags for the information event are specific to the pipeline, we use release pipeline variables to store these. My PowerShell script expected two, I add variables for “environment” and “service” as shown below.

STEP 4 – Read in PowerShell script from GitHub
To get started, make a copy of my script sample found here and check it into your repository.
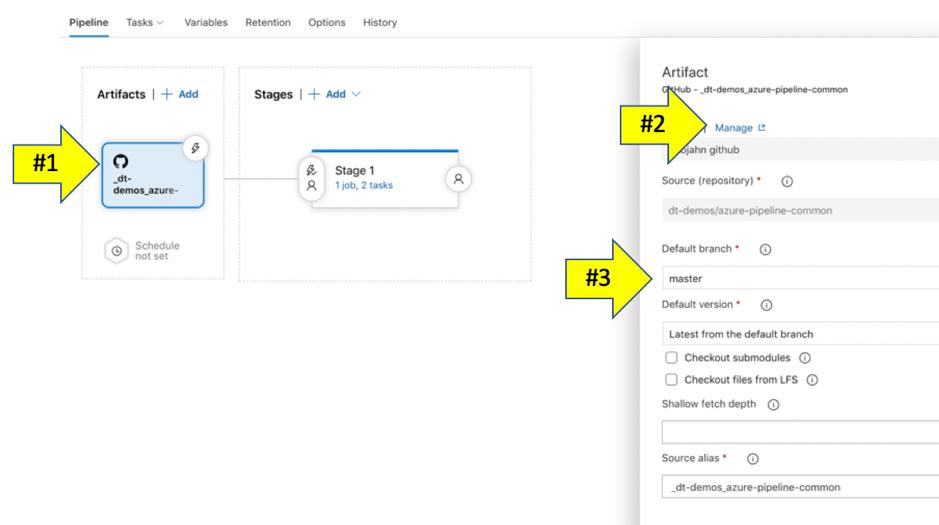
- Within the Azure DevOps release artifact section, choose your GitHub as the source.
- If you don’t have one, click the manage link to add a DevOps service connection to the GitHub repo.
- Choose your repo and a branch.
- In the PowerShell task, adjust the type to “file path” and click the “…” next to “script path”. This will open a popup window for picking the script.
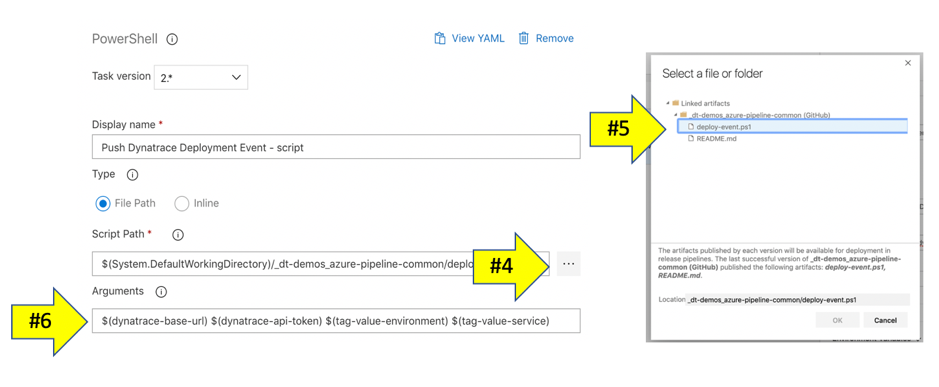
- Use the file picker to pick the PowerShell script.
- Finally, add the script arguments for Dynatrace and tag values contained in the DevOps variables we defined above.
STEP 5 – Run the pipeline
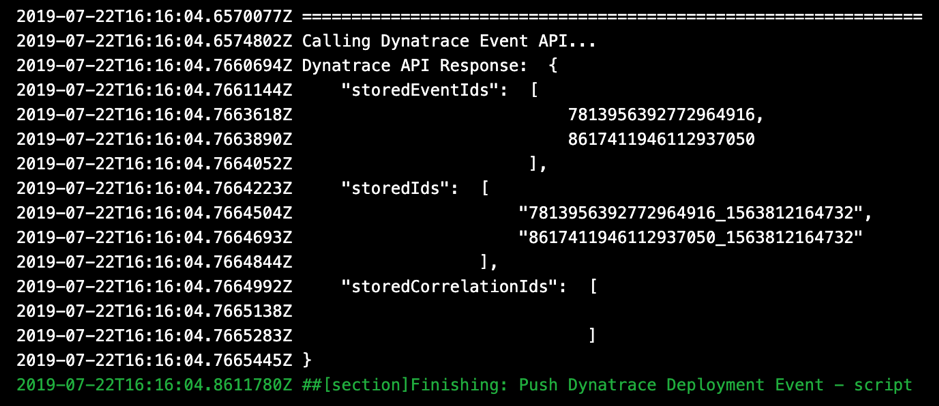
After the release pipeline PowerShell task is run, the DevOps log will contain the API response. A successful execution will show the Dynatrace IDs of all custom events created by an event push call as shown below.
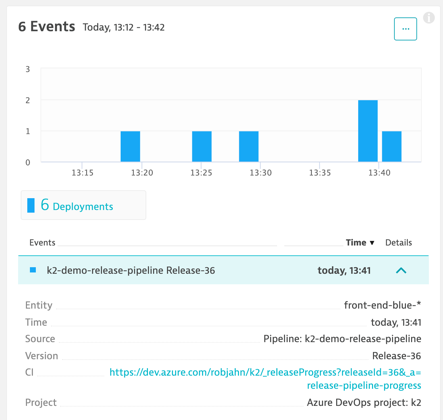
Dynatrace shows our new event!
Try it yourself
Try adding Dynatrace tags and events for your environment, and let us know how to you get on! And, check out the other PowerShell scripts in my GitHub repository including adding a CUSTOM_INFO event that can be used for events like “performance test start” and “performance test end”.
If you haven’t tried Dynatrace, check out our Dynatrace Free Trial and Developer Program to help you learn, collaborate, and build on the industry’s powerful Software Intelligence platform along with the rest of your industry colleagues.



Looking for answers?
Start a new discussion or ask for help in our Q&A forum.
Go to forum