
You’re in the middle of threat-hunting activities using Dynatrace and discover that some of your assets are trying to resolve a suspicious DNS name to extract data via covert channels like DNS tunneling. You now want to detect such events automatically by creating a custom Dynatrace security event. This blog post explains how to achieve this goal.
Following the Route53 log use case in Dynatrace threat-hunting documentation, a DNS query record is structured in the following way:
{
    "version": "1.100000",
    "account_id": "684399999995",
    "region": "us-east-1",
    "vpc_id": "vpc-026e4d09999995",
    "query_timestamp": "2024-08-17T07:24:57Z",
    "query_name": "250607.56755a335668636d52634969497343694167496e4a6c59584e766269493649.434a4762334a696157526b5a5734694c416f6749434a6b5a5852686157787a.tiitha-maliciousdomain.com.",
    "query_type": "A",
    "query_class": "IN",
    "rcode": "NOERROR",
    "answers": [
        {
            "Rdata": "34.667.67.208",
            "Type": "A",
            "Class": "IN"
        }
    ],
    "srcaddr": "172.31.1.6",
    "srcport": "42241",
    "transport": "UDP",
    "srcids": {
        "instance": "i-0b56150a99995e6d",
        "resolver_endpoint": "rslvr-out-c8e7c49999999fb5a"
    }
}
Let’s say that the meaningful fields you need for the security event are:
- timestamp when the DNS query was executed (
query_timestamp); - source IP where the query was performed (
srcaddr); - DNS query requested (
query_name).
The JSON matcher, with its ability to parse out selected members, allows you to use the following simple DQL expression to extract only the fields you need:
json{
  timestamp('yyyy-MM-DDTHH:mm:ssZ'):query_timestamp,
  string:query_name,
  ipaddr:srcaddr
}(flat=true)
As a result, you now have three additional fields with their respective types and values.

To add more accuracy to the query you’re about to automate, you need to extract the domain portion from the query_name field. This can be achieved with the following DQL expression:
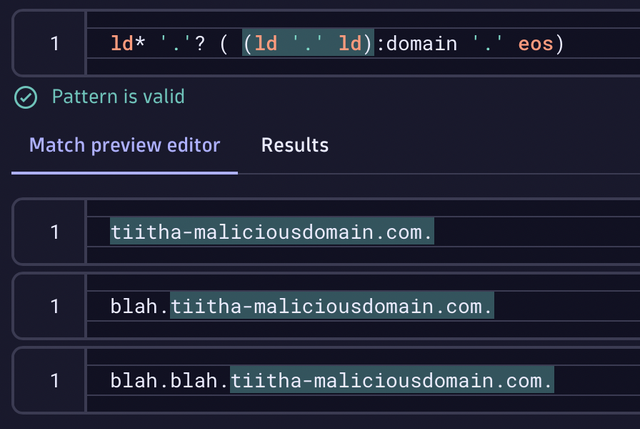
LD* '.'? ( (LD '.' LD):domain '.' EOS)That DQL pattern translates to something like this:
“Please extract two line-data (LD) portions from the content separated by a dot LD '.' LD) that is immediately followed by a single dot ('.') and then reaches the end of the string (EOS). A single dot and some line data might precede it.”
So, the pattern will match the highlighted DNS names below:
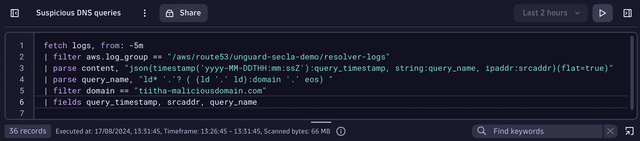
Adding a filter for the correct domain and limiting the query to only the last 5 minutes gives you the following DQL query to automate:
fetch logs, from: -5m
| filter aws.log_group == "/aws/route53/unguard-secla-demo/resolver-logs"
| parse content, "json{timestamp('yyyy-MM-DDTHH:mm:ssZ'):query_timestamp, string:query_name, ipaddr:srcaddr}(flat=true)"
| parse query_name, "ld* '.'? ( (ld '.' ld):domain '.' eos) "
| filter domain == "tiitha-maliciousdomain.com"
| fields query_timestamp, srcaddr, query_name
Automate the query
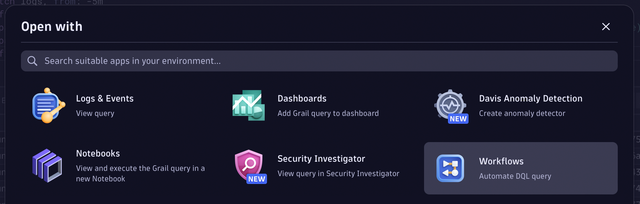
Dynatrace AutomationEngine provides the ability to automate such periodic query executions. When you’re satisfied with your DQL query and are ready to automate it, select the Open with button in the lower right-hand corner of the query window.
As a result, a modal dialog will display, providing you with different possibilities about where to open the DQL query. In the current use case, you should open the query in Workflows.
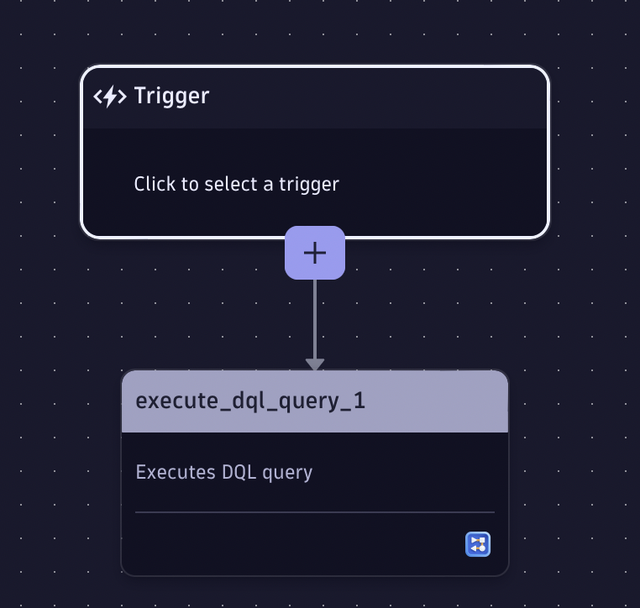
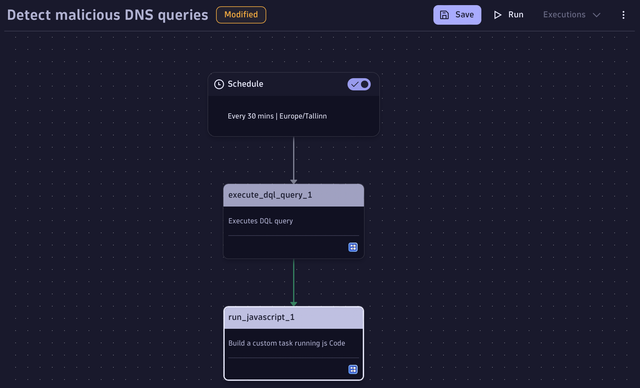
Modify the default workflow
To execute the workflow automatically every 5 minutes, change the default on-demand trigger to either a cron or time-interval trigger. You can easily achieve this by selecting the trigger box in Workflows and following the instructions in the right-hand pane. You can read more about workflow triggers in Workflow schedule trigger documentation
Ingest query results as security events
The simplest way to do this is to use Dynatrace OpenPipeline. OpenPipeline allows you to create custom endpoints for data ingestion and process the events in the pipeline (for example, adding custom pipe-dependent fields to simplify data analysis in a later phase).
Set up a custom pipeline
The best way to set up a security event ingestion to Dynatrace is via Dynatrace OpenPipeline. You can create your own ingest endpoint that will then perform custom processing activities, create additional fields, store these events in separate buckets, and much more. For the current use case, we can create a custom security event pipeline to which we can send all the automated security events we have created from the Security Investigator, add respective fields for future analysis, and store them in the default security events bucket.
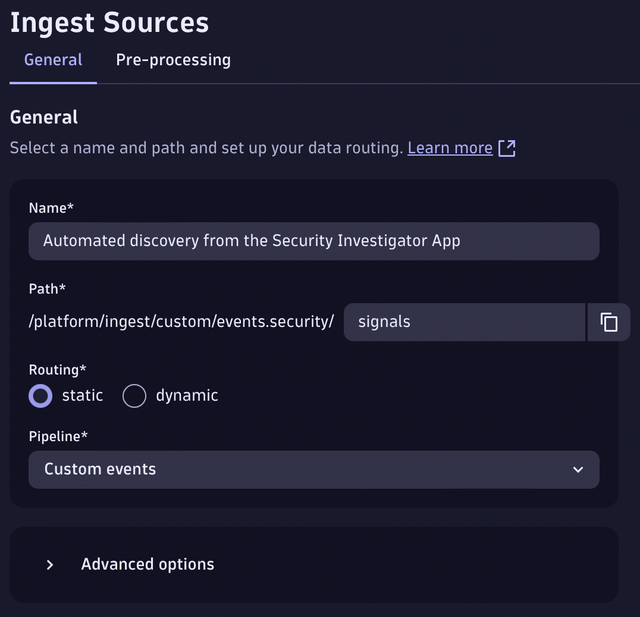
Now, create a general ingest endpoint for this use case and any automated detections we want to initiate from the Security Investigator in the future.
- Go to OpenPipeline.
- Choose Events > Security Events.
- On the Ingest Sources tab, select + Source.
- Give your pipeline a name, for example,
Automated discovery from Security Investigator. - Choose a path to the new ingest source, for example,
Signals. - Since we currently don’t want to create any dynamic rules to our pipeline, leave Routing set to static and choose the Custom events pipeline as the route.
- Go to the Pre-processing tab and add a new processor with the type Add Fields.
- Give the processor a name, for example,
My custom processor. - Add the fields that you want to be automatically added when an event passes the pipeline. In our case, we will add the following fields:
– kind == “SECURITY_EVENT”
– provider == “Automated Detection Script”
– category == “AUTOMATED_DETECTION”
– provider_product == “Security Investigator App” - To figure out which fields to add for custom security events, refer to the semantic dictionary.
Following the overall convention here will simplify analyzing this data later, together with other security events created by other sources.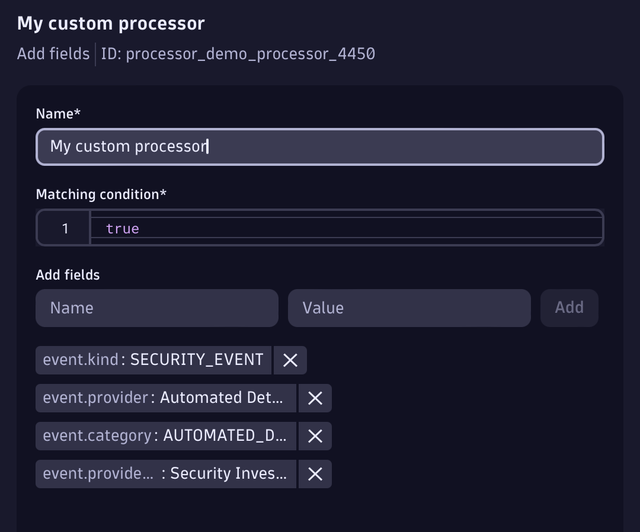
- You can test the processor with sample data to see what kind of event will be created based on the processor, and if you’re happy with the result, select Save.
For the current demo, this is enough, however, there are lots of things that you could configure additionally. Take a look at the Ingest custom security events via API documentation to learn more about sending security events to OpenPipeline.
Create and secure the token for event ingest
To create the token needed to ingest events, follow the steps in How to ingest data (events) documentation. When you have created the token, we recommend that you protect it in the Credential Vault instead of just using it in plain text in the automation engine.
- Open Credential Vault.
- Select Add new credential.
- Select token as the credential type and give it a meaningful name.
- Select App Engine as the credential scope.
- Paste your ingest token into the token field and select Save.
After saving the credentials, an ID is presented to you in the form of CREDENTIALS_VAULT-12345. Write this down for later usage.
Ingest records through the OpenPipeline custom endpoint
Let’s return to our workflow and add a follow-up task for the DQL query. Choose the JavaScript task type and start writing the code to ingest security events.
Consider the following code for your function:
import { execution } from '@dynatrace-sdk/automation-utils';
import { credentialVaultClient } from '@dynatrace-sdk/client-classic-environment-v2';

export default async function ({ execution_id }) {

  const ex = await execution(execution_id);

  // load the token from the credential vault by its' ID
  const token = await credentialVaultClient.getCredentialsDetails({
    id: "CREDENTIALS_VAULT-F12345",
  }).then((credentials)=> credentials.token);

  // loop through the DQL query results and ingest them one by one
  var result = await ex.result('execute_dql_query_1');
  result.records.forEach (record => {
    ingest_event(token, record);
  });
}

async function ingest_event(token, payload) {

  payload["event.description"] = "Suspicious DNS query from AWS DNS Logs";

  fetch('https://<dynatrace_env>.dynatrace.com/platform/ingest/custom/events.security/signals', {
    method: 'POST',
    headers: {
      "Content-Type": "application/json; charset=utf-8",
      "Authorization": `Api-Token ${token}`
    },
    body: JSON.stringify(payload)
  }).then(function(response) {
    console.log(response);
  })
}
The code loads the token from the Credential Vault that will be used to ingest the events to OpenPipeline. Then, we iterate through the result set we got from the execute_dql_query_1 task and pass each event along with the ingest token to the ingest function, which will POST the event to the OpenPipeline ingest endpoint that we created earlier. The response to the request is shown in the console for debugging purposes.
We’re also adding a custom field called event.description to the event. You can add custom fields to your event from the OpenPipeline processing as well, but since we want to keep the ingest source as general as possible, it makes more sense to add the event-specific fields near the event, not the pipeline.
Now, give it a distinct name and test if it runs perfectly. Ingesting events to Grail via OpenPipeline should result in a status: 202 that is visible in the run_javascript_1 log console.
Fetch the security events from Grail
To view the newly created security events, follow the same principles as with fetching any other security data from Grail. Using the following DQL query, you can see all the events you have started to ingest:
fetch events
| filter event.kind == "SECURITY_EVENT"
| filter event.category == "AUTOMATED_DETECTION"
To feel the power of the semantic dictionary and to illustrate what you gain from using it, consider the following query. If you want to visualize all the security events ingested to Grail over the last 12 hours by event.category, it is quite simple with the following query thanks to the unified field names:
fetch events, from: -12h
| filter event.kind == "SECURITY_EVENT"
| makeTimeseries count(), by: { event.category }, interval:1h
The result could be a line chart like this:
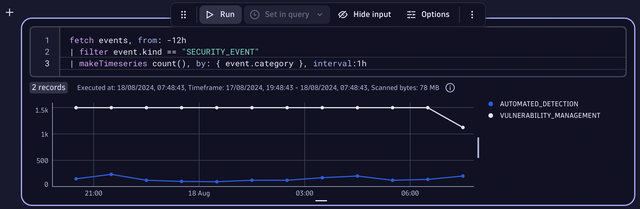
Of course, you can follow your own naming convention, but this would make it much harder to view all the security events (both custom and Dynatrace-created events) in conjunction.
Operationalize the results
You can create additional workflows for your security events in Grail. For example, you can create a workflow that notifies you in Slack when a new event is created or integrate your workflows with Jira to create a ticket every time such events arise.
You can create a custom integration to your own SIEM system (similarly as we did for the OpenPipeline) for events that can enrich your security data in other environments. Consider your use case and work processes to determine the best way to approach security events available in Grail.


Looking for answers?
Start a new discussion or ask for help in our Q&A forum.
Go to forum