For deep visibility into your code running in Azure Functions, Dynatrace announces the General Availability of support for both the 2.x and 3.x runtime versions of Azure Functions running in an Azure App Service plan.
As companies strive to innovate and deliver faster, modern software architecture is evolving at near the speed of light. Following the innovation of microservices, serverless computing is the next step in the evolution of how applications are built in the cloud. Serverless computing is a computing model that “allows you to build and run applications and services without thinking about servers.”
Despite its benefits, serverless computing introduces additional monitoring challenges for developers and IT Operations, particularly in understanding dependencies and identifying issues in the end-to-end traces that flow through a complex mix of dynamic and hybrid on-premise/cloud environments. This lack of visibility creates blind spots and makes it difficult to ensure the health of applications running on serverless technologies.
AI-powered observability and end-to-end tracing of serverless applications
Dynatrace is thrilled to announce the General Availability of support for both the 2.x and 3.x runtime versions of Azure Functions running in an Azure App Service plan. This gives you deep visibility into your code running in Azure Functions, and, as a result, an understanding of its impact on overall application performance and user experience.
This release is just the latest addition to advanced observability for cloud-native technologies offered by the Dynatrace Software Intelligence Platform, which provides the fastest and easiest approach to end-to-end monitoring and tracing of web applications on serverless technologies like Azure Functions, Azure App Service, or AWS Lambda.
Azure Functions in a nutshell
Azure Functions is the serverless computing offering from Microsoft Azure. It allows for the breaking up of heavy monolithic architectures into multiple serverless “functions.” These functions are usually triggered by events, therefore, Microsoft Azure is also commonly described as “event-driven FaaS.” With Azure Functions, engineers don’t have to worry about provisioning and maintaining underlying hardware; they simply upload their code, and it’s up and running seconds later.
Regardless of your business use case or trigger, you want to make sure that your serverless applications are performing as expected, and this is where Dynatrace comes into play. If you’re building large applications based on Azure Functions architecture, then Azure Functions monitoring with Dynatrace helps you to:
- Optimize response-time hotspots
- Optimize timing hotspots
- Simplify error analytics
- Understand and optimize your architecture
Monitor your serverless applications with just two clicks
Dynatrace Azure Functions monitoring comes with a seamless deployment experience, allowing you to install the Site Extension with just two clicks and zero configuration. In addition, automatic service detection is in place, working across all languages and triggers—timer, Service Bus, and HTTP triggers are all supported. Code-level visibility continues to be supported for .NET-based functions running in an App Service plan.
Comprehensive observability that goes beyond API integration
Dynatrace provides comprehensive observability, leveraging OneAgent instrumentation and the Azure Monitor API. The main advantage of this approach is that you can monitor your Azure Function application just as you would any other .NET application and get end-to-end code-level visibility and insights into transactions.
Read on below to explore all the benefits of Dynatrace monitoring by examining our demo Azure Functions application. The application validates credit card numbers entered in our EasyTravel application. A function is triggered whenever a validation request appears in an Azure Service Bus Queue. The function checks the credit card and returns the results.
Optimize your code with code-level visibility
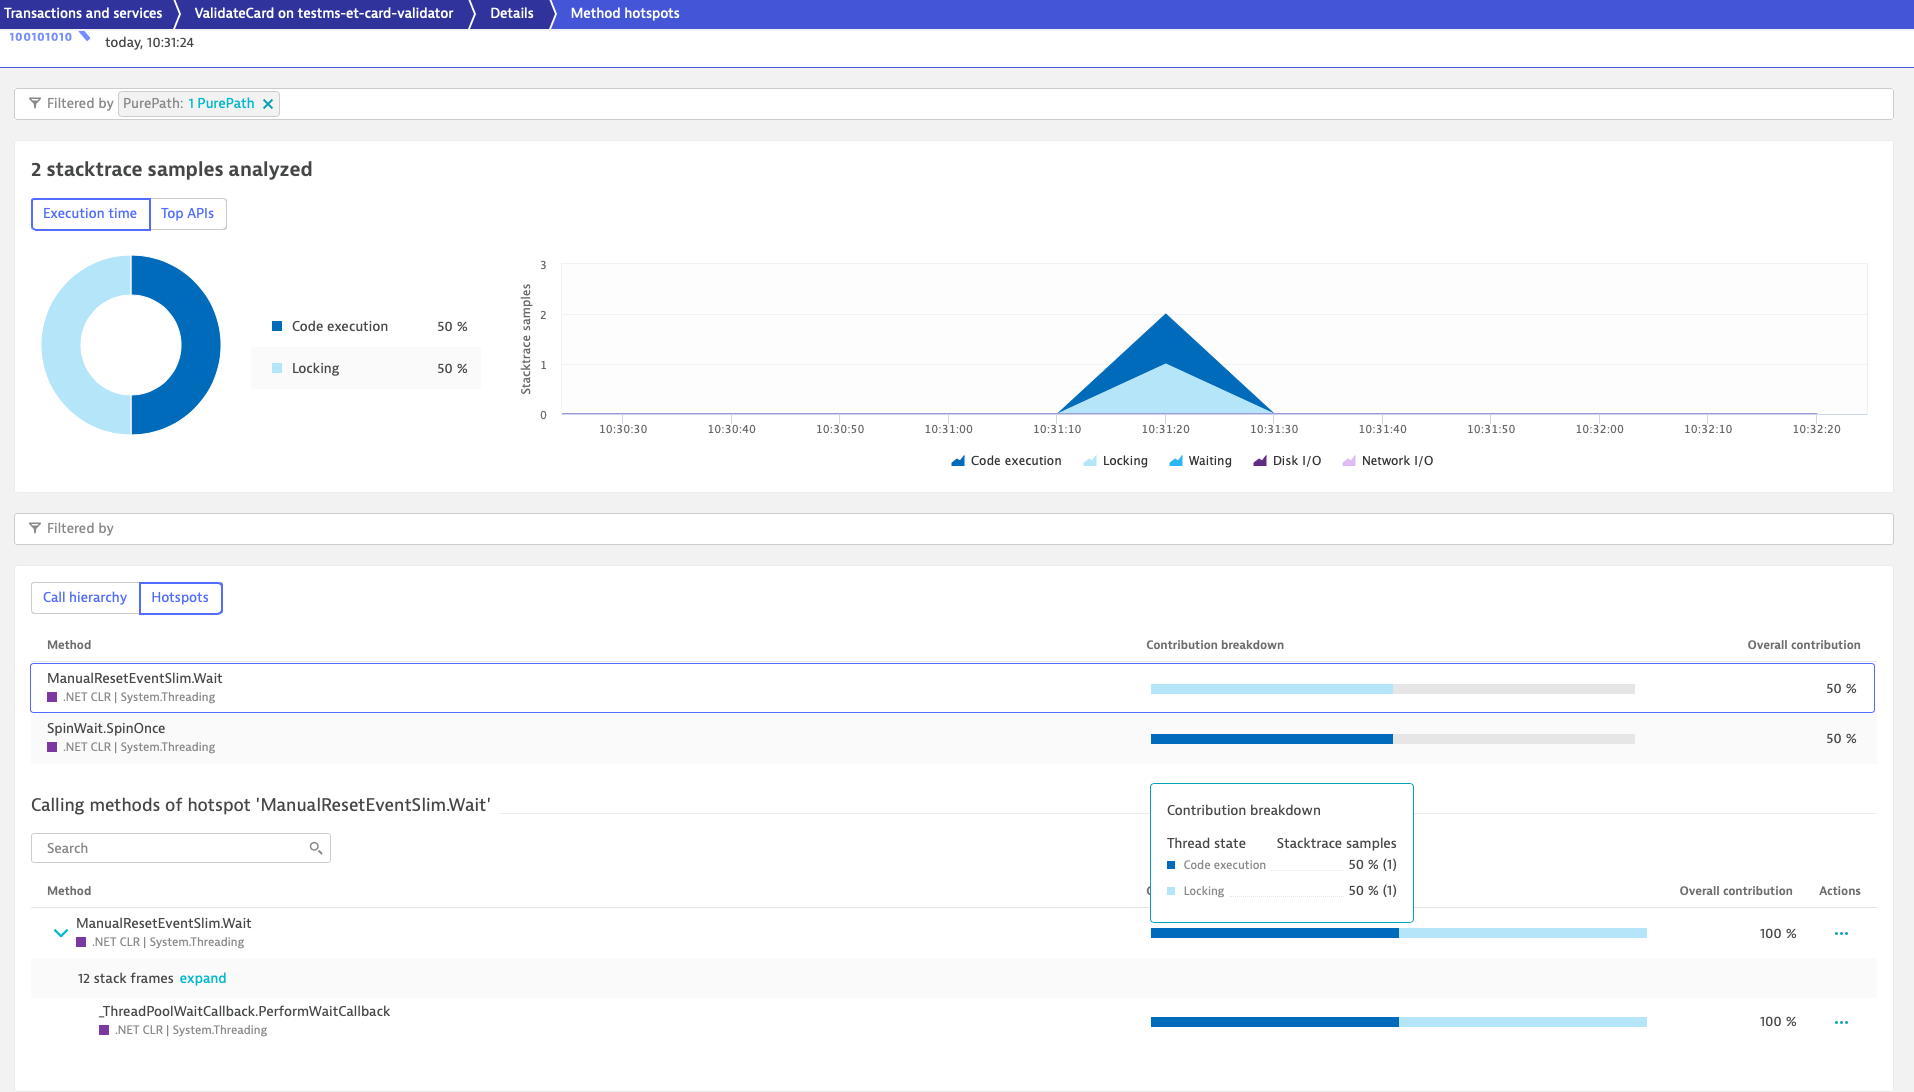
If you check the Method hotspots for an Azure Function service, you can easily see the methods that were executed to run the service. In the Contribution breakdown, you get insights into how many times a method has been executed for the service within the selected timeframe. From here, you can easily see the method that’s consuming the most execution time, and, with this knowledge, optimize your code with a single click.
Instantly see why a request is slow
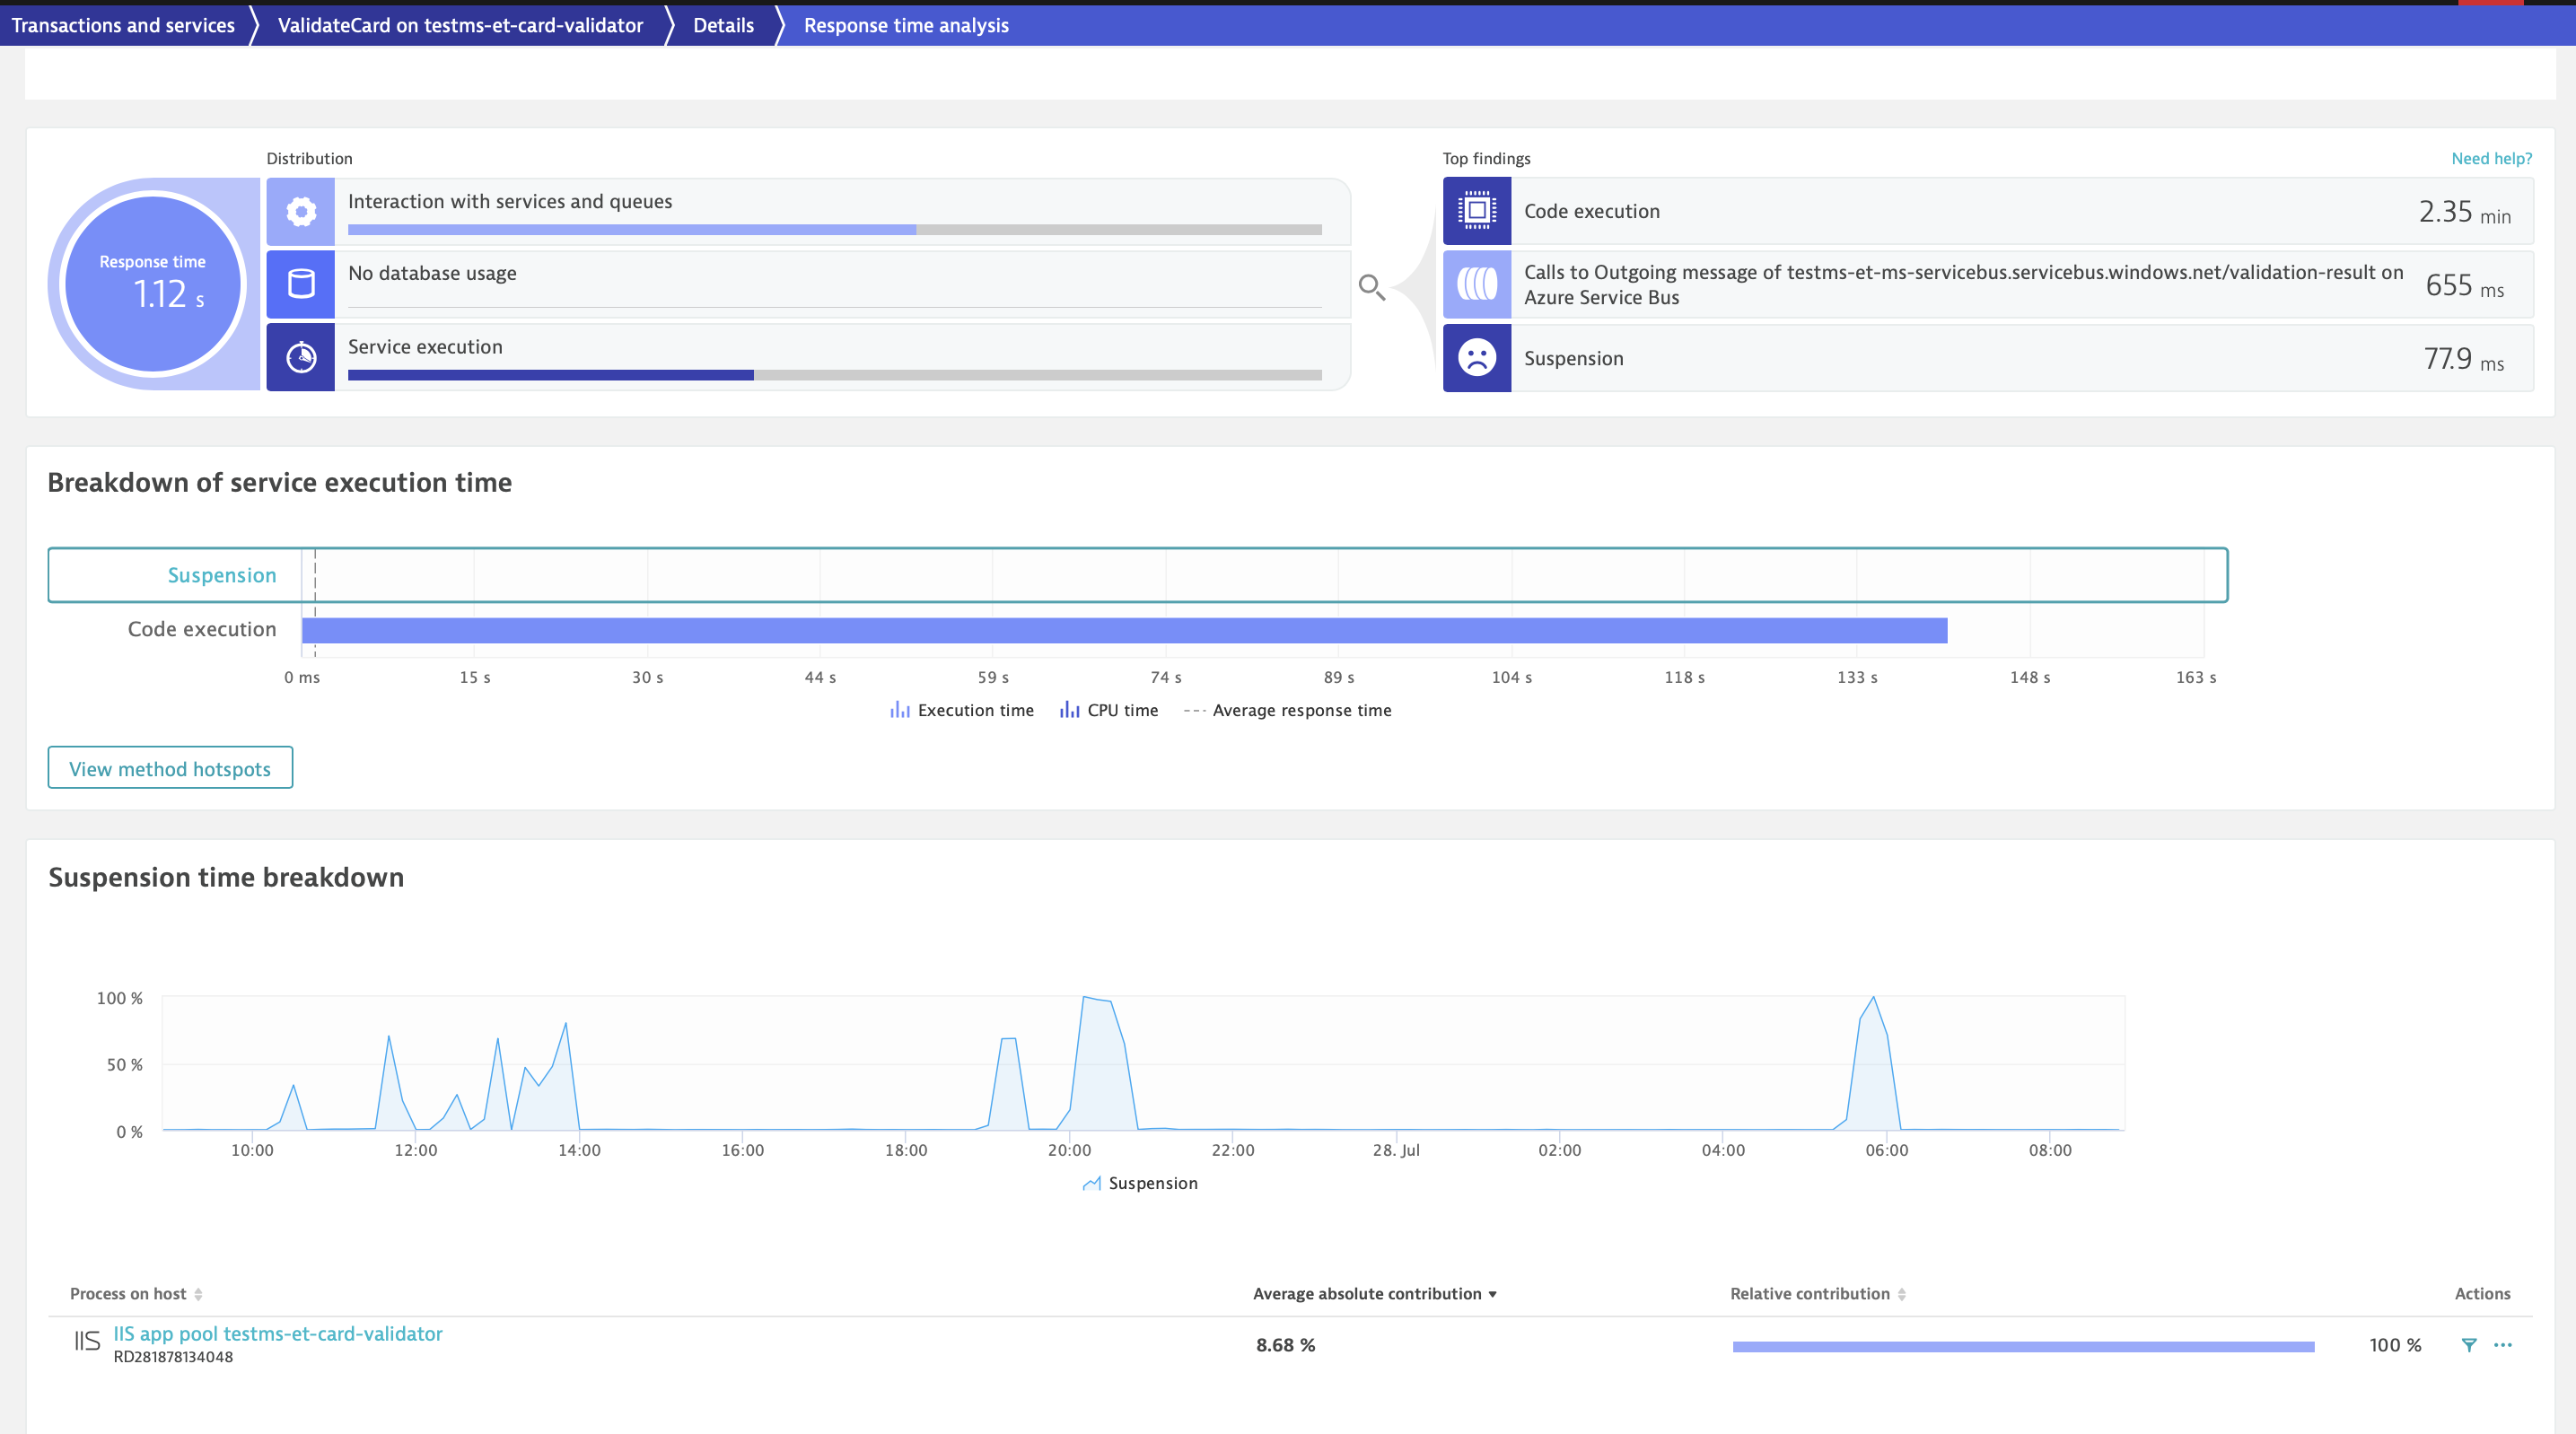
Find out why your request is slow with top findings automatically analyzed and presented by Dynatrace.
Understand transactions end to end with Service flow
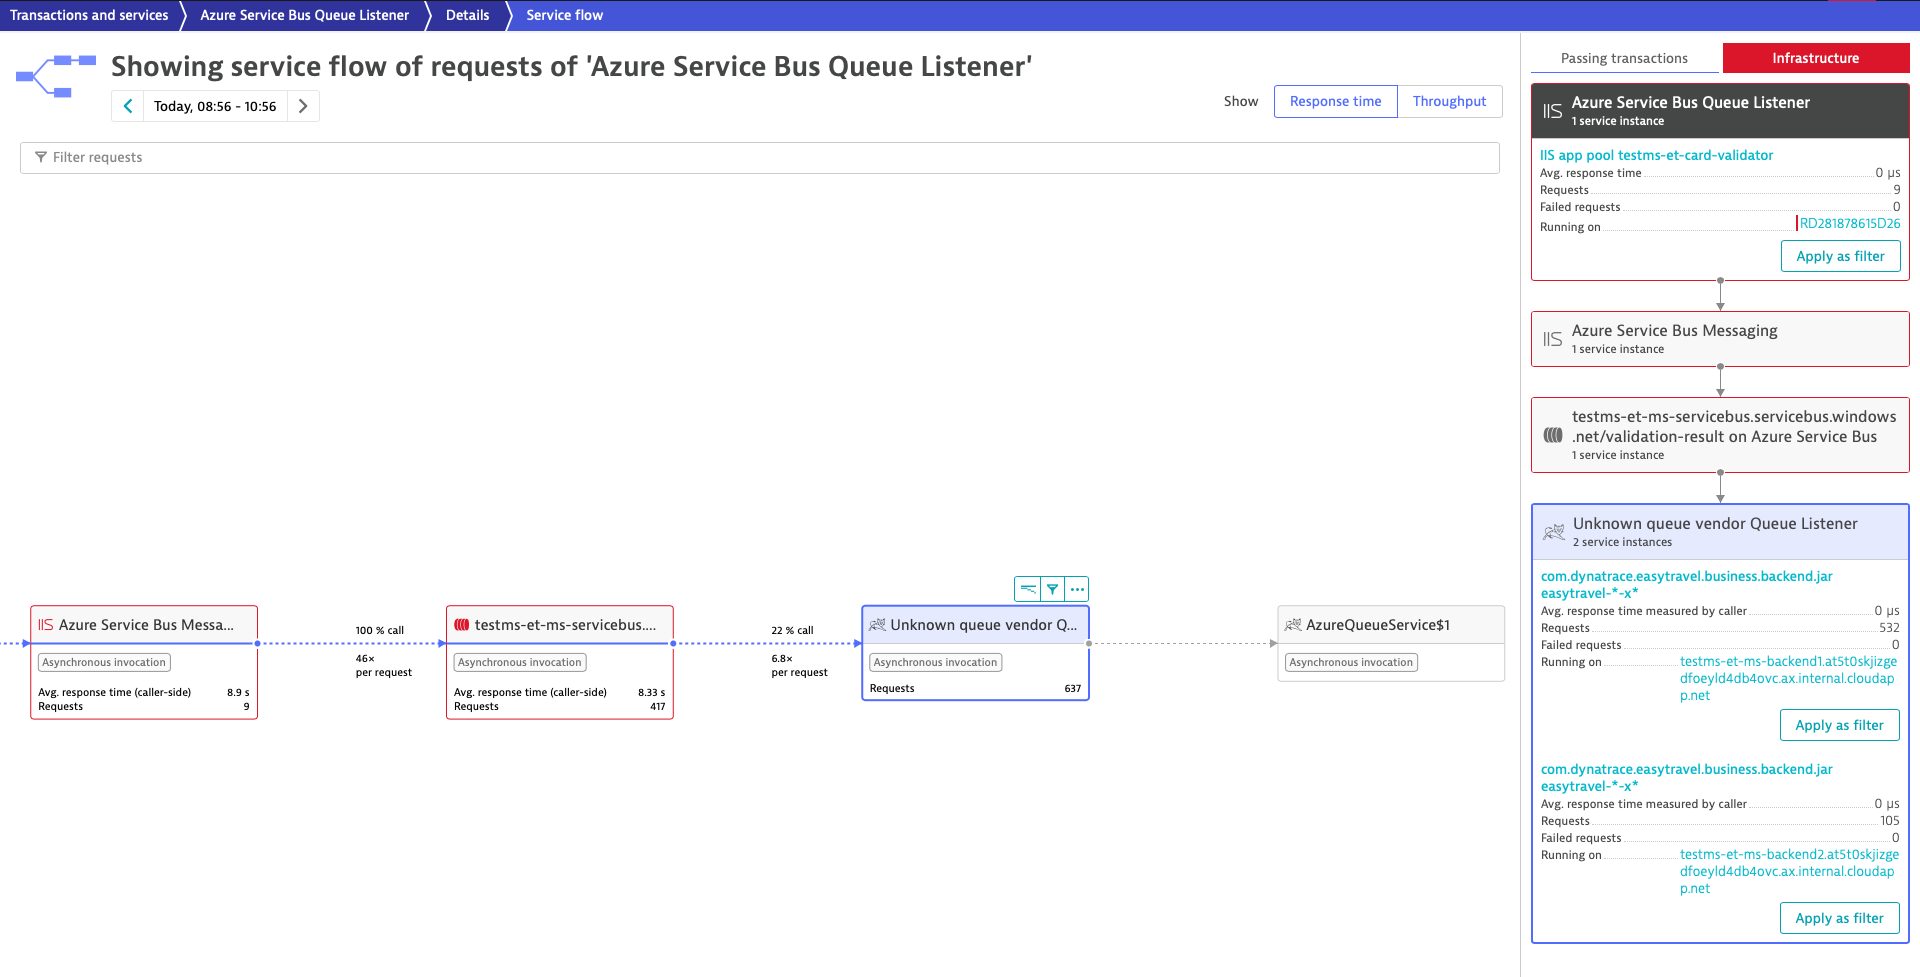
With Dynatrace, you can easily understand application transactions end to end by looking at the sequence of service calls made when your function was triggered. Each serverless application can be composed of multiple Azure Function applications, each composed of many functions, so understanding the service flow is key.
Single pane of glass across all serverless-function applications
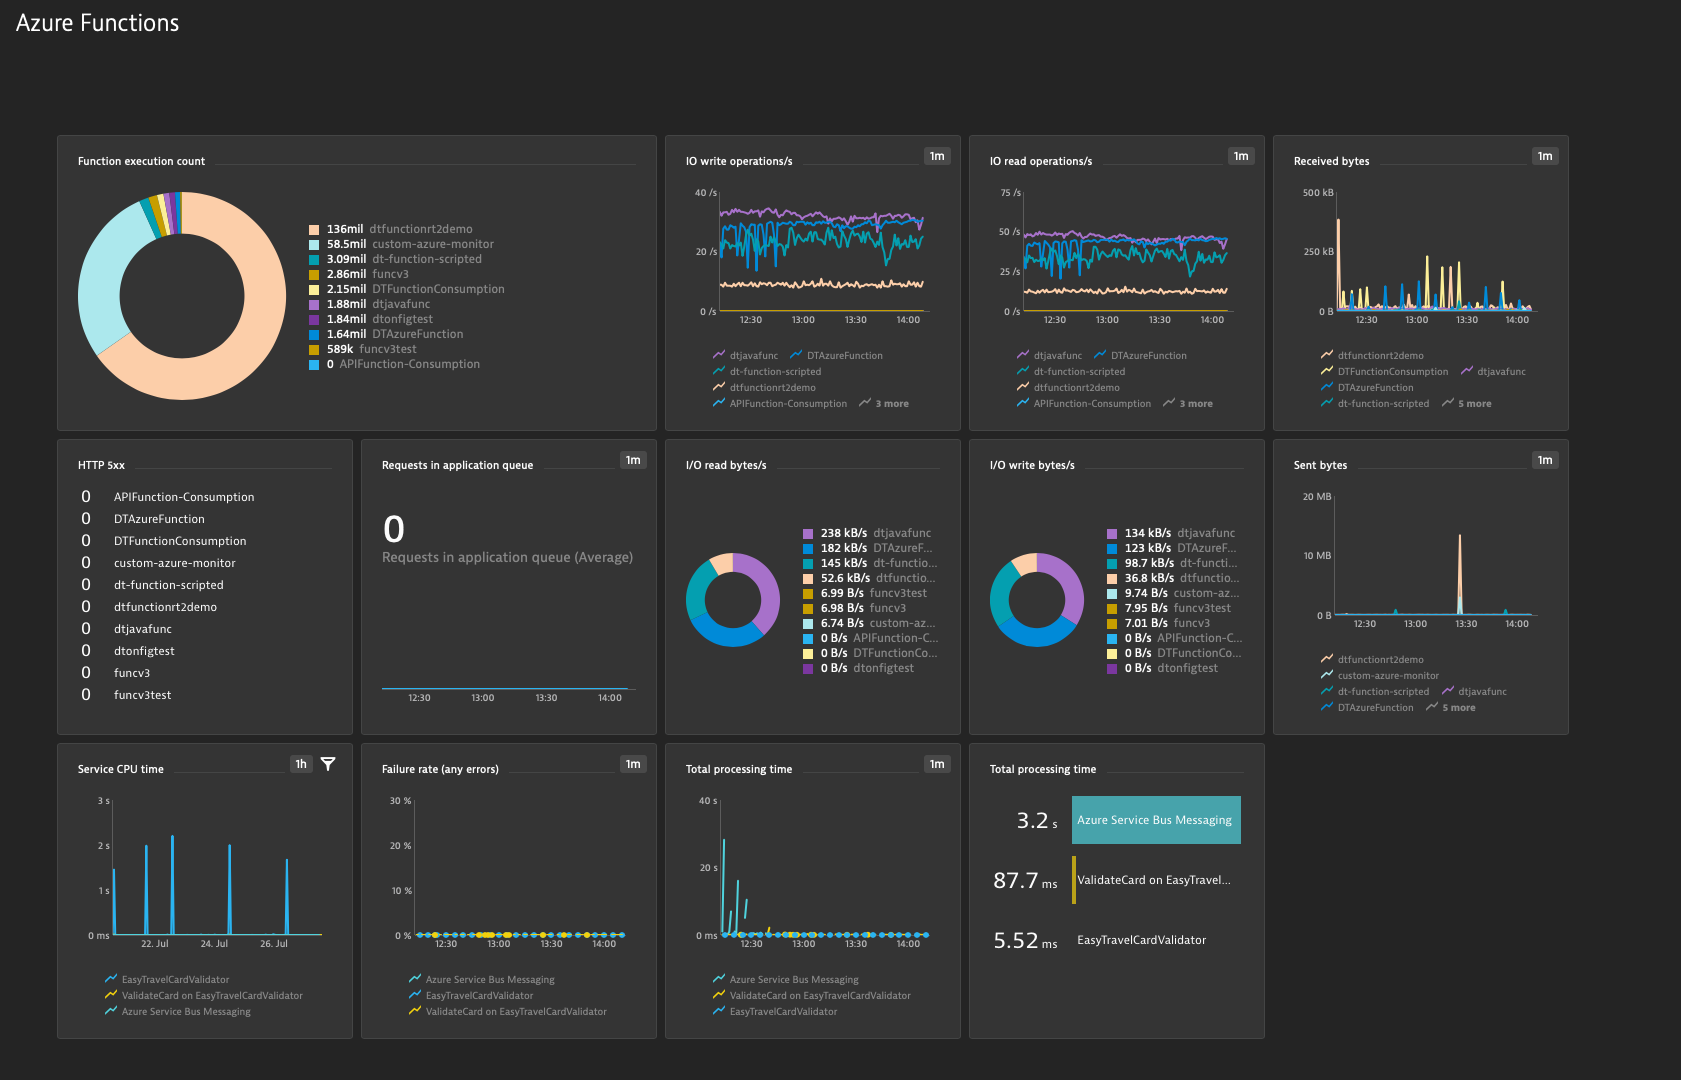
Here’s a sample dashboard built to offer a single pane of glass across all serverless-function applications. Whether your data source is the API or OneAgent, you get the same visibility into the most critical performance metrics. You can find out which functions experience the highest failure rate or processing time and which of them are executed the most.
See how everything works together—automatically
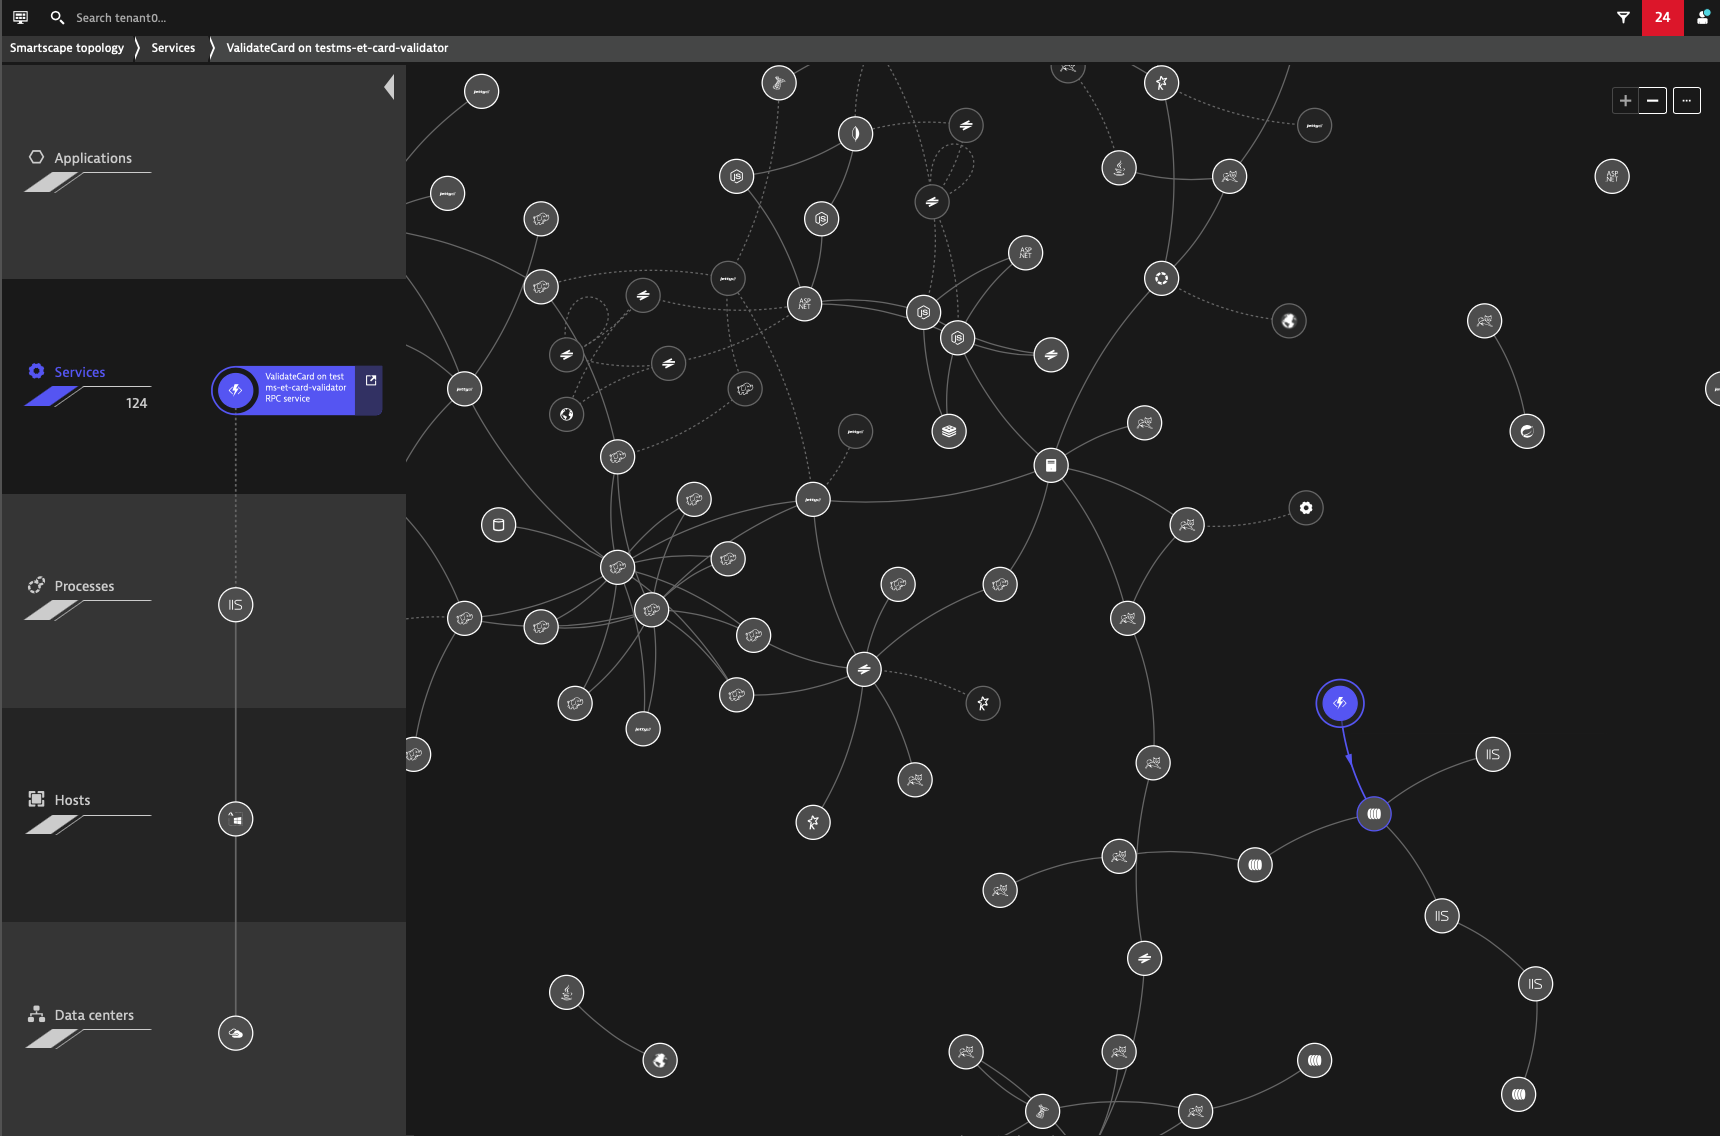
Dynatrace interactive Smartscape visualization shows you the dynamic relationships among all application components across every tier, including your serverless functions.
From here, you can automatically jump to any service or function, automatically see performance anomalies, and get insights into the root causes of anomalies as well as the affected entities.
Get started
Dynatrace provides an Azure Site Extension to install OneAgent on Azure Functions. For complete details, see our Help page for deploying OneAgent on Azure Functions.
What’s next
In the coming months, we’ll be making enhancements to our serverless monitoring capabilities, including support for Linux web applications. So stay tuned!


Looking for answers?
Start a new discussion or ask for help in our Q&A forum.
Go to forum