Having already introduced Google Core Web Vitals in Dynatrace for Real User Monitoring web and Synthetic Monitoring, we're excited to announce full support for Google’s Core Web Vital metrics with Dynatrace version 1.210.
Particularly during the COVID-19 pandemic, we’ve seen how poor application performance can impact business bottom lines and lead to lost revenue for many organizations, as laid out in our recent blog post about digital experience. To provide “quality signals that are essential to delivering a great user experience on the web,” Google introduced their Core Web Vitals initiative last year, advocating the Largest contentful paint, Cumulative layout shift, and First input delay metrics. Google recently included these metrics as “user experience signals” in their search result rankings, demonstrating that these metrics aren’t just nice to have but are a necessity.
While the information provided by Google Core Web Vitals is certainly valuable, it leaves you to resolve any high-level issues that are reported by tools such as the Google Search Console without giving you the option of drilling into details or seeing necessary context information across your application front and back ends.
Read on to understand why the Google Search Console is a great place to start but why you also need to understand how you can use Dynatrace Digital Experience Monitoring (DEM) to get valuable context information that you can proactively act on. Dynatrace is the leader in this space, giving you the ability to see business outcomes and monitoring data in the same distributed trace, capturing all details from each user click down to each database call, and using the Dynatrace Davis AI causation engine to identify the actual root causes of issues.
Google Search Console is a great place to start but it leaves you with more questions than answers
As a product manager or application owner, you care a lot about how discoverable your business is on Google. Therefore, SEO and improving your search rankings should be high on your agenda.
To get started, you might use the Google Search Console and select the Core Web Vitals tab. Browsing through this section, you can check the report for each Core Web Vital metric that requires action and view all the individual URLs that are affected. You have two options for each URL:
- You can visit a URL in the browser to better identify the page in question.
- You can jump to PageSpeed insights, analyzing the URL in a single run.
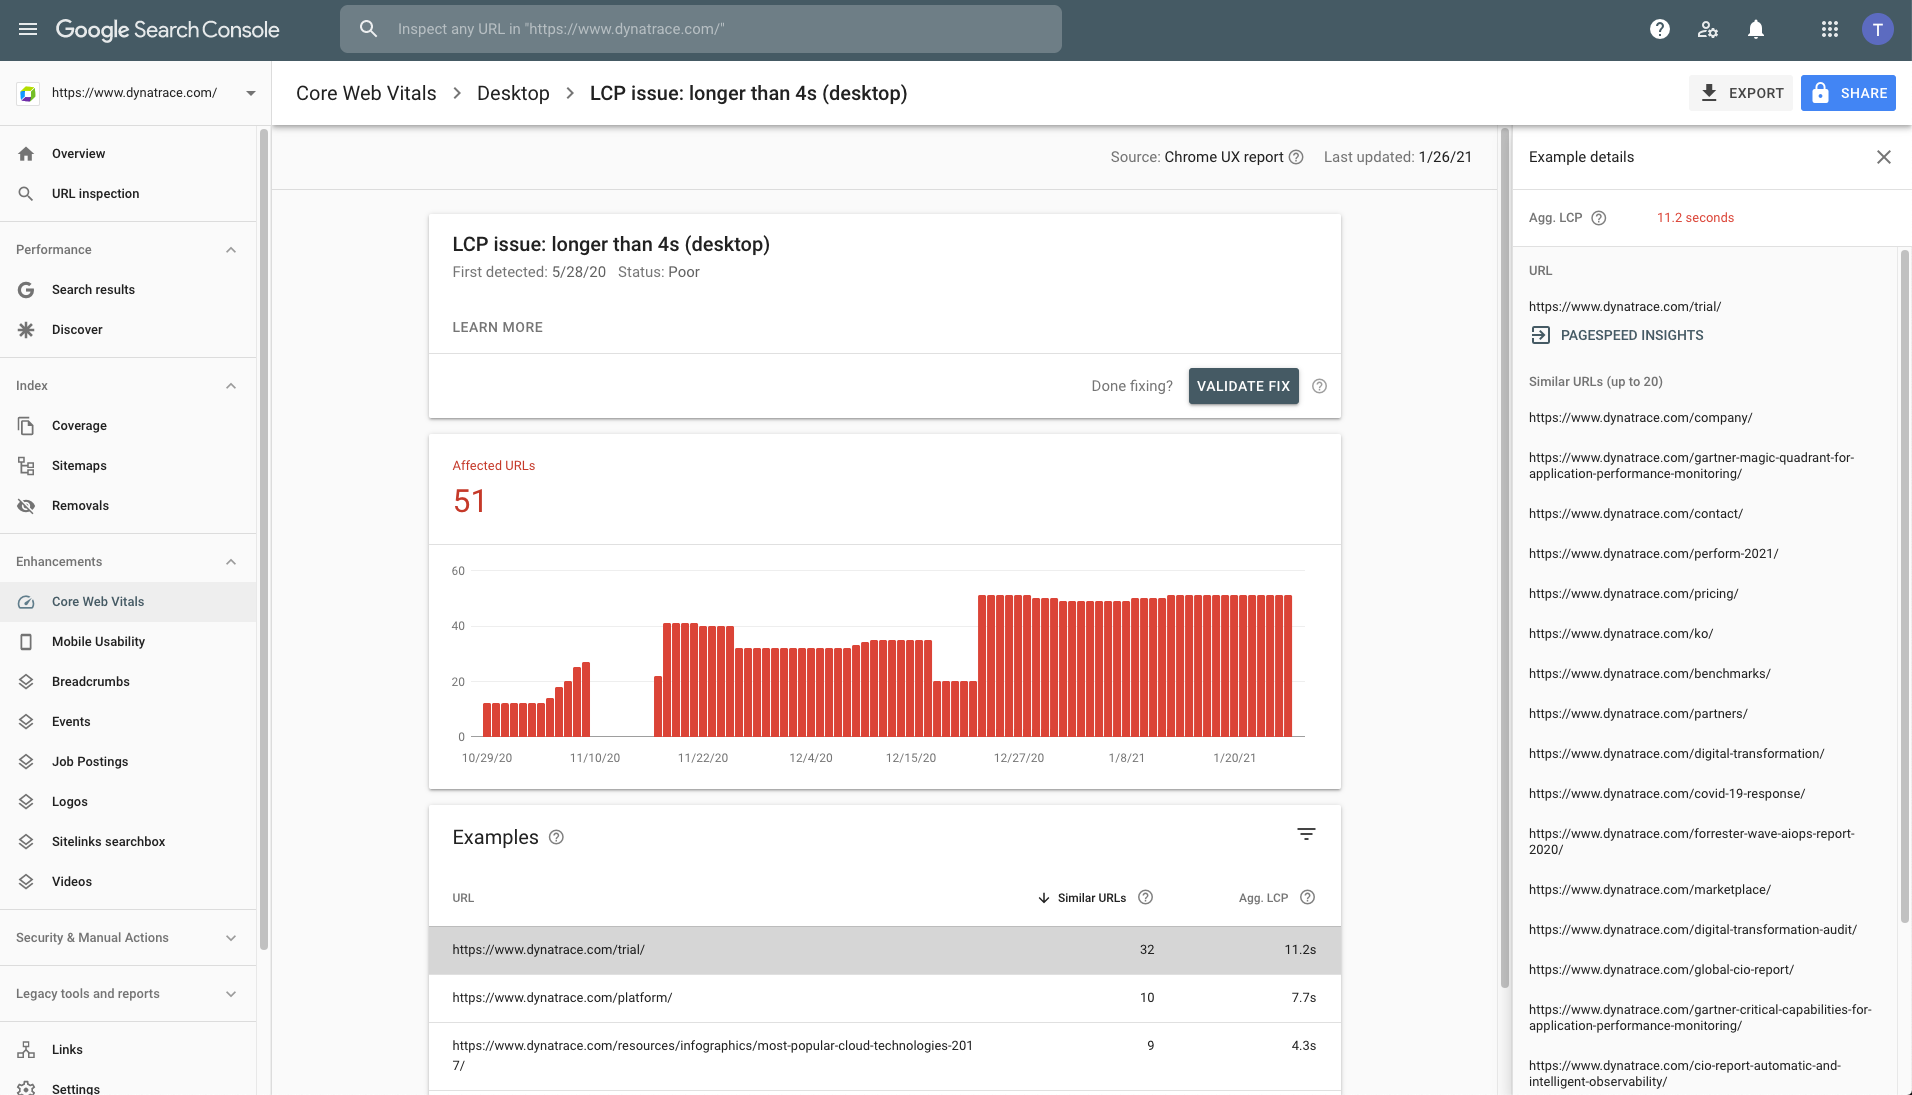
While all this is certainly valuable, it leaves you with:
- Aggregated field metrics rather than valuable details from single instances.
You might wonder, what about details of the requests made on this page? Which of them is slow?
- Metrics and recommendations rather than helpful context information.
You won’t know, for example, whether your 75th-percentile value for Largest contentful paint (LCP) is the result of some users experiencing slow resources because of a CDN issue or a poorly performing service in your back end.
- Ex-post information rather than ex-ante insights to act on proactively.
PageSpeed insights has never been straightforward enough to use with non-public development or staging environments. Therefore, you often end up reacting to changes that are introduced with a release.
Dynatrace complements Google Core Web Vital measurements with insights across your application front and back ends
With zero configuration, you can leverage all three Core Web Vital metrics in Dynatrace and get details with just a few clicks:
- Largest contentful paint (for load actions in RUM and Synthetic Monitoring) provides you with an indication of how fast your page is loading.
- First input delay (for load actions in RUM) gives you an idea of how interactive your page loads are.
- Cumulative layout shift (for load actions in RUM and Synthetic Monitoring) offers you the means to understand whether elements on your page are stable through the page load process.
In the following sections of this blog post we’ll explain how you can:
- Unleash Core Web Vitals by defining them as key performance metrics.
- Analyze the Core Web Vitals in session detail pages and use them in USQL.
- Improve Core Web Vitals timings using Synthetic Monitoring.
Note: Check out our blog post on Core Web Vitals, which provide you with detailed guidance how you can these metrics in RUM web and Synthetic Monitoring.
Unleash Core Web Vitals by defining them as key performance metrics
After gathering your valuable feedback and Google’s recent announcement, we decided to integrate the Core Web Vital metrics more deeply into Dynatrace RUM and Synthetic Monitoring to acknowledge their importance. So we’ve accorded them full key performance metric status, allowing you to:
- Define them as such for browser monitors, applications, and single key user actions.
- Leverage Google’s predefined thresholds for your Apdex calculation.
- Automatically capture long-term data for all three metrics.
- Fetch each of the three metrics via the Metrics API and query them with USQL.
- Create custom alerts for Core Web Vitals.
- Create dashboards based on these out-of-the-box metrics in custom charting and the new Data explorer.
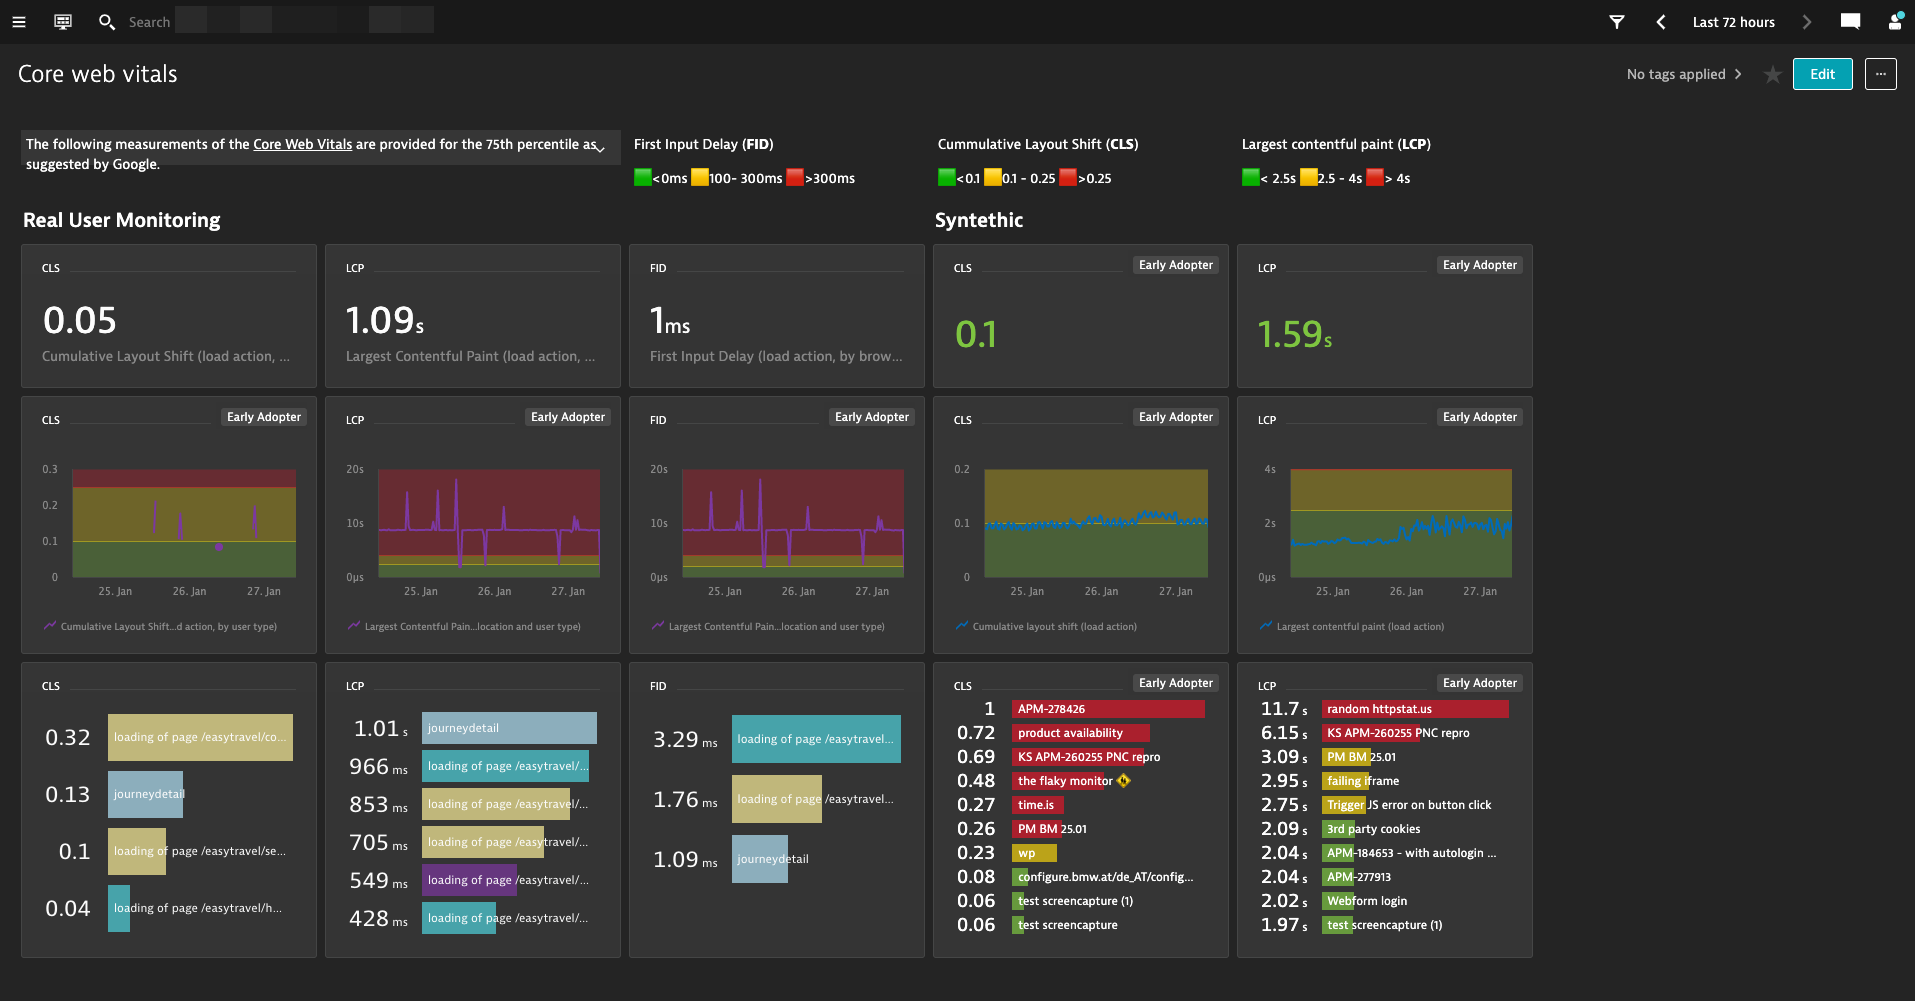
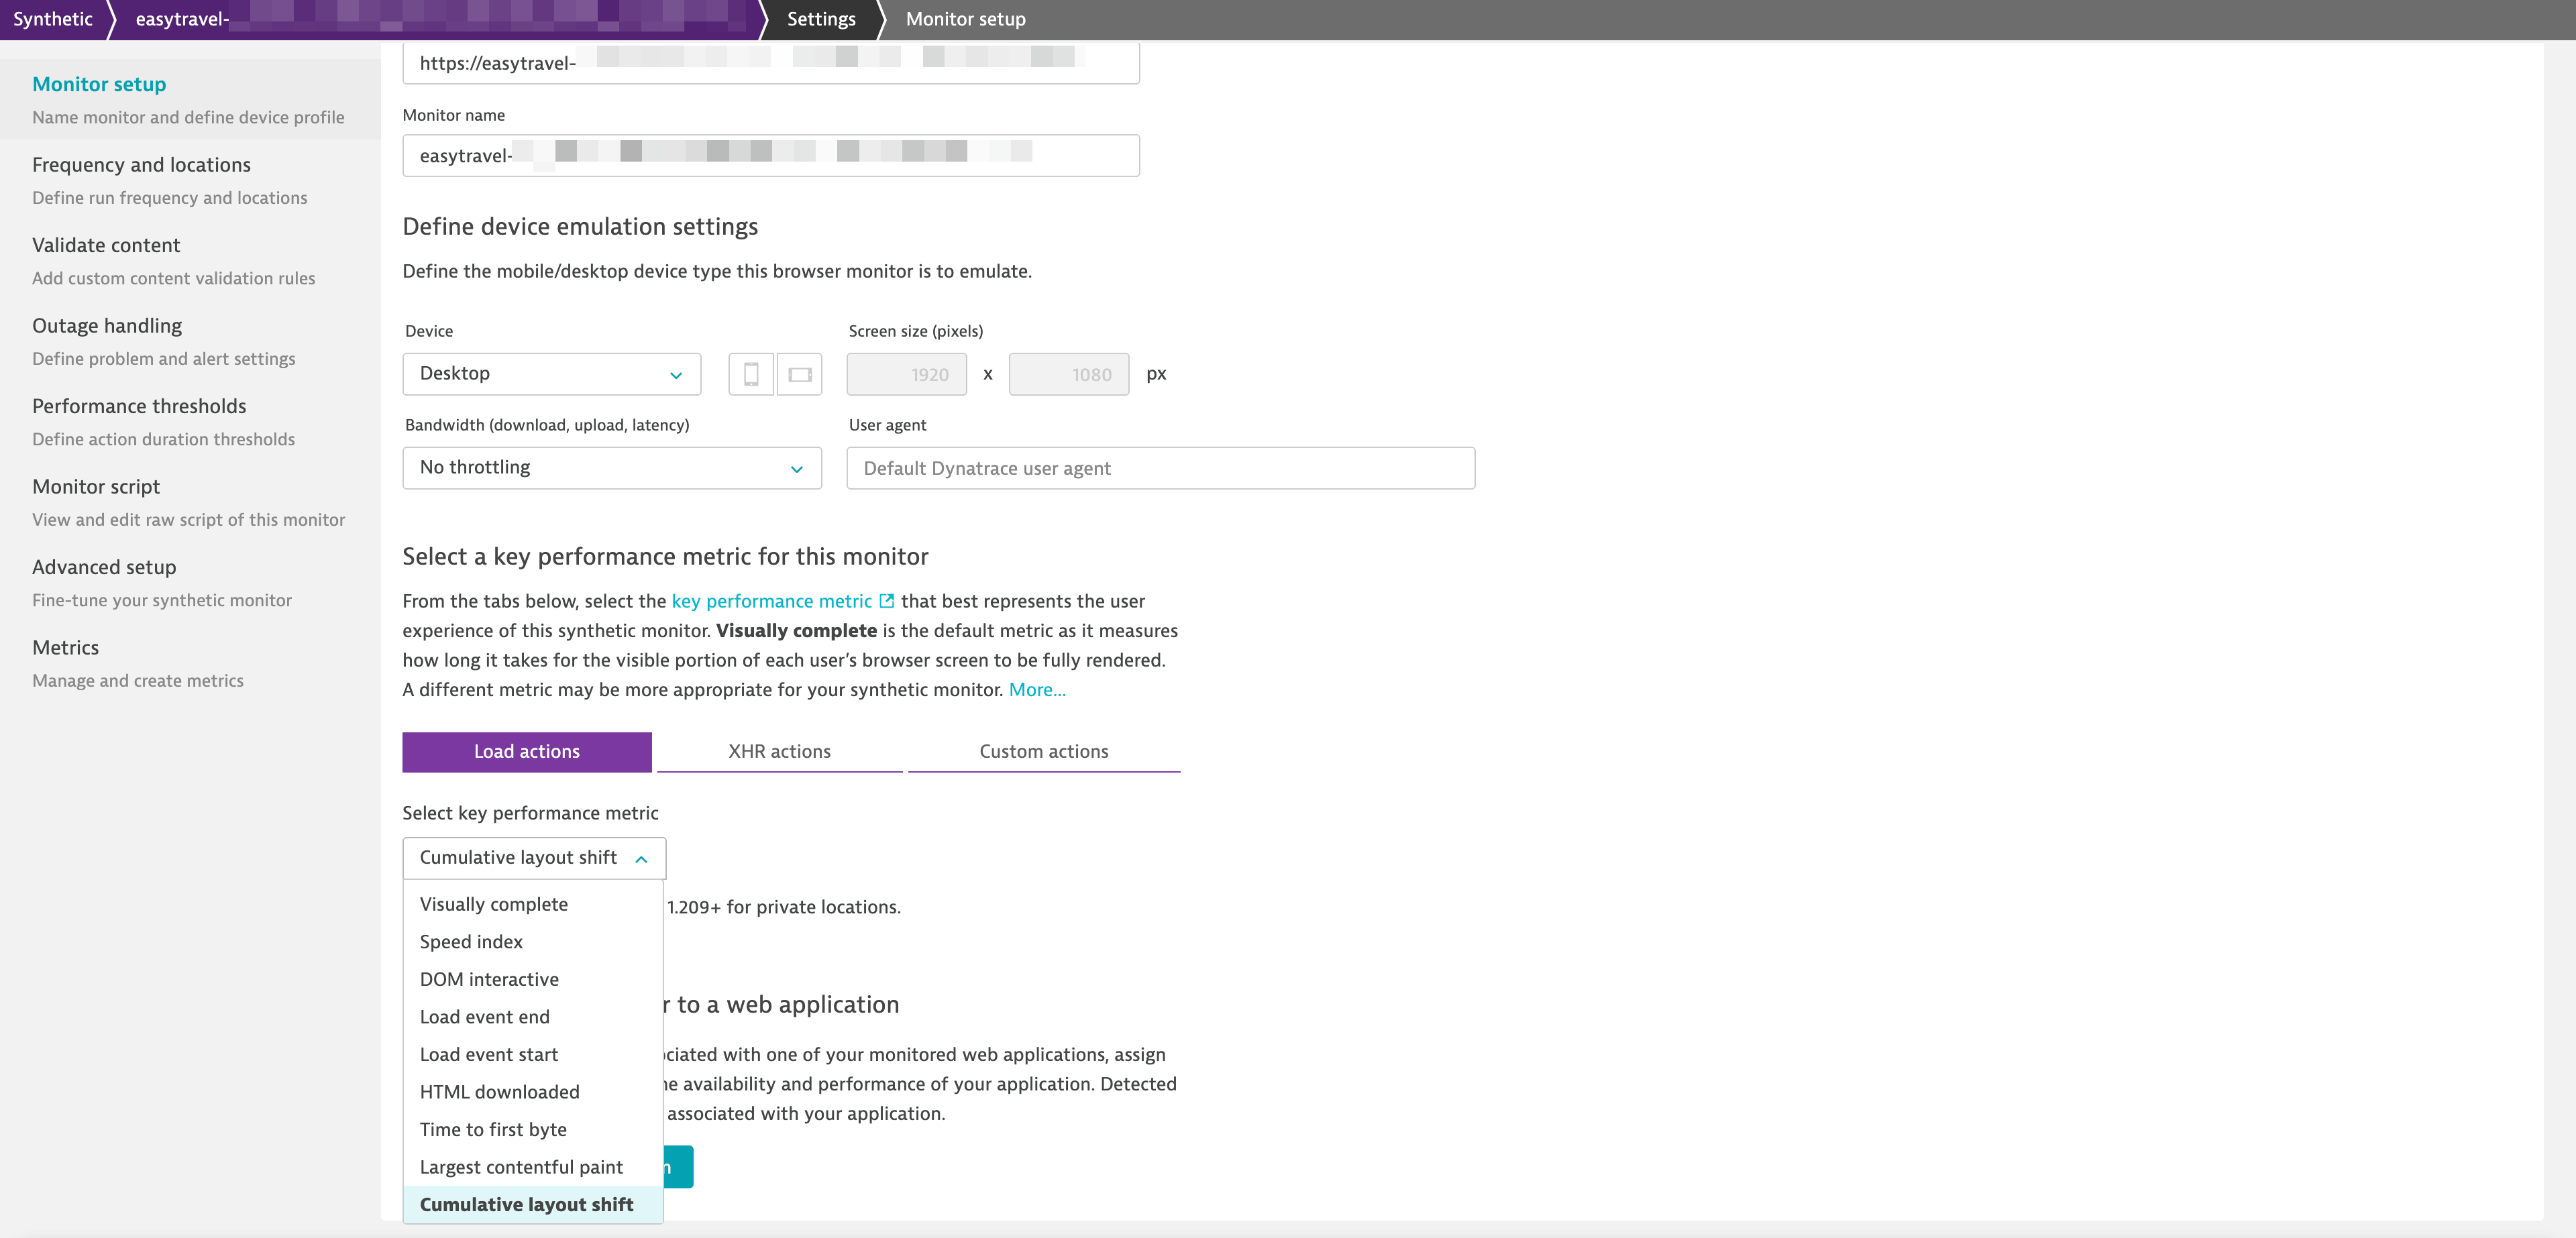
To get started, pick any of the Web Vitals as a Key Performance metric in the RUM General Application settings. Or, for a synthetic browser monitor, configure Largest contentful paint or Cumulative layout shift as key performance metrics in the Monitor Setup tab of monitor settings.
From here on, the Davis AI has you covered and will automatically baseline your selected Core Web Vital and detect anomalies in the metric.
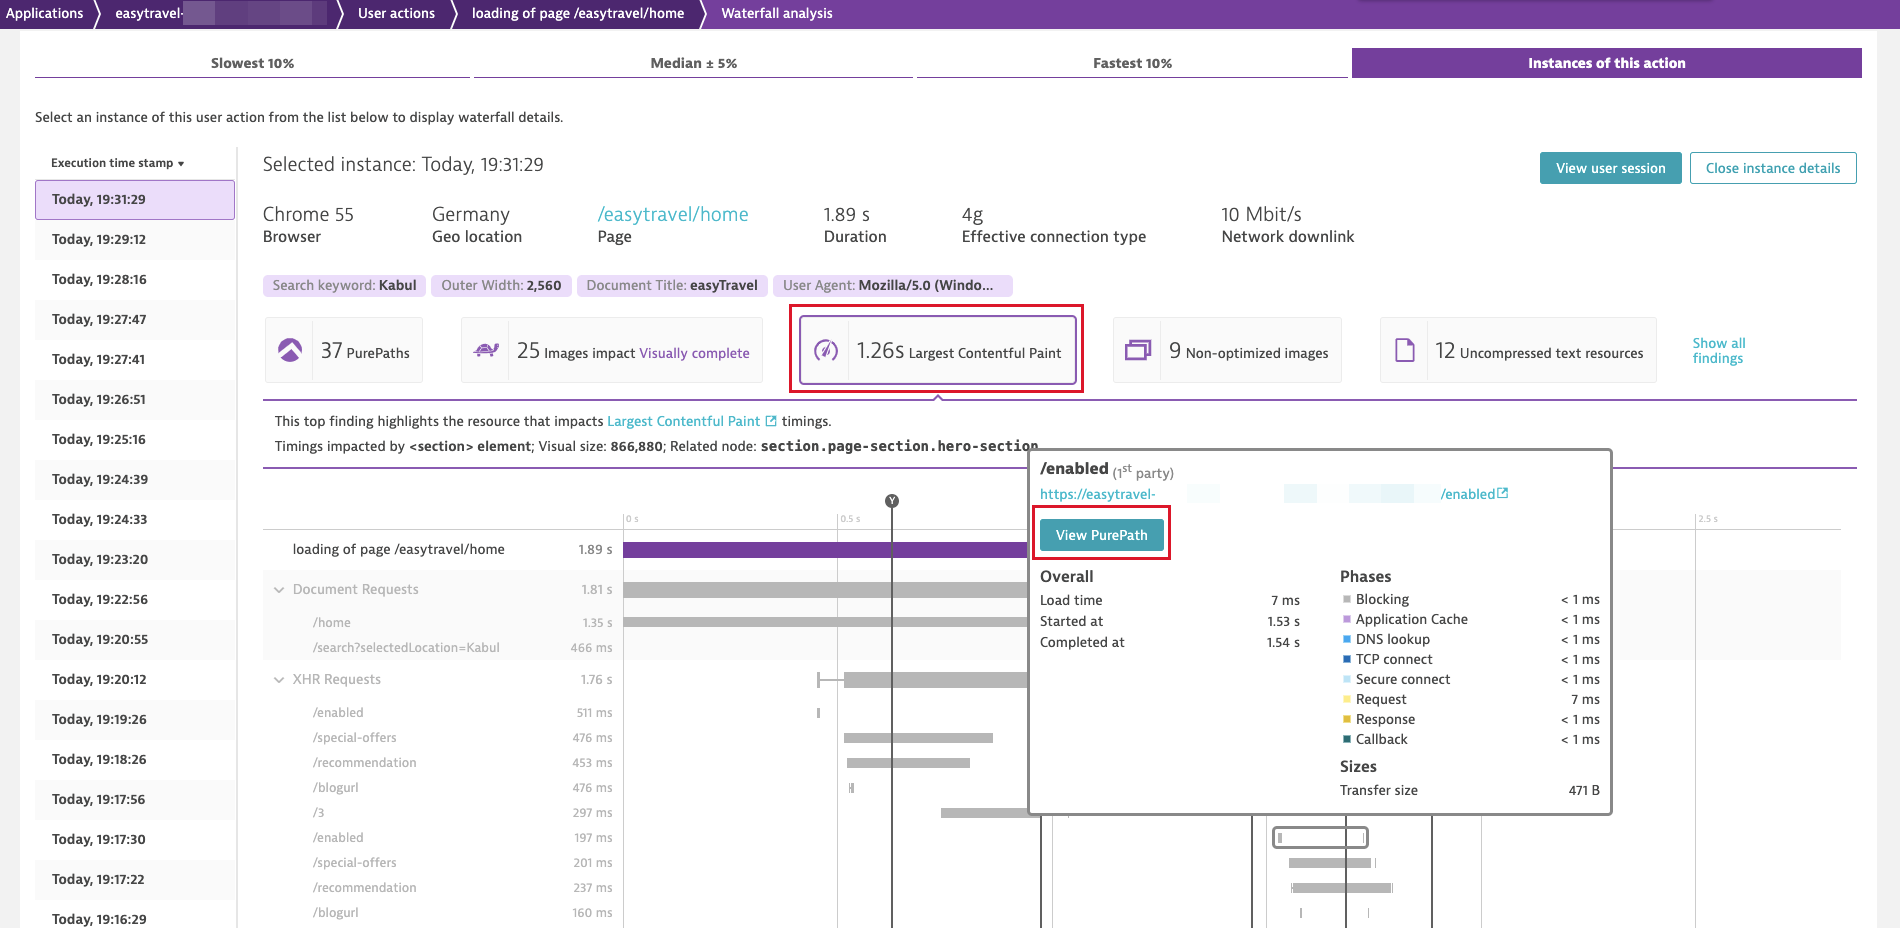
Whenever you want to explore and analyze any of the Core Web Vitals, simply start on the Synthetic or RUM multidimensional analysis page, where you can filter for synthetic monitor actions or RUM user actions. For example, when you see a reported Core Web Vital issue in the Google Search Console, navigate to the corresponding RUM user action in Dynatrace, as shown below.
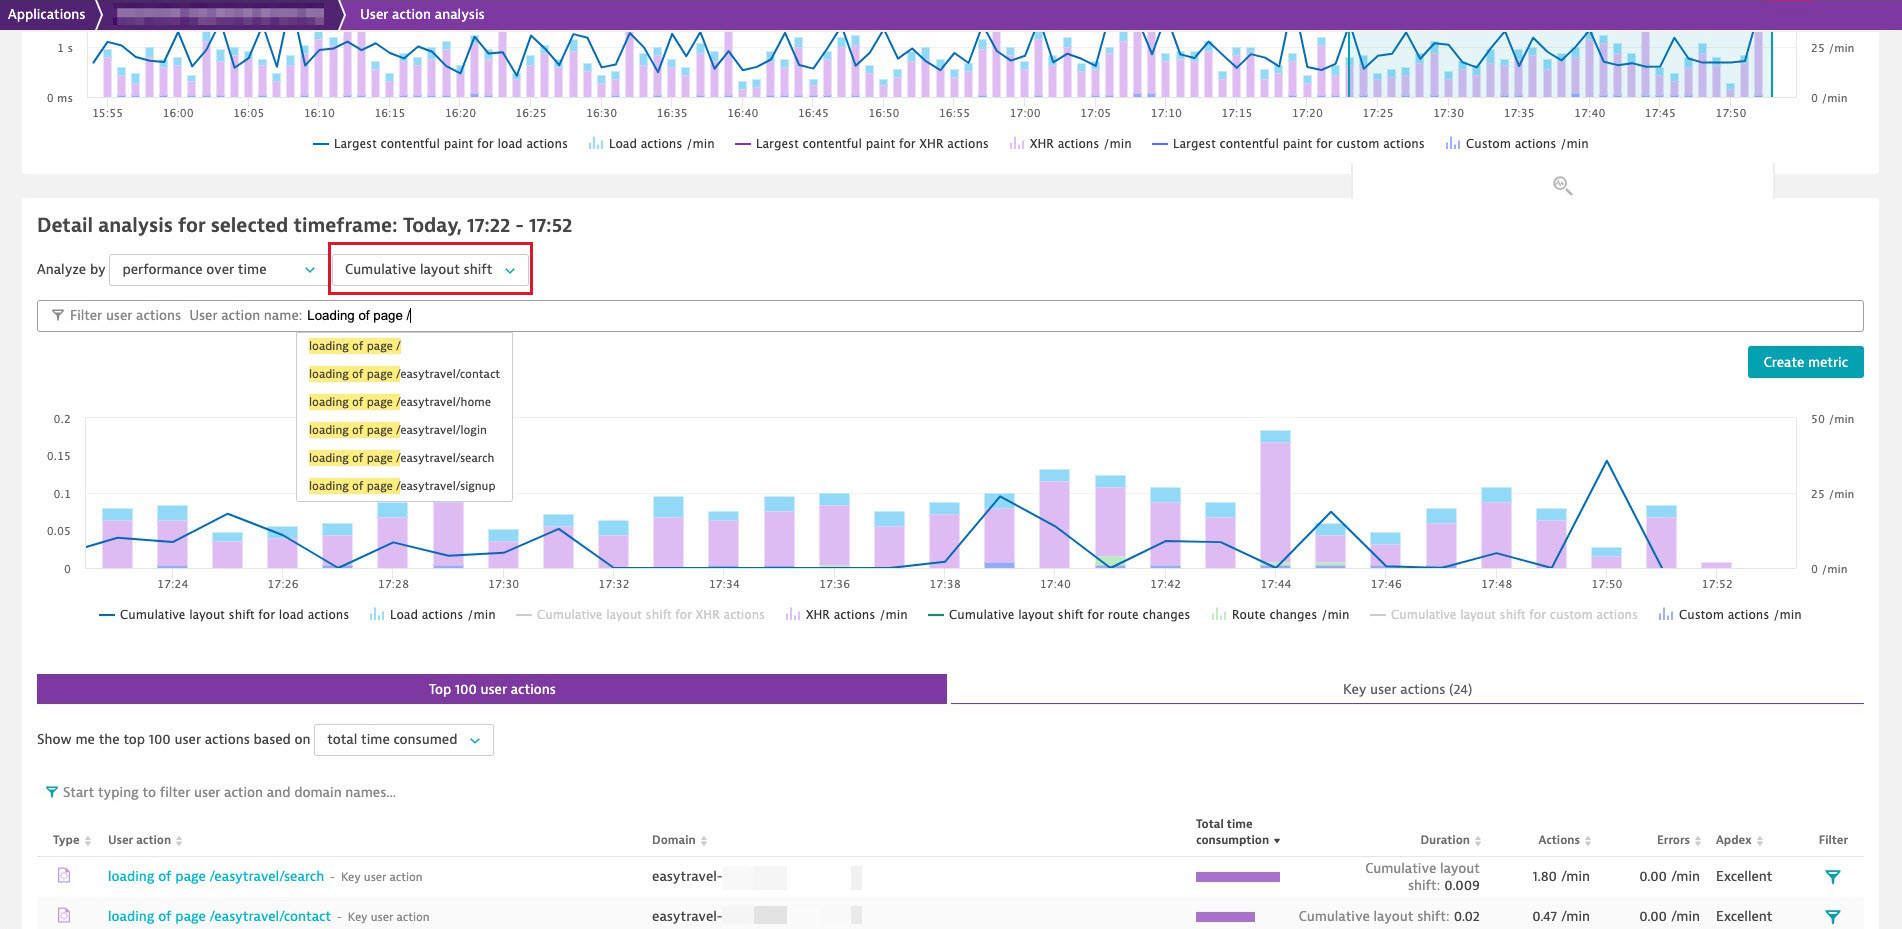
After finding the corresponding load action, go to the action detail page for additional, rich context information that helps identify the reasons for a poorly performing Web Vital metric. For example, you can select View analysis in waterfall chart to immediately:
- Check how resources are requested on that page (script files, images, etc.) and find any particularly slow request.
- If a request is slow, get additional context information across the application front and back ends to narrow down the issue. Analyze whether slow requests are back-end or front-end related. For instance, use Dynatrace PurePath to jump from the front end to slow back-end requests so you can further analyze them. Or, use front-end-related metadata such as the effective connection type and network downlink of the given user.
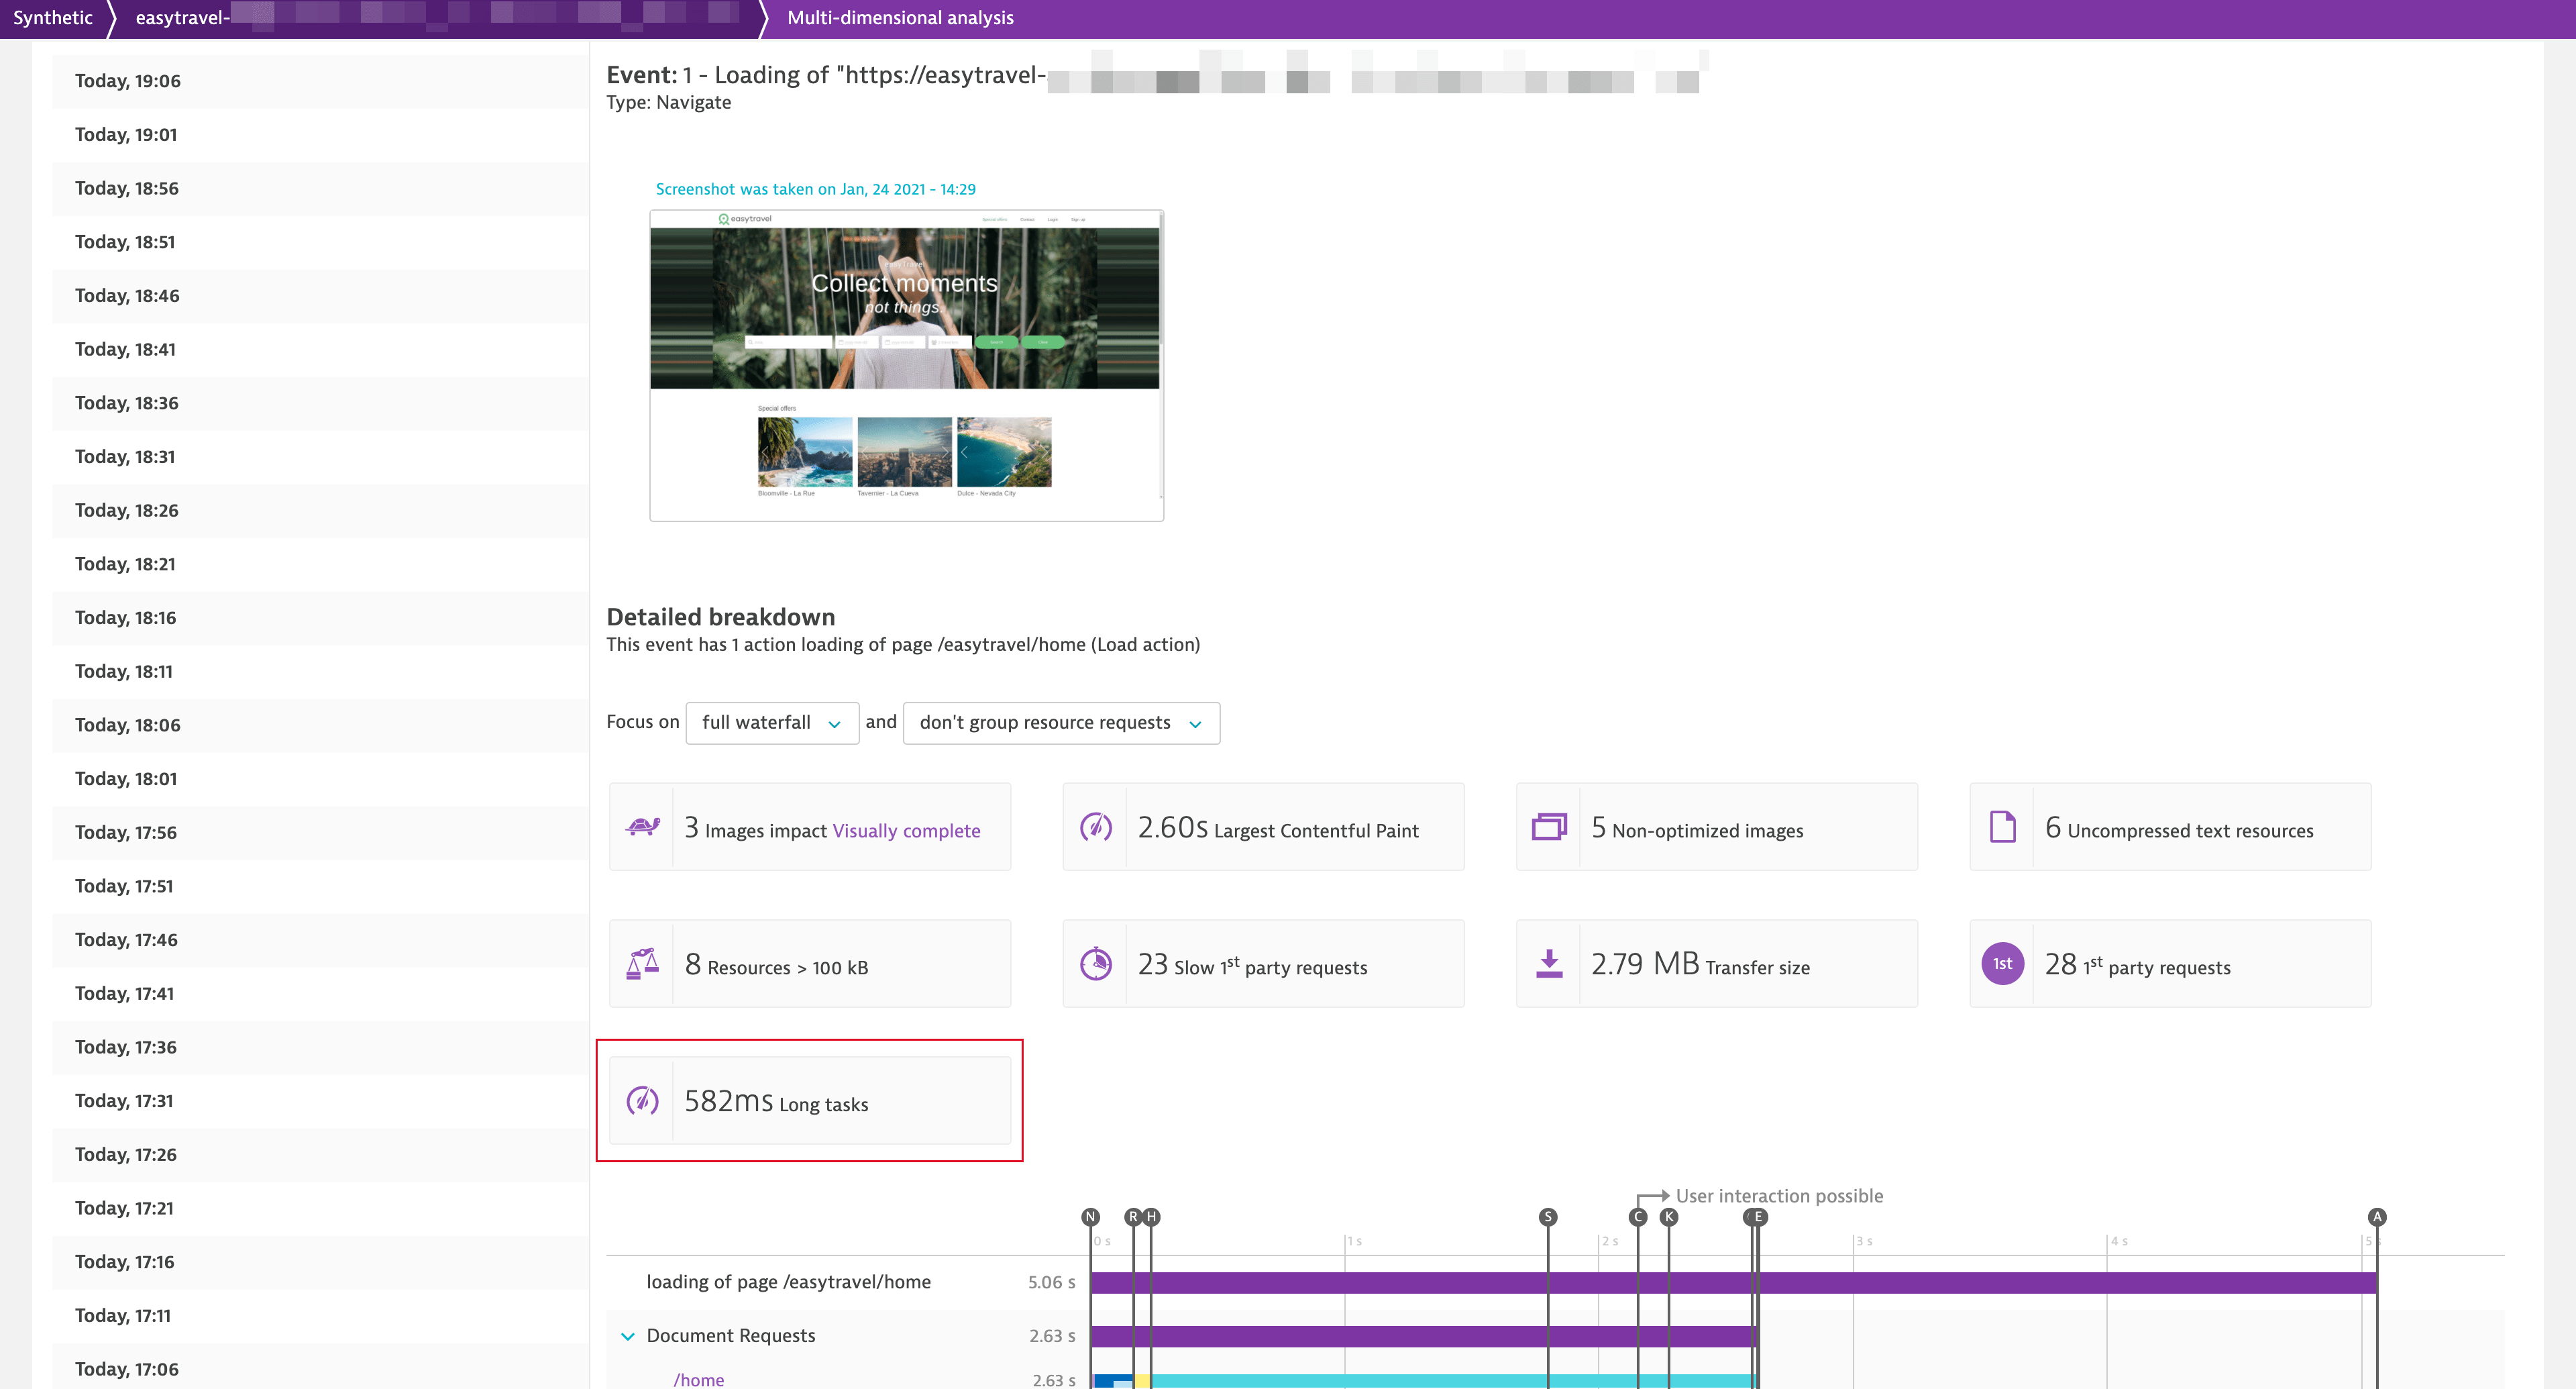
- If your requests are fast, check for Long task times, which indicate that an issue is front-end related and whether heavy JavaScript execution is blocking your page from loading quickly.
- Act proactively by getting these signals early on, from every environment, not just production environments. Davis AI knows when your key performance metric slows down from one release to the next.
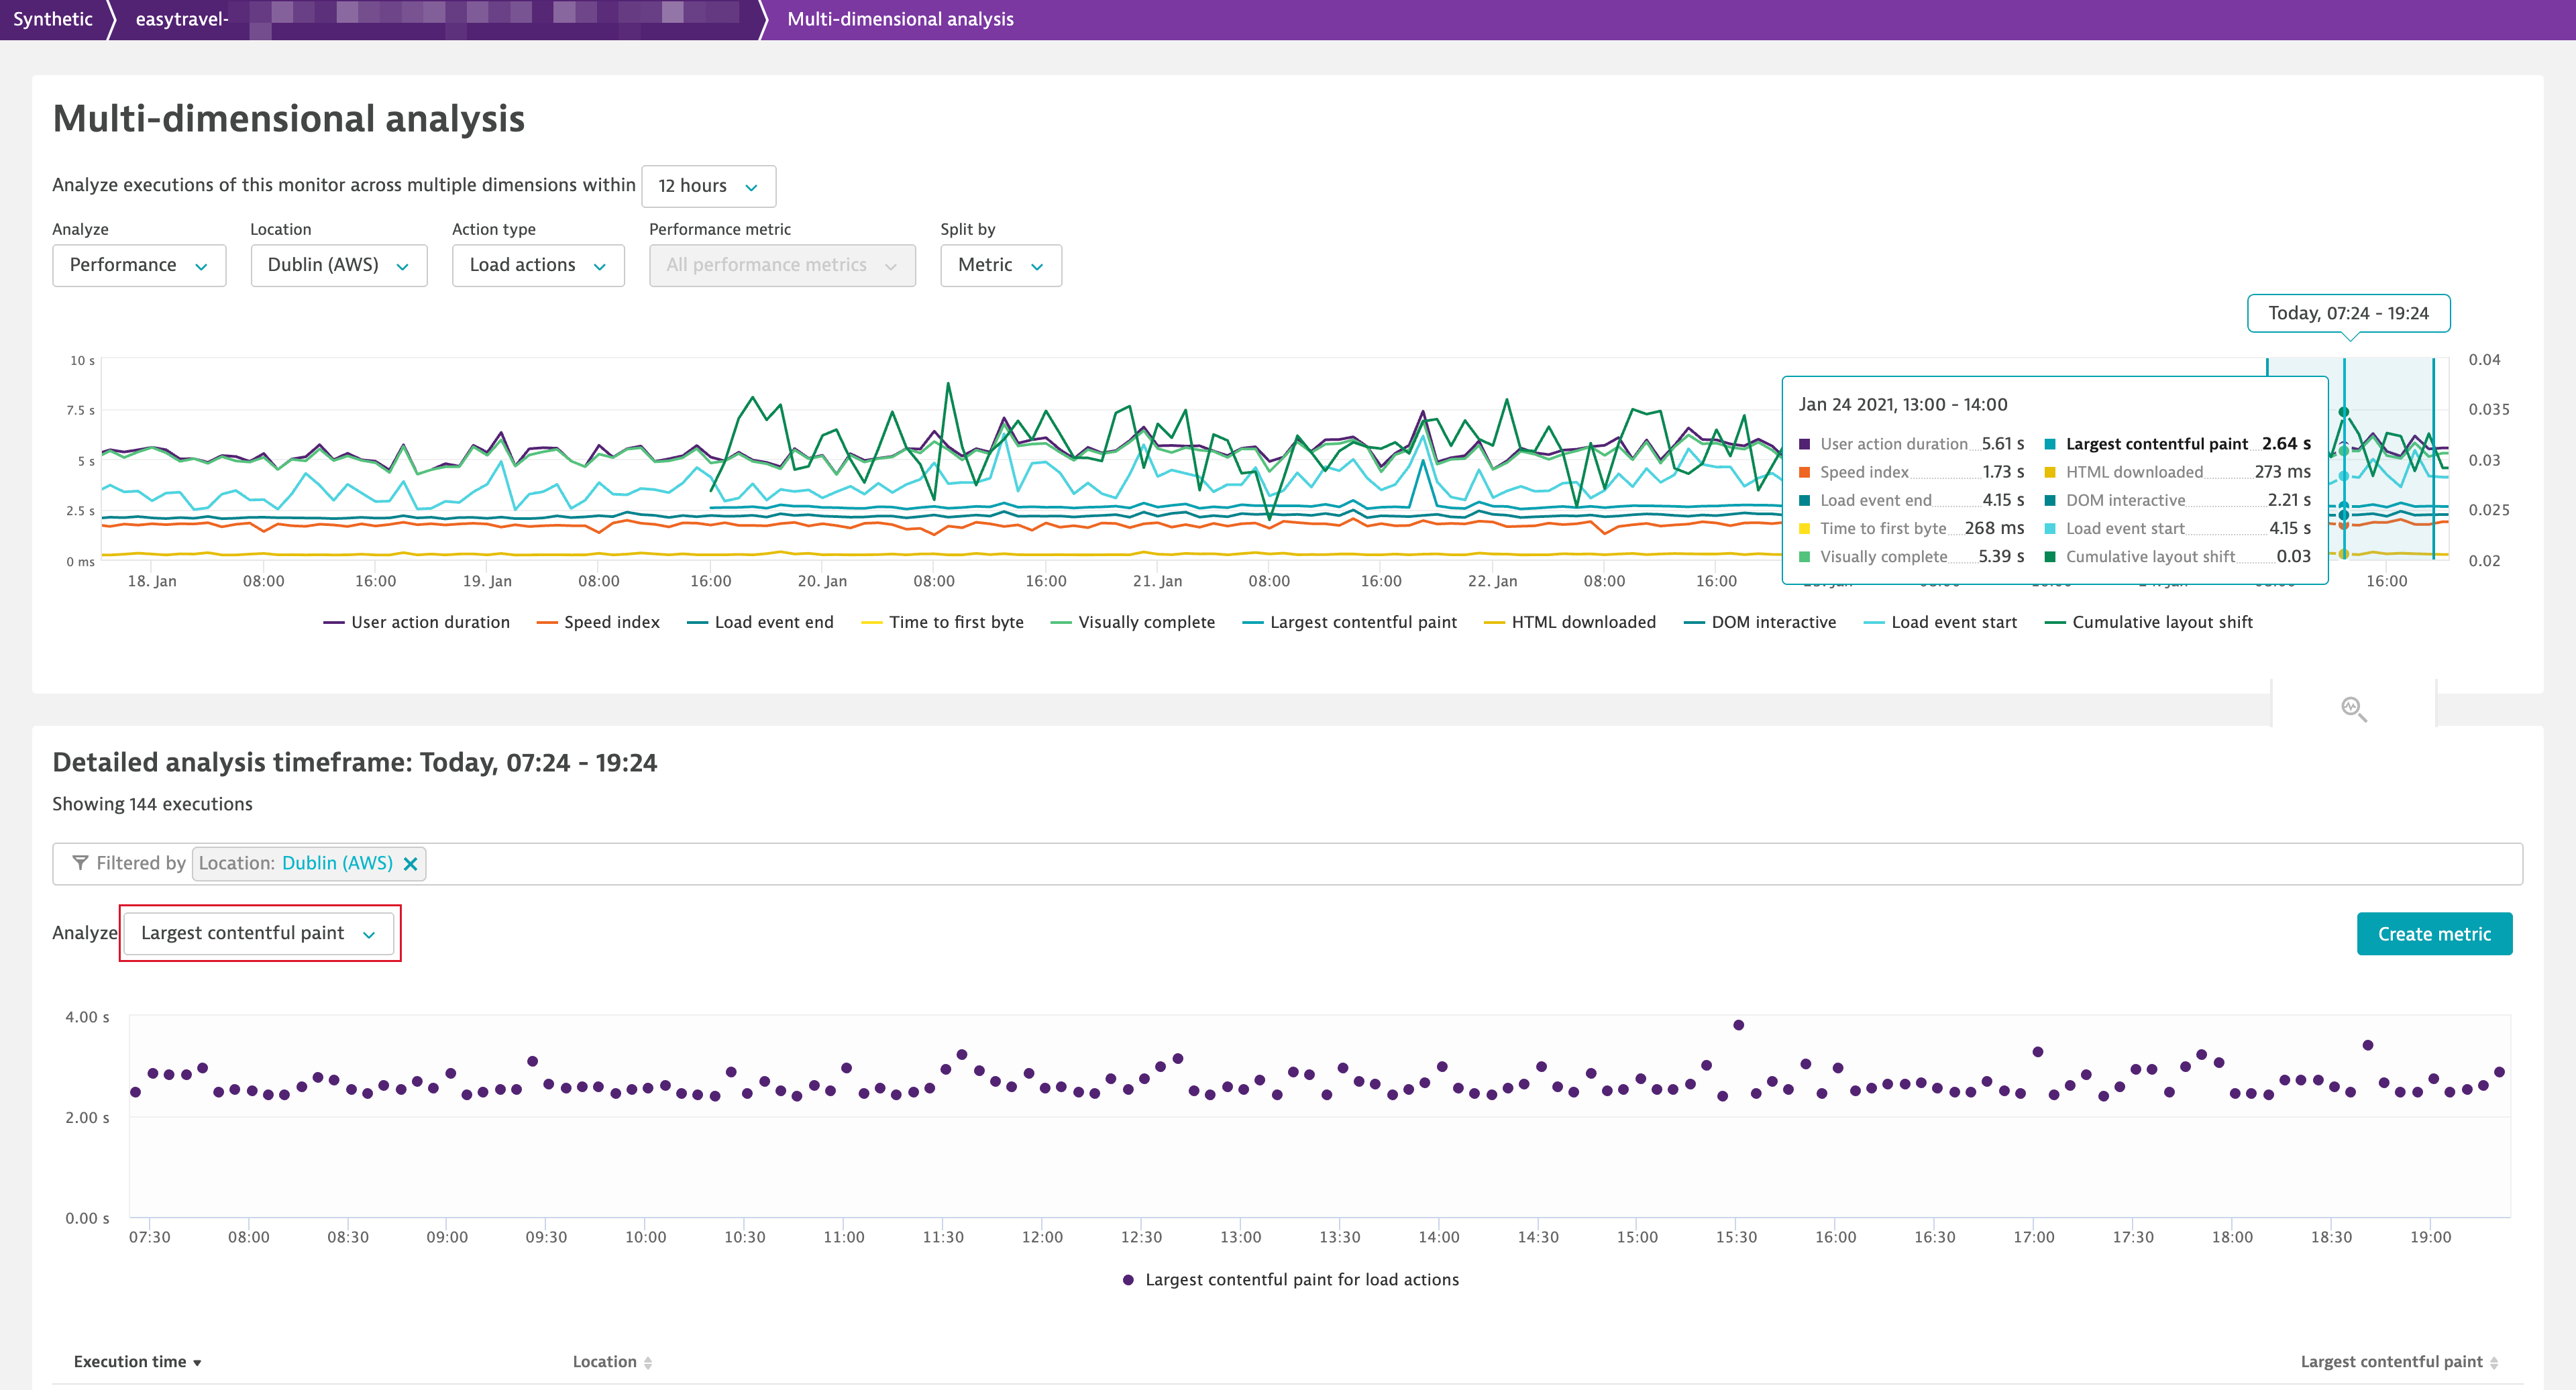
Here’s how a similar analysis of Largest contentful paint and Cumulative layout shift would work for synthetic browser monitors.
- Select Synthetic from the navigation menu.
- Select a single-URL browser monitor or clickpath to view the details page.
- Select the performance infographic on the right.
- Select Analyze performance to view multidimensional analysis of performance.
- Make sure to have Load actions analyzed based on Largest contentful paint and Cumulative layout shift.
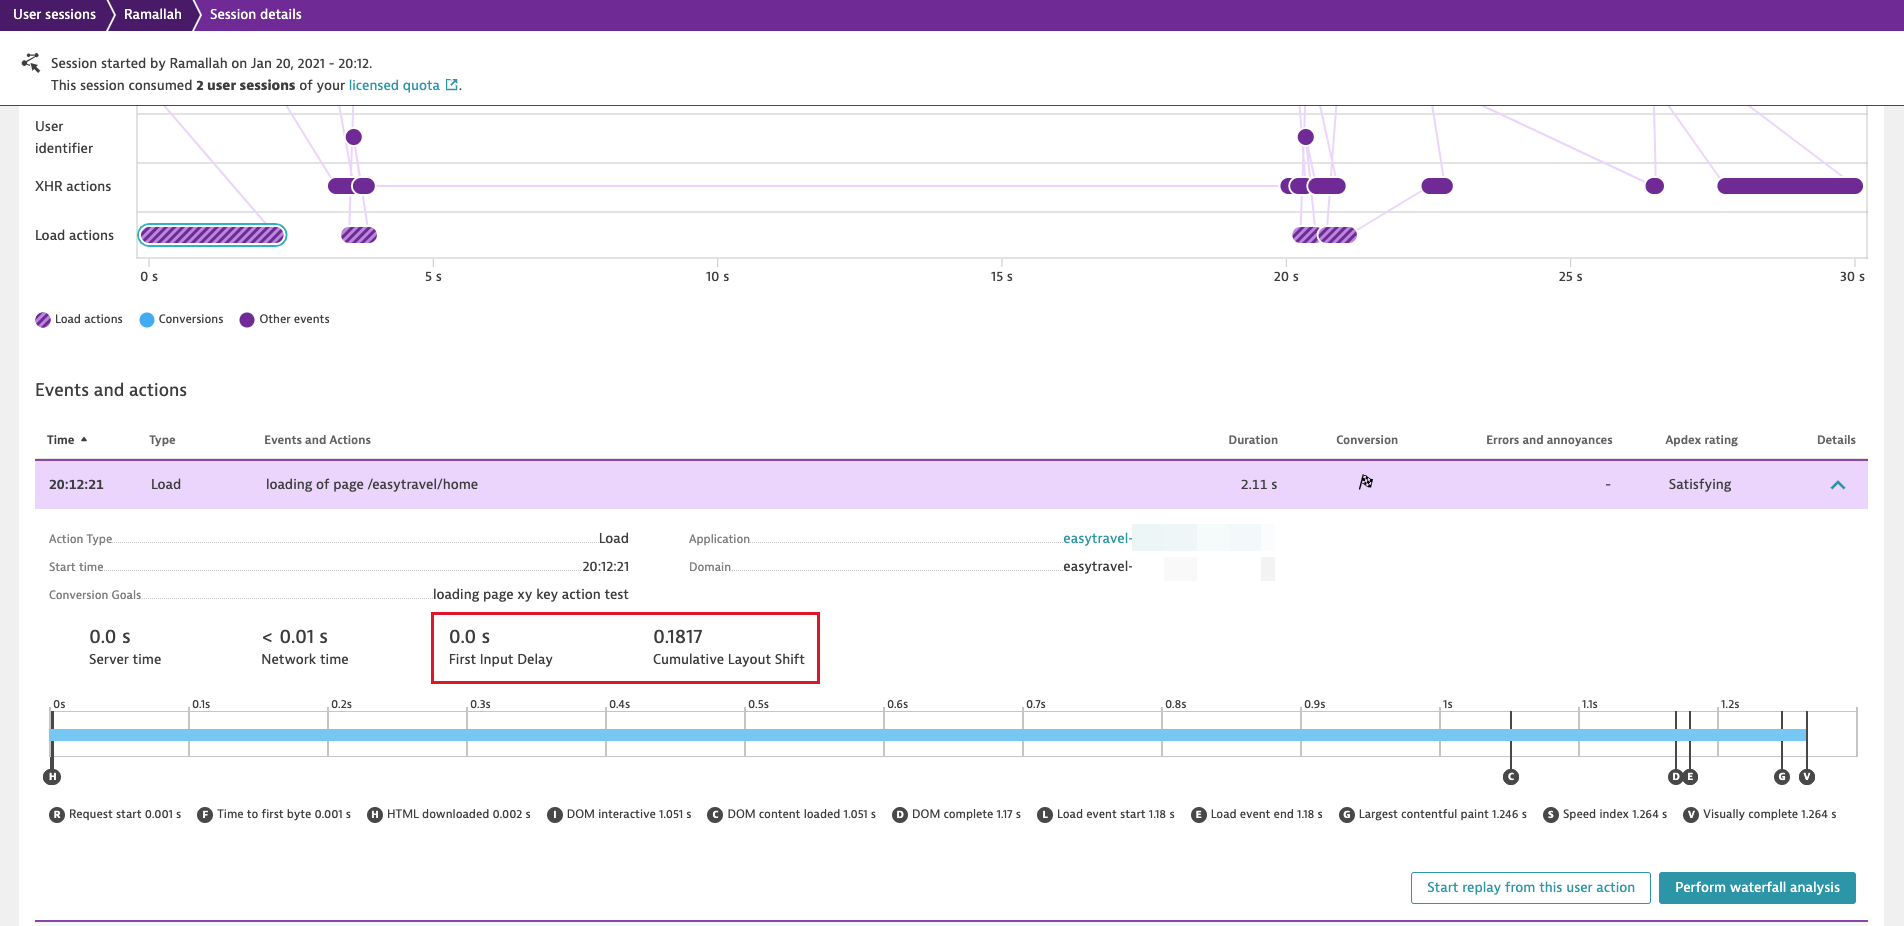
Analyze the Core Web Vitals on session detail pages and use them in USQL
But what if the user action alone isn’t enough? What if you need more context? That’s easy! Just jump to user sessions and find all the metrics for every load action. Simply expand a given load action and check out the measurements and scores in the breakdown.
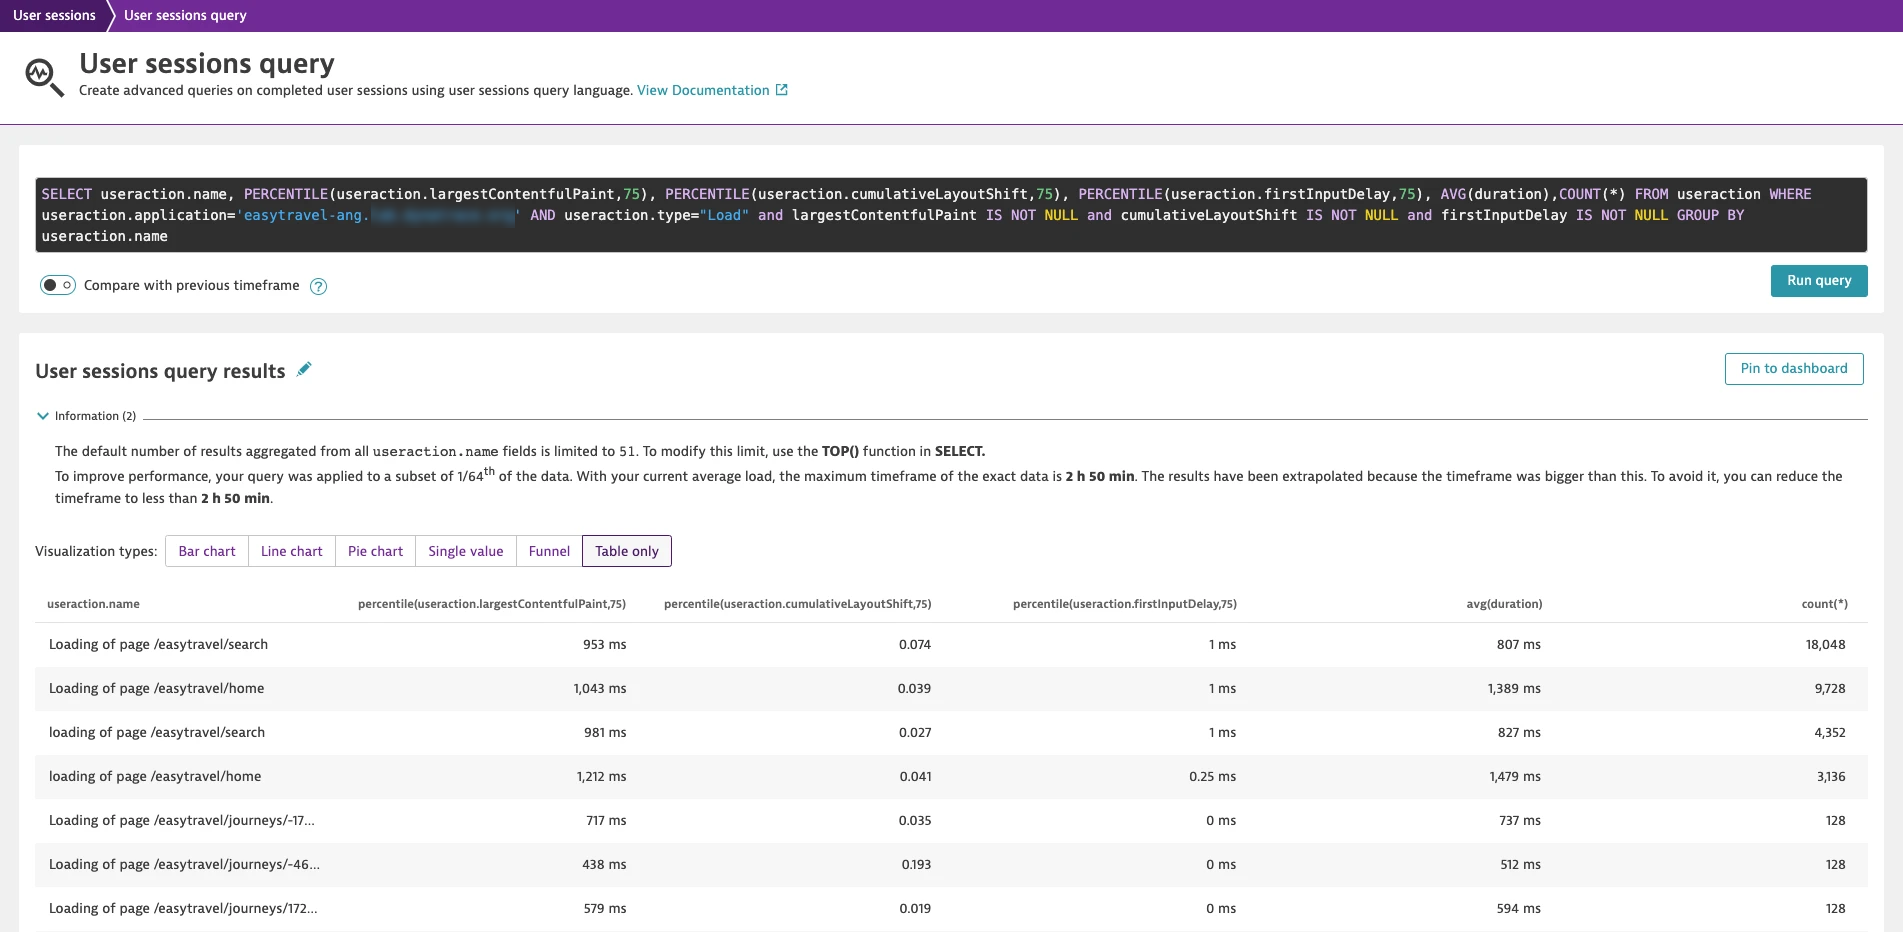
If you’re a fan of USQL, then no worries, we’ve also included the Core Web Vitals here. Use them to start your exploratory analysis at a higher level in USQL and use all the relevant context data to segment them. For those of you who want to build custom solutions based on the metrics, we’ve got you covered. User session export now includes all three Core Web Vital metrics.
Improve Core Web Vital timings using Synthetic Monitoring
Core Web Vitals are available for synthetic monitors out of the box, without any additional configuration. Leveraging Dynatrace Synthetic Monitoring is the perfect addition to Real User Monitoring, so you can analyze and improve your Core Web Vital metric timings. Synthetic (or lab) data provides a stable baseline, as the metrics are always measured with exactly the same parameters (network conditions, screen resolution, device type, CPU, etc.). This makes synthetic monitors a great option for monitoring performance during development and allows you to catch performance regressions as early as possible.
What about First input delay for synthetic monitoring?
You might have noticed that First input delay is not available as a key performance metric for synthetic browser monitors. Google argues that it doesn’t make much sense to look at First input delay for synthetic data as there isn’t any actual user input (which is only simulated). They suggest using Total blocking time (TBT) instead.
TBT is currently not available in Dynatrace. However, we recommend looking at a new metric that we’ve added instead—Long tasks (which TBT is based on). This metric is captured via the browser Long Tasks API and has the advantage (over TBT) of also being available for real users.
Long tasks is the total time of all long JavaScript tasks (over 50 ms) added together. It’s measured from Navigation start for the entire User action duration.
Long tasks is currently not a key performance metric, but you can find it in multidimensional analysis and you can also create a calculated metric based on it if you want to have long-term data or be alerted on it.

Seeing is believing
Prepare for the change to Google search rankings and improve user experience by fine-tuning Web Vital metrics with Dynatrace today.
- Already a Dynatrace customer? Start using all the Core Web Vitals today with zero configuration in all your applications!
- New to Dynatrace? Try Dynatrace by starting your free trial today.
What’s next
- Pages: Ever wondered where you can find your route changes for single-page applications? Rest assured that you’ll have an answer soon!
- CSP violations: You’ve probably already seen that we’ve added another Request error type in Dynatrace RUM—expect an official explanation of this soon in a future release.
- Errors in USQL and session export: As mentioned in previous troubleshooting-related releases, we’re currently looking into bridging some gaps in our error-analysis flows. In particular, we’re looking into adding high-level error information to USQL as well as making this information available to you via session export.


Looking for answers?
Start a new discussion or ask for help in our Q&A forum.
Go to forum