That first mile of getting data in can often be the hardest. That's why Dynatrace continues to invest in log ingest, offering a range of out-of-the-box solutions. With these latest log management innovations, you can harness even more data for comprehensive AI-driven insights, faster troubleshooting, and improved operational efficiency whether you use Syslog, AWS Firehose, Fluent Bit, or other technologies.
Understanding that the first mile of getting data in can often be the hardest, Dynatrace continues to invest in log ingest, offering a range of out-of-the-box solutions within the Dynatrace Platform and apps. We’re excited to announce several log management innovations, including native support for Syslog messages, seamless integration with AWS Firehose, an agentless approach using Kubernetes Platform Monitoring solution with Fluent Bit, a new out-of-the-box ingest dashboard, and OpenPipeline ingest improvements.
These developments open up new use cases, allowing Dynatrace customers to harness even more data for comprehensive AI-driven insights, faster troubleshooting, and improved operational efficiency.
Let’s delve deeper into how these capabilities can transform your observability strategy, starting with our new syslog support.
Native support for Syslog messages
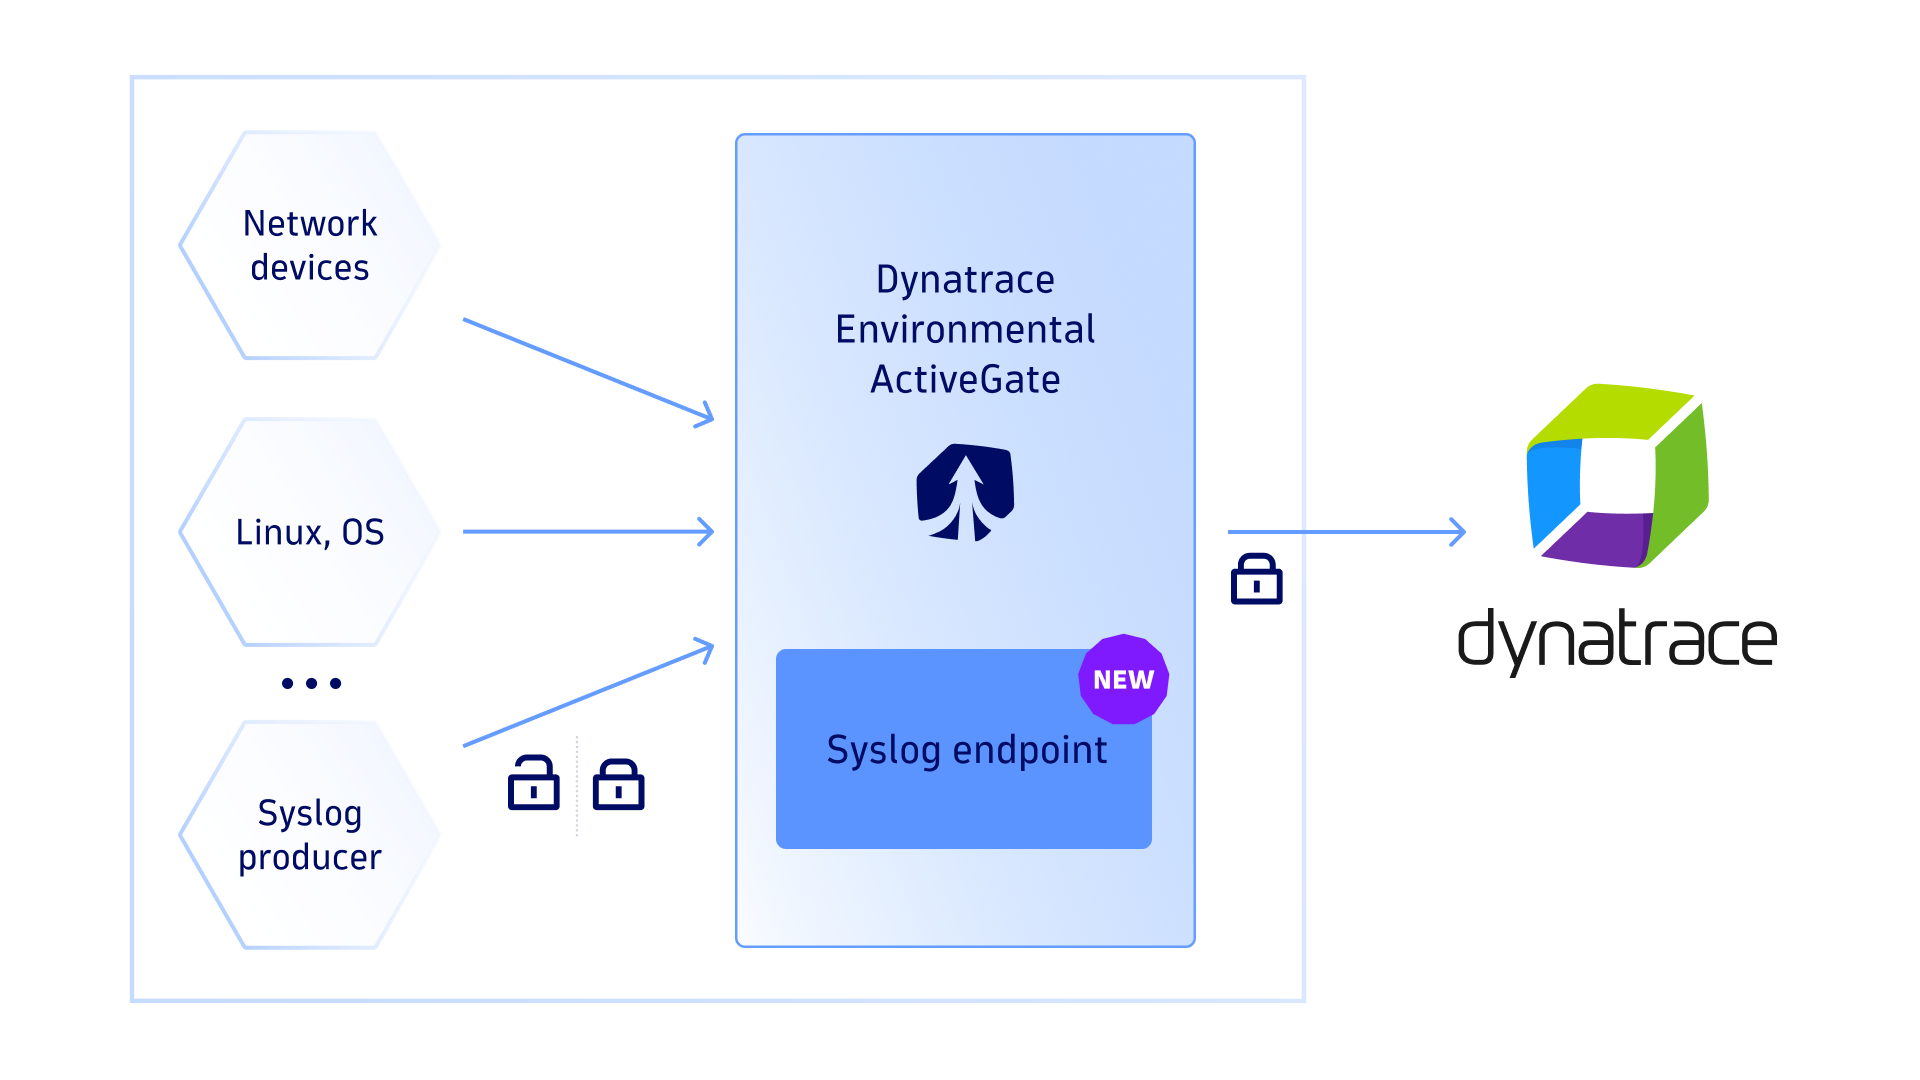
Syslog messages are generated by default in Linux and Unix operating systems, security devices, network devices, and applications such as web servers and databases. Native support for syslog messages extends our infrastructure log support to all Linux/Unix systems and network devices. The more data ingestion channels you provide to the Dynatrace Davis® AI engine, the more comprehensive Dynatrace automated root cause analysis becomes.
Customers can also proactively address issues using Davis AI’s predictive analytics capabilities by analyzing network log content, such as retries or anomalies in performance response times.
Dynatrace natively supports Syslog using ActiveGate (preferred method) or the OpenTelemetry (OTel) collector. Many syslog producers lack authentication and have varying security capabilities, such as TLS encryption. Dynatrace ActiveGate addresses these issues by enforcing configurable security settings and ensuring data uniformity. It also enhances syslog messages with additional context and optimizes network traffic, improving overall system resilience and security. This enhancement lays the foundation for the broader, more integrated observability that Dynatrace continues to expand with each new feature.

Customers have had a positive response to our native syslog implementation, noting its easy setup and efficiency. A $20 billion Germany-based financial services company told us they found the process of pushing Syslog messages to Dynatrace natively to be seamless. Another customer based in Germany, a $23 billion medical technology company, told us they appreciate the value of using a native channel to push syslog messages from network devices directly to Dynatrace, bypassing the need for FluentD or a standalone OpenTelemetry collector.
This streamlined approach enhances both usability and integration, making syslog management simpler and more effective.
Seamless integration with AWS Firehose
Dynatrace is also enhancing our observability logs offerings for AWS services for cloud-native applications. By integrating AWS Firehose into the Dynatrace platform, you can address high-impact issues quickly through real-time, high-frequency log analytics.
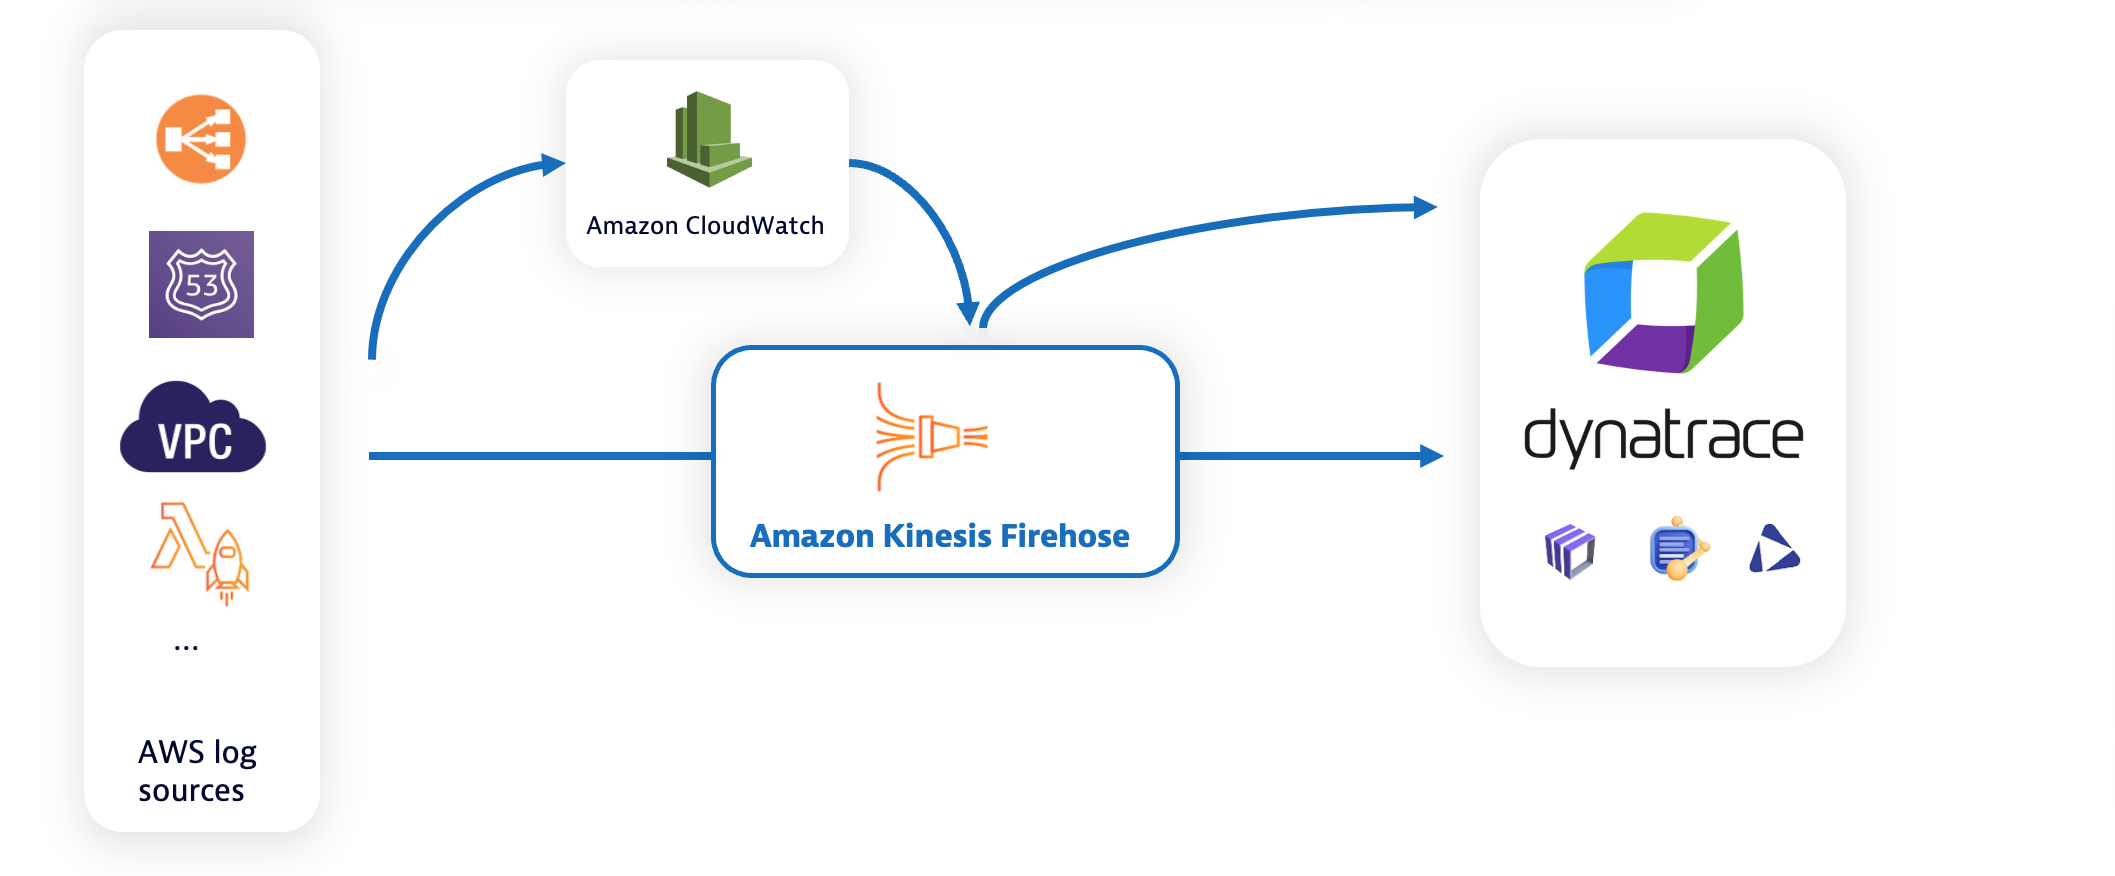
This integration with AWS Firehose simplifies observability by removing intermediary components, which allows seamless log capture and analysis directly in the Grail data lakehouse. Logs are immediately available for troubleshooting, security investigations, and auditing, becoming integral to the platform alongside traces and metrics.
Dynatrace supports scalable data ingestion, ensuring your observability infrastructure grows with your cloud environment. The setup is straightforward, using API keys, CloudFormation templates, or the AWS web console.
Dynatrace also provides contextual insights by linking logs to problems detected by Davis AI, enabling quick access to relevant details. The platform also offers proactive analysis through Notebooks for visualizing log data and exploring error rates. Dynatrace support for AWS Firehose includes Lambda logs, Amazon virtual private cloud (VPC) flow logs, S3 logs, and CloudWatch. This seamless integration not only enhances AWS observability but also ties into the greater context of how Dynatrace unifies cloud-native observability across multiple platforms.
Customers have responded enthusiastically to our AWS Firehose implementation. Our approach provides seamless cloud log integrations you can configure directly in the AWS console or through provided CloudFormation templates. This setup eliminates the need for additional middle-layer components, making it straightforward and efficient.
A key advantage of this integration is its high throughput aligned with Grail, ensuring optimal performance. What’s more, logs ingested using AWS Firehose are enriched with cloud context, enabling in-context analysis within the platform. This capability enhances the overall observability and insights that customers can gain from their cloud environments.

Kubernetes Platform Monitoring using Fluent Bit for cloud-native environments
One of the log management innovations we’re excited to share is the new Kubernetes platform monitoring solution with Fluent Bit, offering a cloud-native, API-based deployment model. With this innovation, Dynatrace makes it easier for teams to stream logs from Kubernetes environments into Dynatrace through a more lightweight and streamlined setup, accelerating time to value. Customers get advanced health analytics out of the box and automated root cause analysis by Davis® AI when they ingest Kubernetes workloads, traces, logs, and metrics into the Dynatrace Grail data lakehouse.
For organizations who already use Fluent Bit as part of their tech stack to configure pipelines and enrich log data, this modern approach enables teams to gain answers in context based on logs, powered by the Dynatrace platform’s automation and problem detection. With all data in one place and in context, the new Kubernetes platform monitoring solution provides easy filters by namespace, cluster, workloads, nodes, services, pods, and containers. Integrating with Fluent Bit for Kubernetes log ingestion is important for ensuring teams are capturing critical data for troubleshooting and issue remediation.
Dynatrace enhances Fluent Bit’s log management by integrating observability signals like traces, events, and metrics, providing a complete view of cloud-native application performance. It automates log analysis, eliminates manual correlation, and offers broader visibility through ready-made dashboards and health checks. Log configuration is simplified, while advanced analytics powered by Davis AI bubbles up critical health signals, and provides automated root cause analysis, predictive AI for remediation, generative AI for query writing, performance baselining, and anomaly detection. This innovation ties into the broader effort to simplify and enhance log management across diverse environments, further integrating Kubernetes observability into the Dynatrace ecosystem.
Out-of-the-box logs ingest dashboard
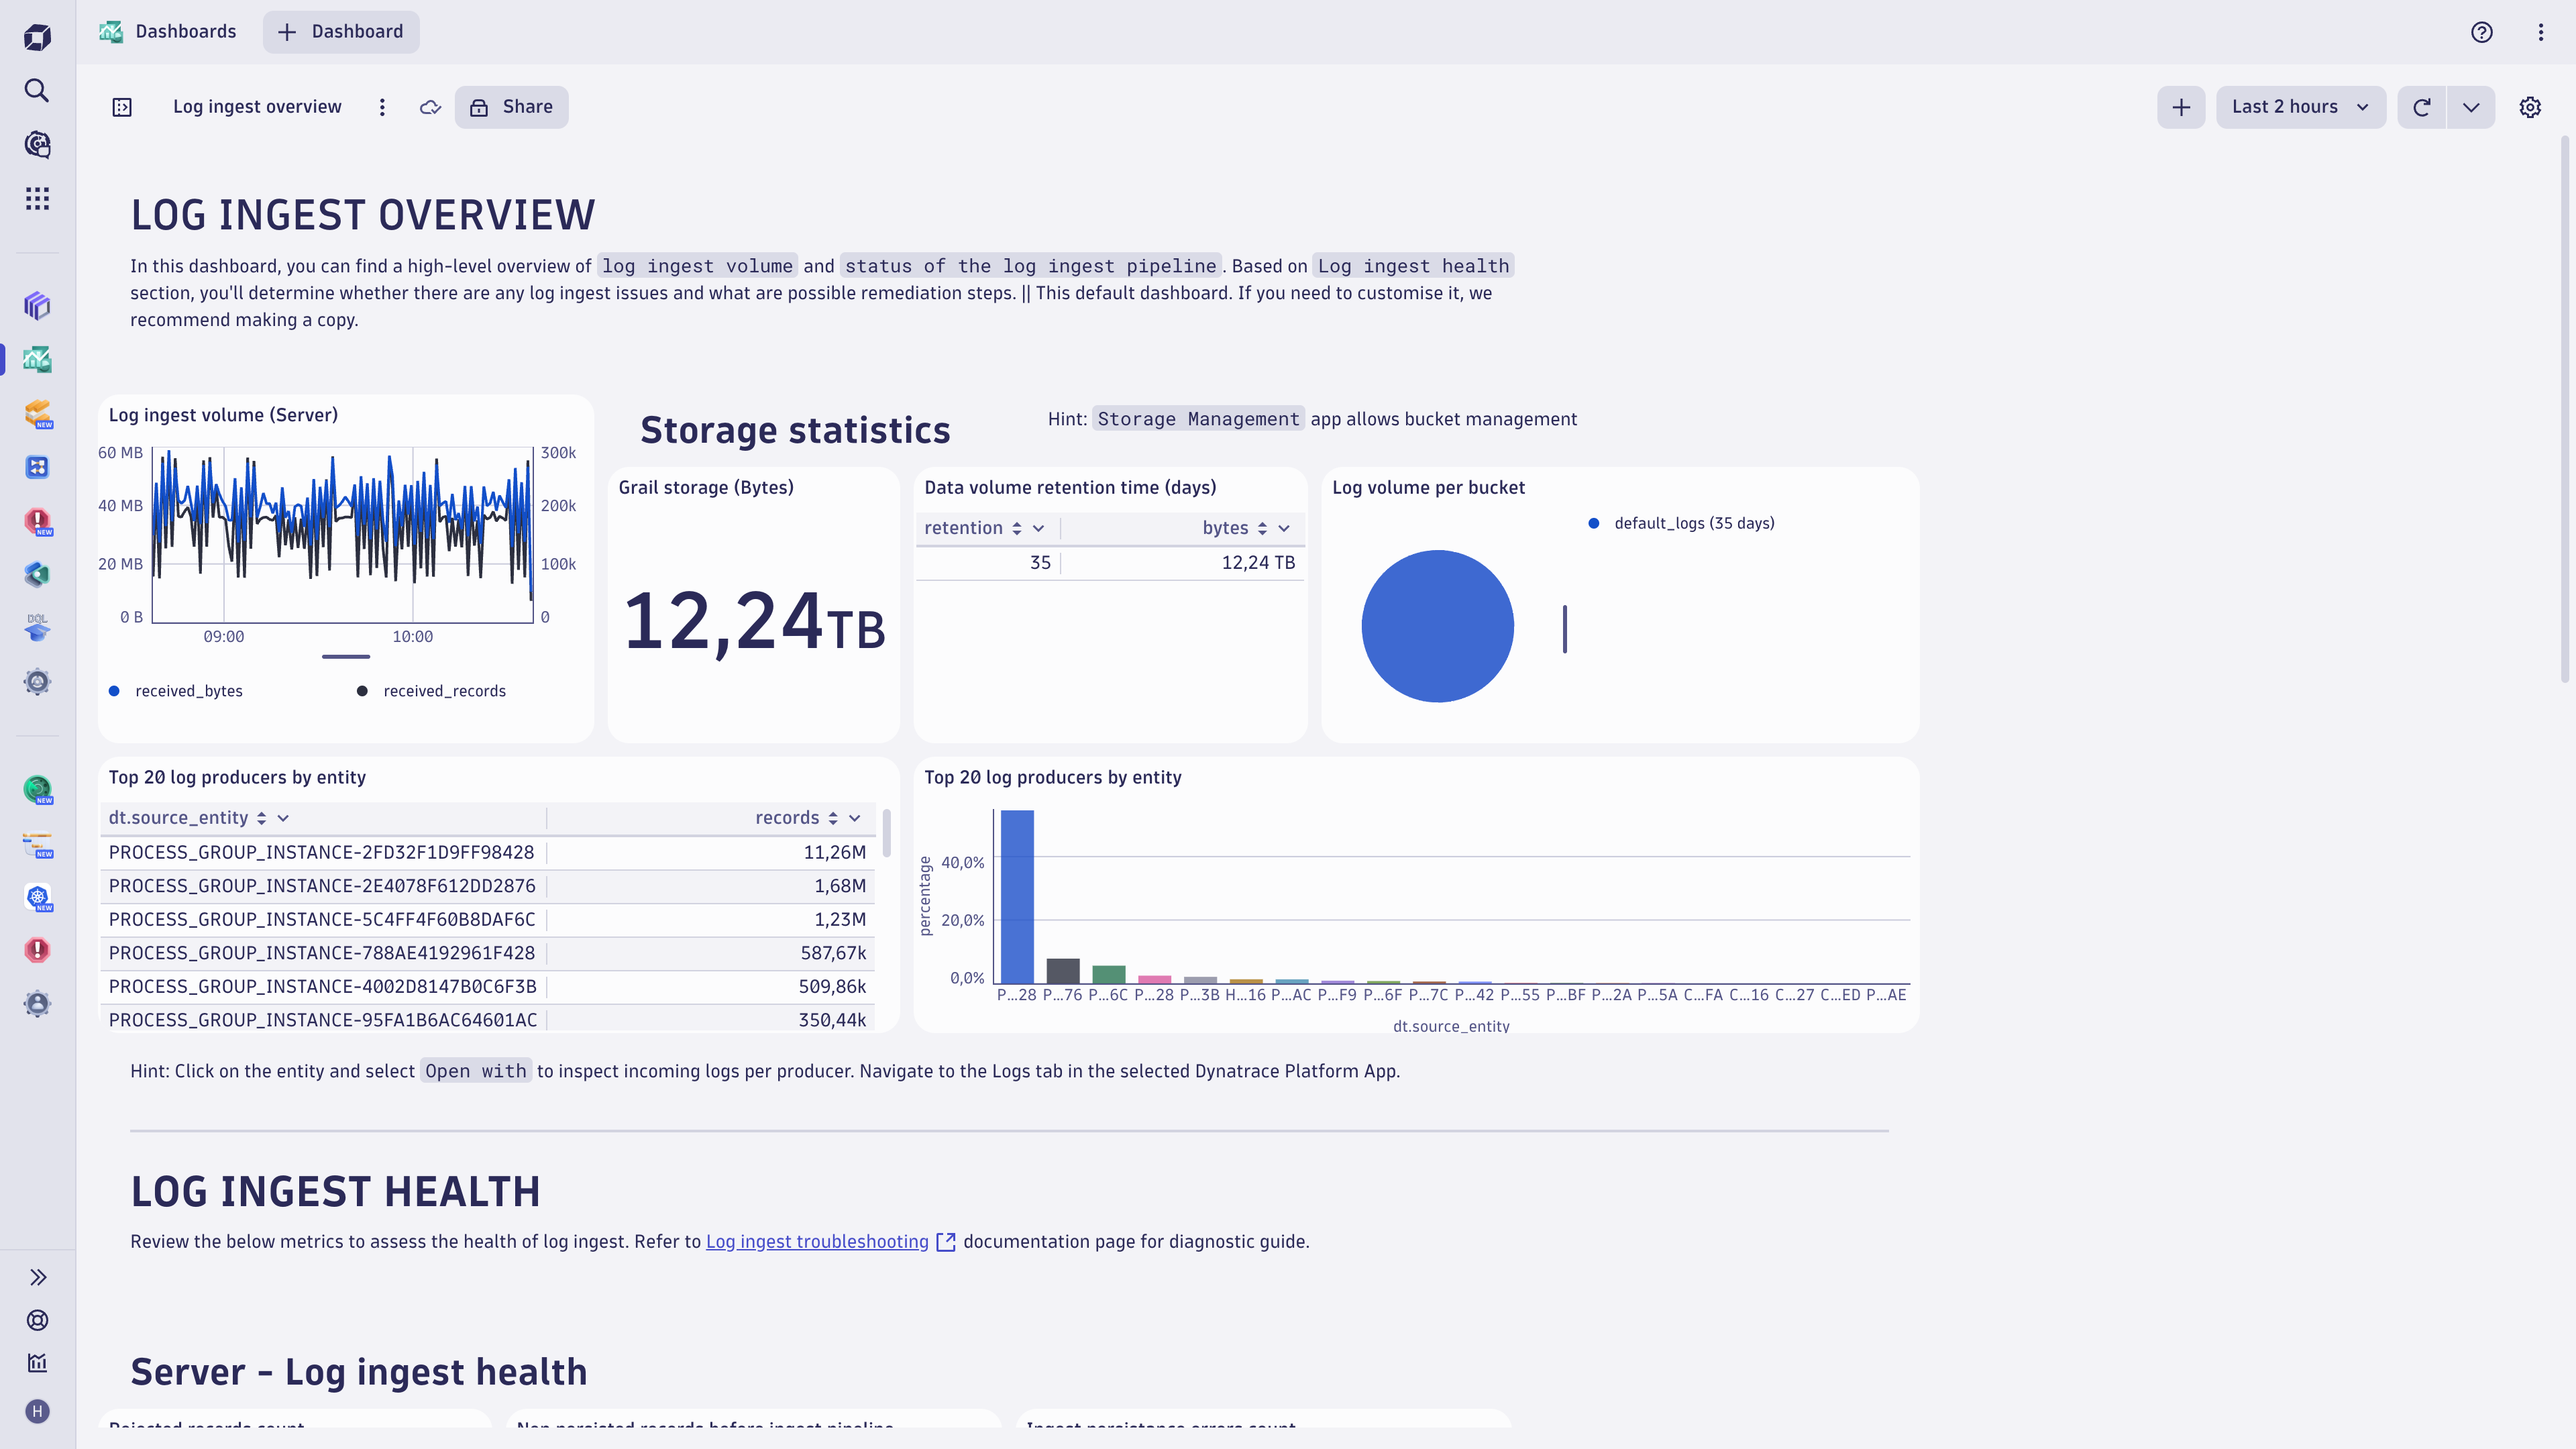
Coming soon is an out-of-the-box logs ingest dashboard that enables you to easily manage your ingest channels.
The dashboard tracks a histogram chart of total storage utilized with logs daily. It also tracks the top five log producers by entity. You can see in a table retention periods by the number of logs and storage they consumed.
The dashboard also breaks down log volume by Grail buckets, showing you what buckets consume the most storage. Grail buckets can help enterprises categorize their logs by retention periods, types of logs such as audit logs, or by organizations that utilize the logs. Think of it like individual bookshelves in a library, where each shelf is dedicated to a specific genre or topic. Just as books are organized on these shelves for easy access and retrieval, data log records are stored in buckets based on their type or purpose, allowing for efficient management and quick querying. This organization ensures that when you need specific information, you can go directly to the relevant shelf or bucket, saving time and effort in finding what you need.
This final piece of the puzzle ensures that your log data is not only easily ingested but also effectively managed, tying together the full spectrum of observability enhancements in the Dynatrace platform. The logs ingest dashboard is currently in tech preview, with GA expected soon. Please follow up with your account team to get early access.

OpenPipeline ingest improvements save money and improve query performance
Lastly, the Dynatrace feature OpenPipeline unifies how we ingest, transform, enrich, and process all observability signals, including logs. This is a significant upgrade to our log processing pipeline capabilities. We now support the following for log ingest:
- Log content up to 512K each
- Log metric counts up to 1000
- Log attributes up to 2.5KB
- Number of log attributes up to 250
- Logs ingestion API payload up to 10MB
- Converting logs into Business Events saves money
- Masking sensitive data
- Setting security context
- Extracting metrics from logs and business events saves money
- Parsing JSON before storing logs in Grail for faster analytics
Customers can save money by converting logs into metrics and business events, which are ingested into predefined buckets, making queries faster without needing to span the entire Grail dataset. This approach also enhances security by allowing customizable security contexts for each log and masking sensitive data before ingestion, while simplifying analytics by pre-parsing JSON. With OpenPipeline, customers can add, remove, rename fields, parse, and mask all incoming logs.
Building on these ingest improvements, these innovations further enhance data analytics and precision by introducing advanced features like OpenPipeline.
Dynatrace log management innovations expand data analytics and precision
Dynatrace continues to lead the way in log management and observability with its latest advancements. By introducing support for syslog messages, AWS Firehose integration, the agentless Fluent Bit setup for Kubernetes environments, a powerful out-of-the-box ingest dashboard and our new OpenPipeline, our customers can achieve deeper insights, faster troubleshooting, and more efficient operations across their hybrid cloud ecosystems. These innovations not only expand the breadth of data available for analysis within the Dynatrace platform but also enhance the precision and effectiveness of our AI-driven capabilities, which results in more actionable, automatable outcomes.
Each of these developments interconnects to create a more comprehensive and powerful observability solution, designed to meet the evolving needs of our customers. As we continue to refine and expand our offerings, our commitment remains focused on empowering organizations to proactively manage their infrastructure and applications with unparalleled clarity and confidence.
We encourage our customers to explore these new capabilities and see how they can further optimize their observability practices.
Try out these new Dynatrace log management innovations
If you’re a customer, go to Dynatrace Playground to check out the new capabilities. If you’re looking into Dynatrace, check out our free trial.
To learn more about these technologies, see details in the following blogs:


Looking for answers?
Start a new discussion or ask for help in our Q&A forum.
Go to forum