Mobile apps have taken over—they make life so much easier in so many ways. At the same time, mobile experiences have conditioned mobile consumers to expect an ever-growing level of speed, convenience, and personalization—no matter if it’s ordering food, scheduling a doctor’s appointment, or paying bills online. In these situations, a sudden app crash can make the difference between you or your competitor completing the transaction and retaining that customer’s business.
Dynatrace Real User Monitoring provides gapless insight into all the user journeys of the customers of your app, from the frontend to the backend. Crash reporting is one of its key components: Dynatrace OneAgent for Mobile captures crashes and sends the stack traces to Dynatrace so that the criticality of the crash can be assessed and the root cause of the issue can be identified. Thus, you can proactively resolve issues and ensure that your applications meet your business goals.
With the release of Dynatrace 1.191, you get an improved mobile-app crash analysis workflow that allows you to see the impact of crashes, identify affected user groups, and—most importantly—get to the root cause quickly.
Understand the impact of crashes, identify affected users, and get to the root cause quickly
If you work with a client/server setup, some crashes will have their root cause on the server-side. Dynatrace is uniquely positioned to provide clarity in such cases through our PurePath technology and the ability of OneAgent to correlate user actions with web requests. This means that you get full visibility, all the way from individual user actions down to the specific server-side database statements that contribute to mobile crashes.
Easily investigate app crashes with the crash analysis dashboard tile
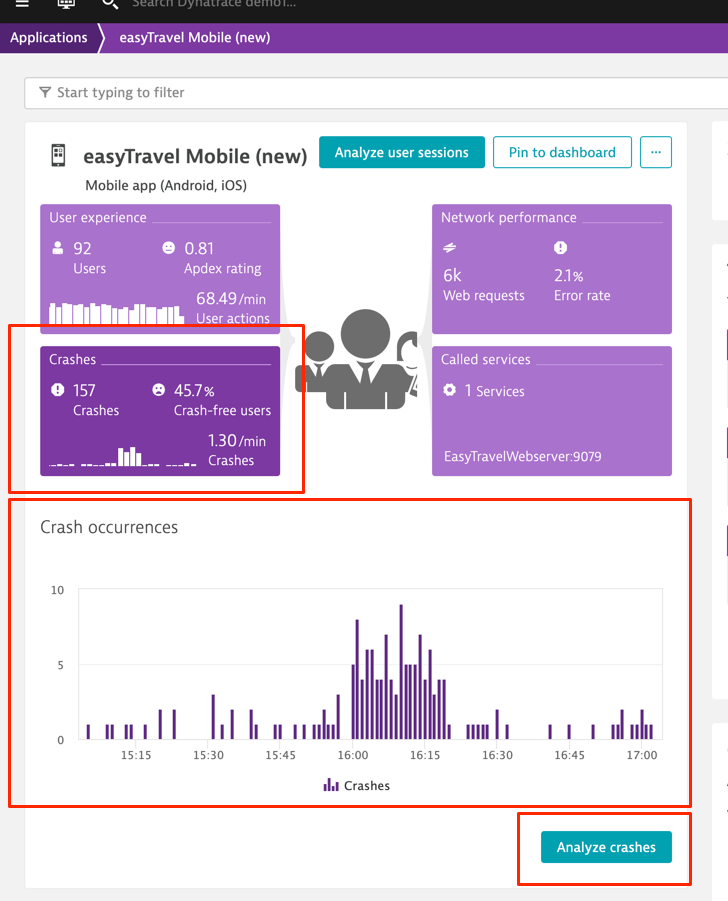
The mobile app overview page has been updated (see example below). This page shows the most relevant crash numbers and gives you access to a new Crashes section that is fully dedicated to crash analysis and investigation.
Set up alerting for detected anomalies
Rather than manually checking your mobile app’s overview page to see if any crashes have occurred, we recommend that you set up anomaly detection rules for crashes so that you receive notifications whenever crashes occur. Dynatrace will then notify you of any unexpected surges and direct you to the relevant problem card that’s been generated for the crash where you can see the affected application and time frame. For details on setting up anomaly detection rules in application settings, see alerting profiles.
Drill-down into the details
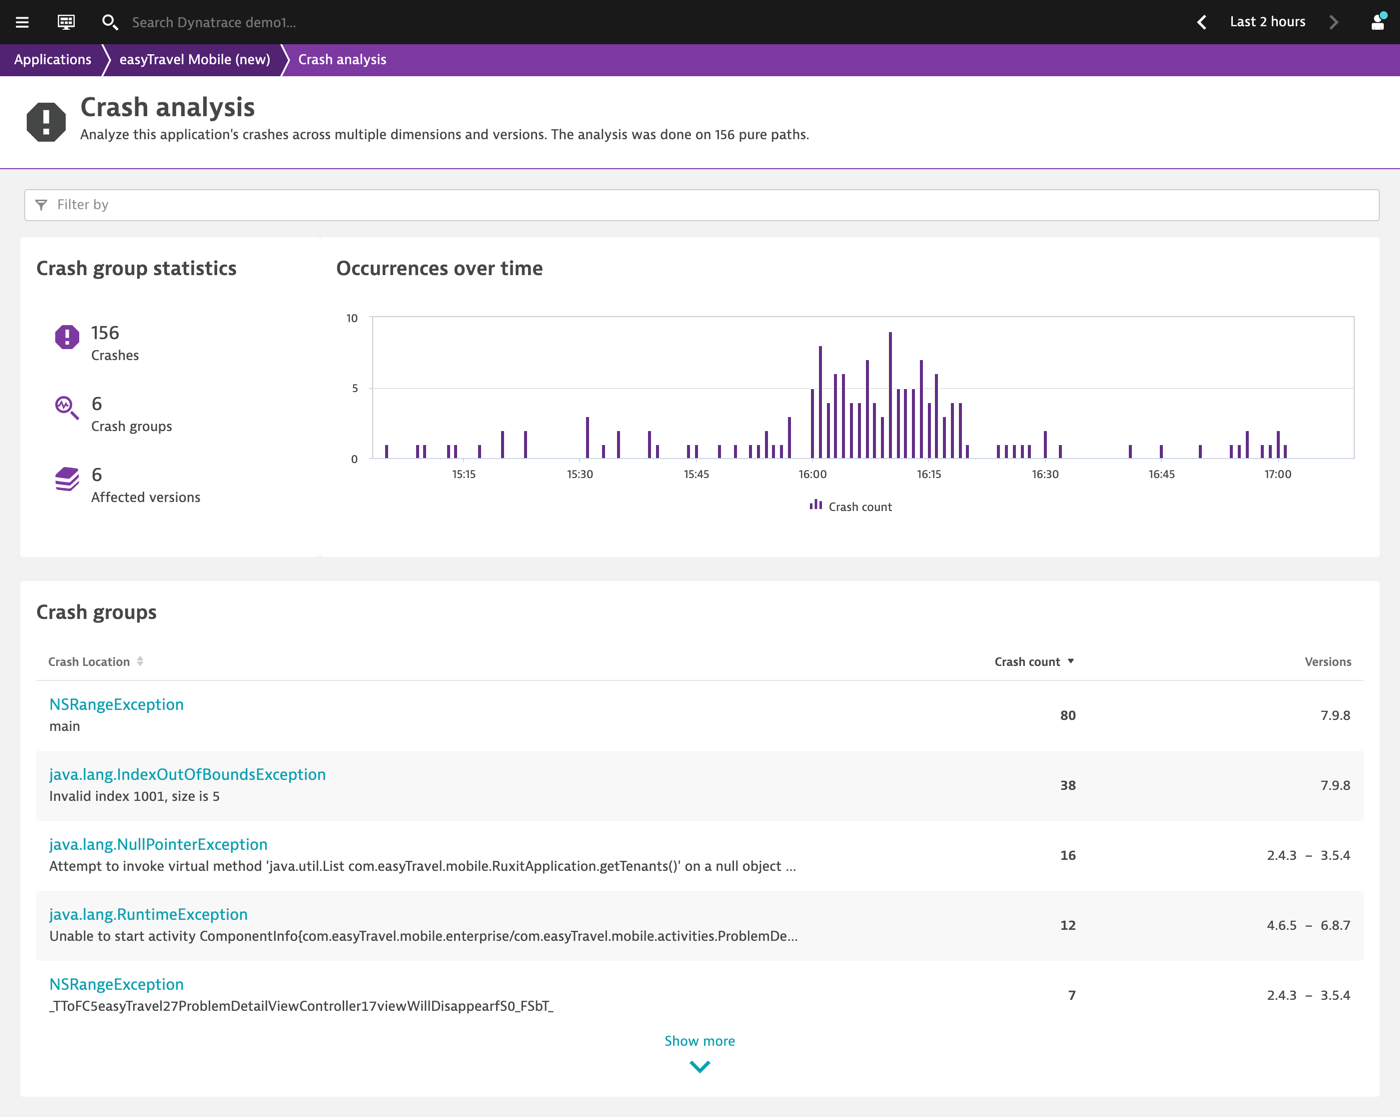
The new Crash analysis section gives you an overview of all crash groups that occurred during the selected time frame and allows you to focus on a range of properties and dimensions that might be specific to the crash pattern. In this way you can analyze mobile app crashes based on version of OS, version of app, or region of user, session duration, connectivity type, and many other dimensions.
Grouping: Dynatrace groups crashes by similarity of the stack trace and occurrence in the source code. This usually also works across different versions of your app, so that you can easily find out if a crash is still present in a new release.
Analyze each crash group in-depth
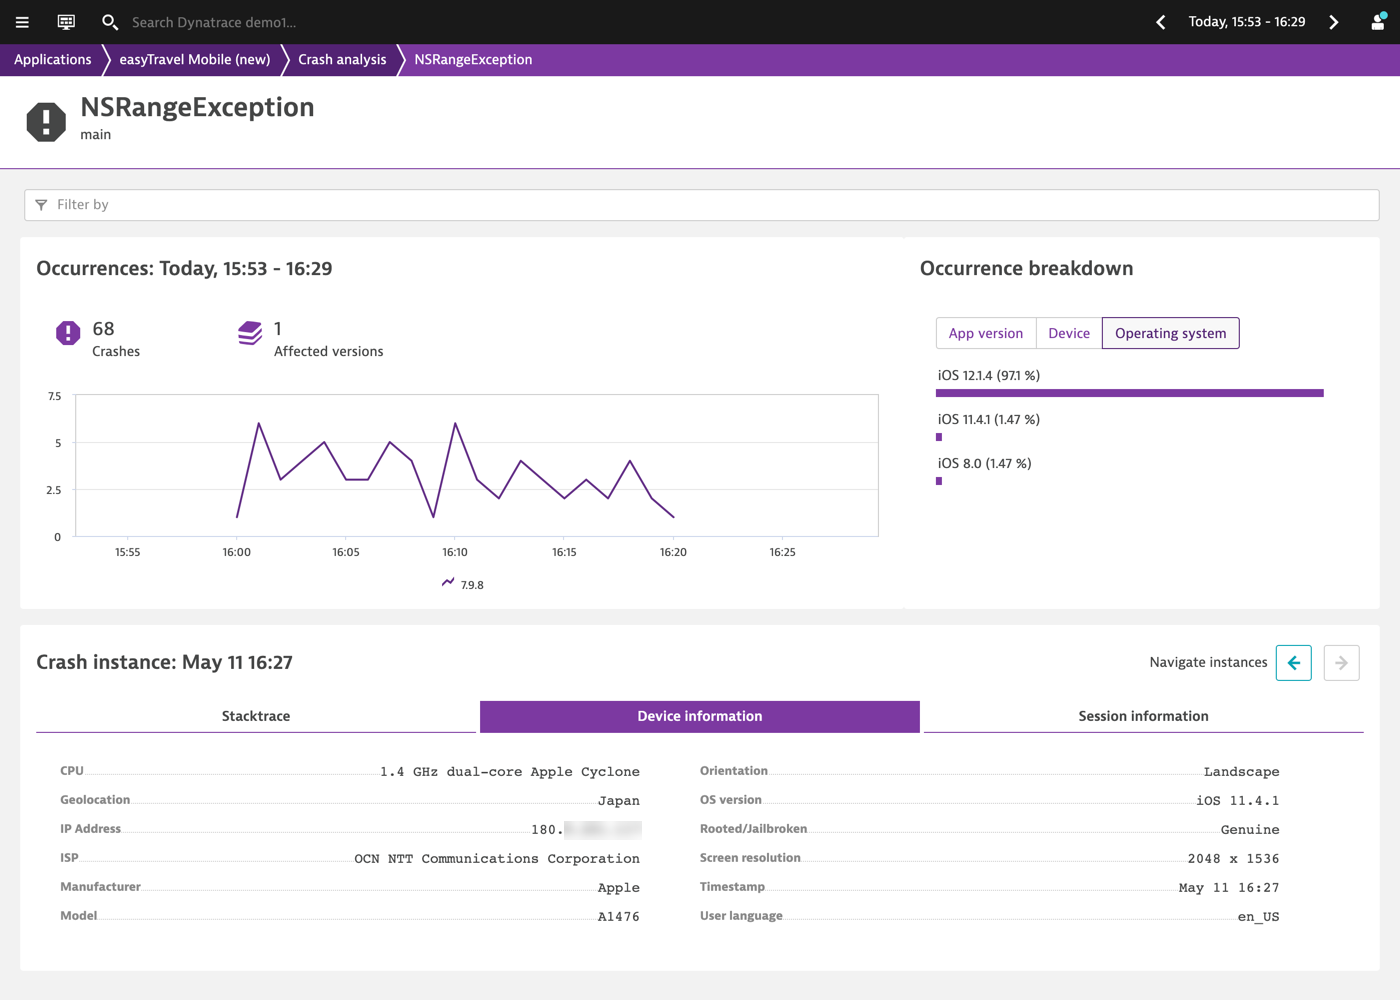
For each crash group there’s a dedicated view. In this view the three most important distributions – app versions, operation system versions, mobile devices – are giving you a quick view on the impact area of this crash group. The view gives you access to each crash instance and it can be filtered to investigate a particular part of the crash group.
Understand your users’ perspective by looking at full user sessions
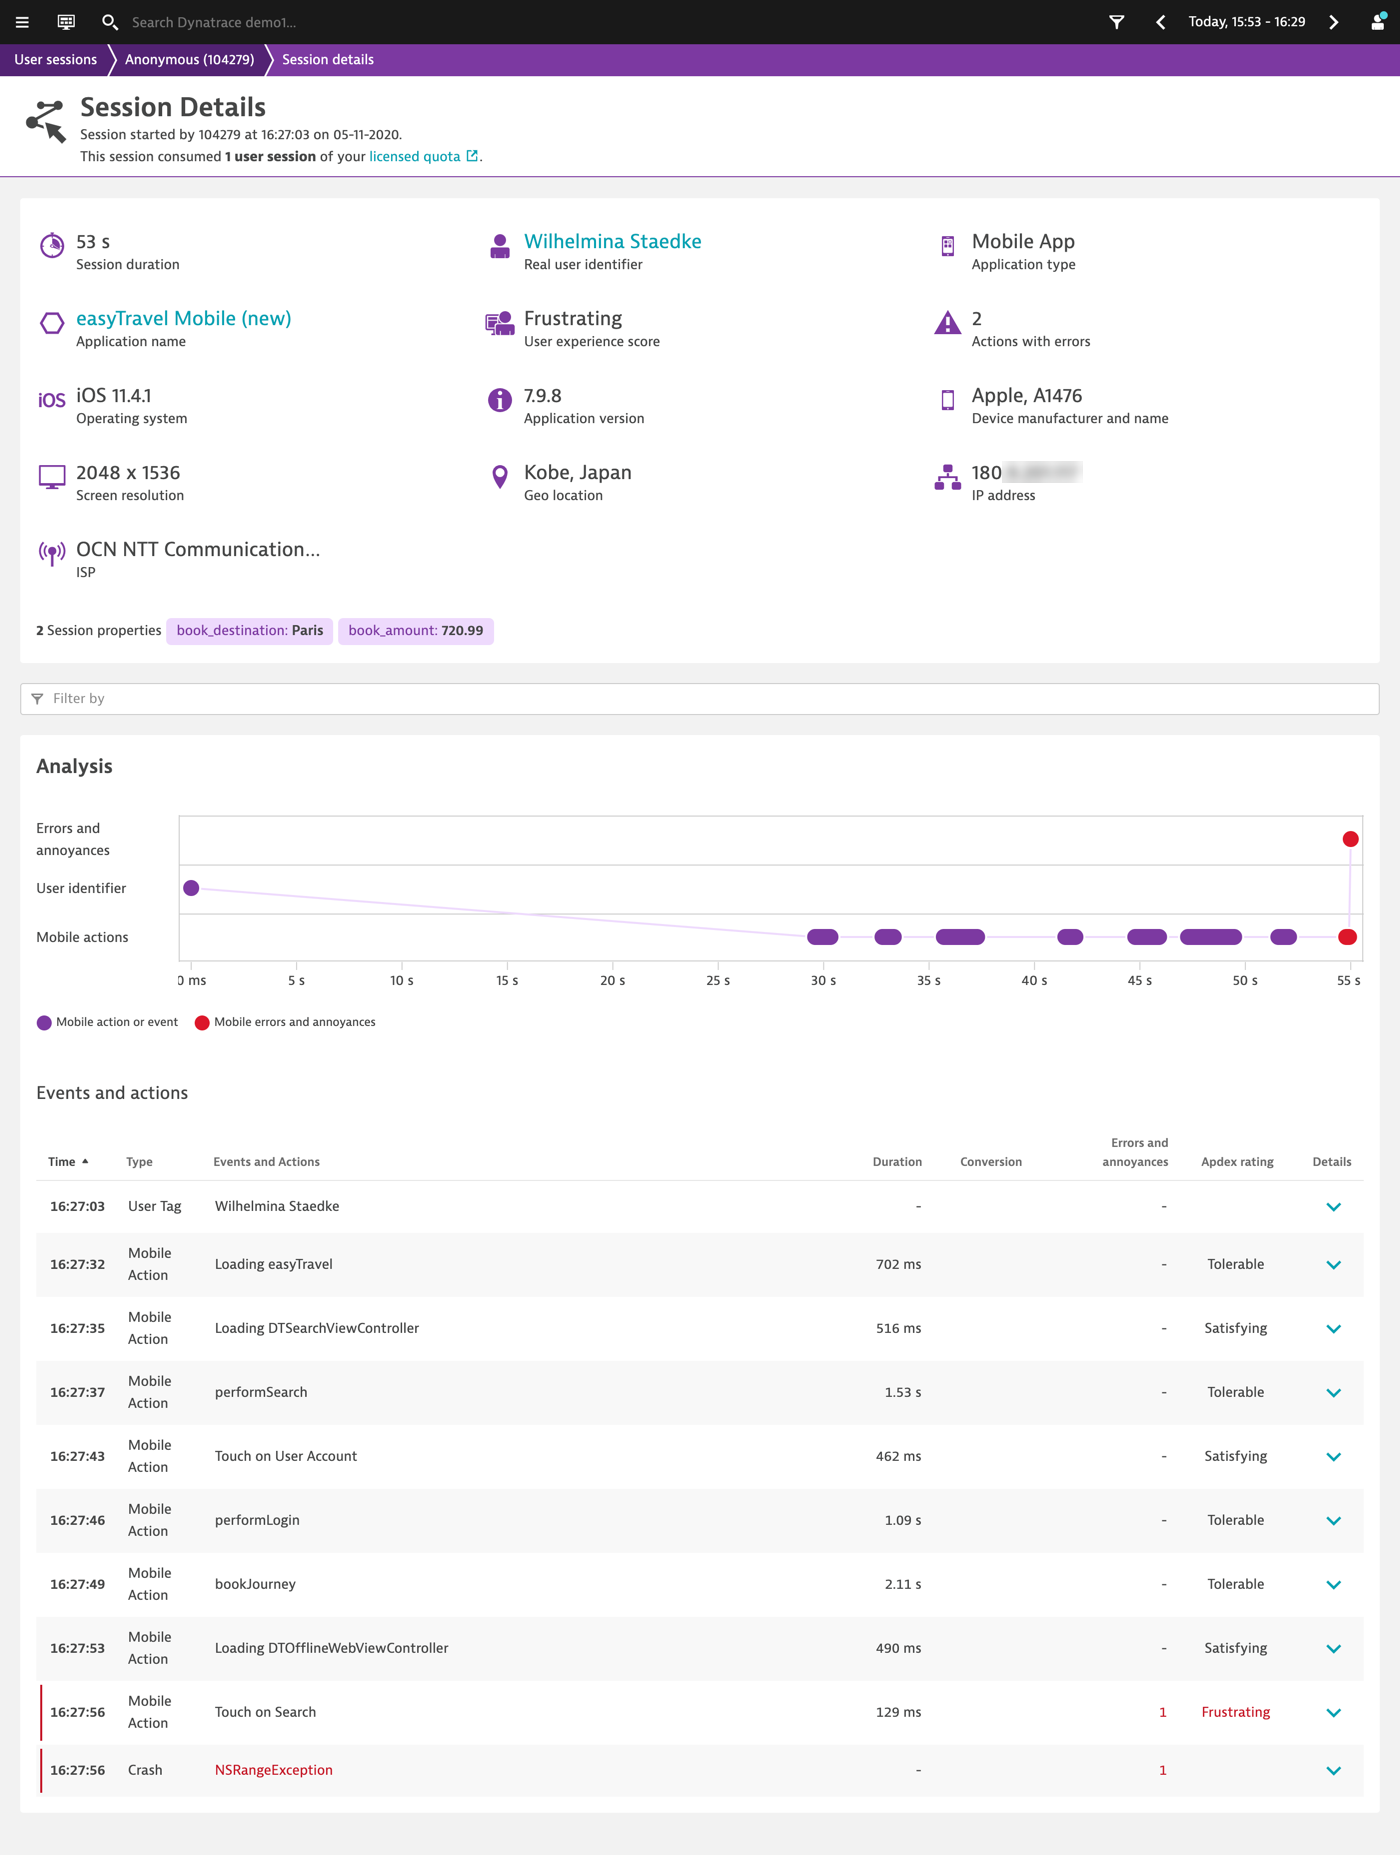
To help you see where a crash occurred from your user’s perspective, we provide a link to the actual crashed user session. Select a representative crash instance using the forward/backward Navigate instances buttons. Once you find the crash you want to analyze, select View full user session on the Session information tab (see example above). This takes you to an overview of the specific user session that led to the crash. A further click gives you a full listing of all that user actions that occurred during the session before the crash (see example below).
Symbol files for faster analysis
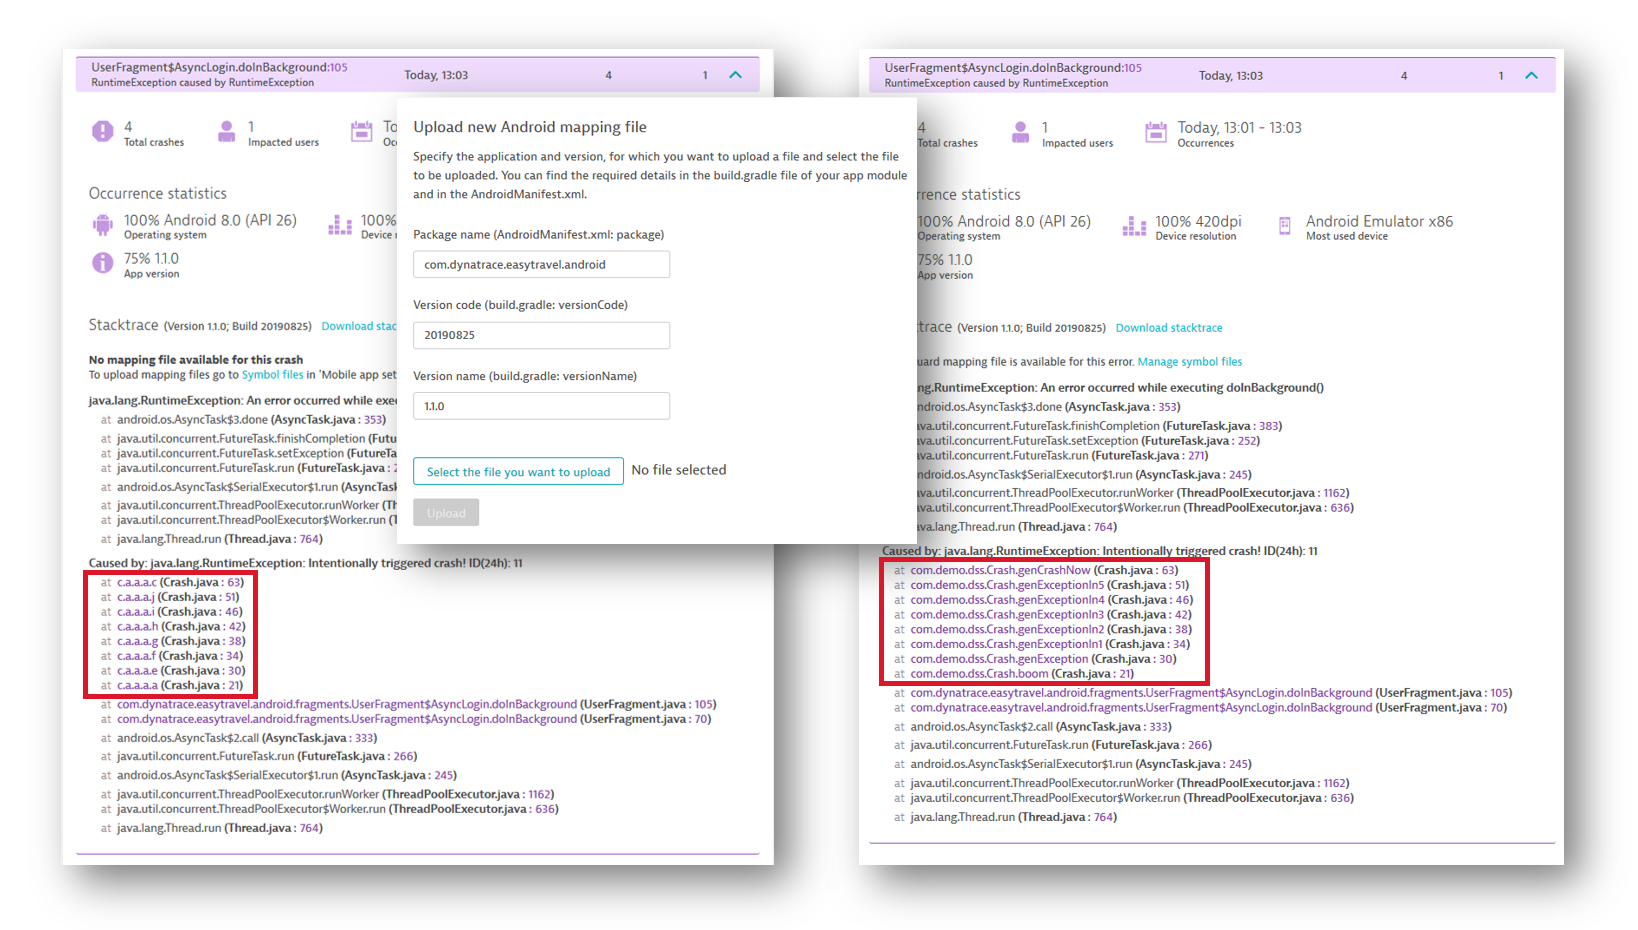
For faster analysis and better reproducability of crashes, we highly recommend that you upload symbol files. Symbol files help to ensure that you see your clear text method names in the stack trace instead of hex codes or cryptic names provided by the obfuscator.
Ideally, symbol files are uploaded as part of your automated deployment process. Please note that due to Apple doing optimizations following upload of iOS app packages to App Store Connect, the symbol files need to be retrieved from Apple following the upload. This can be automated using Fastlane. We’ve collected all the relevant details for managing symbol files in our help page, Upload and manage symbol files.
What’s next
With this change we’ve set the foundation for more improvements to the analysis of mobile app crashes. In upcoming releases we will provide you with even faster options for assessing the criticality of crashes and identifying their root causes. Here are some highlights of what we have in the pipeline:
- Improved underlying storage for faster rendering of charts
- Improved UI that allows you to focus on the most recent app versions
- Improved insights into the user behaviors that led to mobile app crashes
We’d appreciate hearing any questions or suggestions you have may have about these enhancements. Don’t hesitate to share your thoughts with us in the Dynatrace Community.



Looking for answers?
Start a new discussion or ask for help in our Q&A forum.
Go to forum