Quick and easy visualization of user session information across your applications is crucial for ensuring a great user experience. Improve conversion rates, identify and remediate frustration points for your users, and minimize the impact of errors.
We’re pleased to announce the release of enhanced User sessions pages with a new and improved workflow. Now, you can get insights into the dimensions that matter most to your customers and leverage quick searches, filters, and segmentation. With the new page layouts and workflow, you’ll find it easier and quicker to jump directly to what matters.
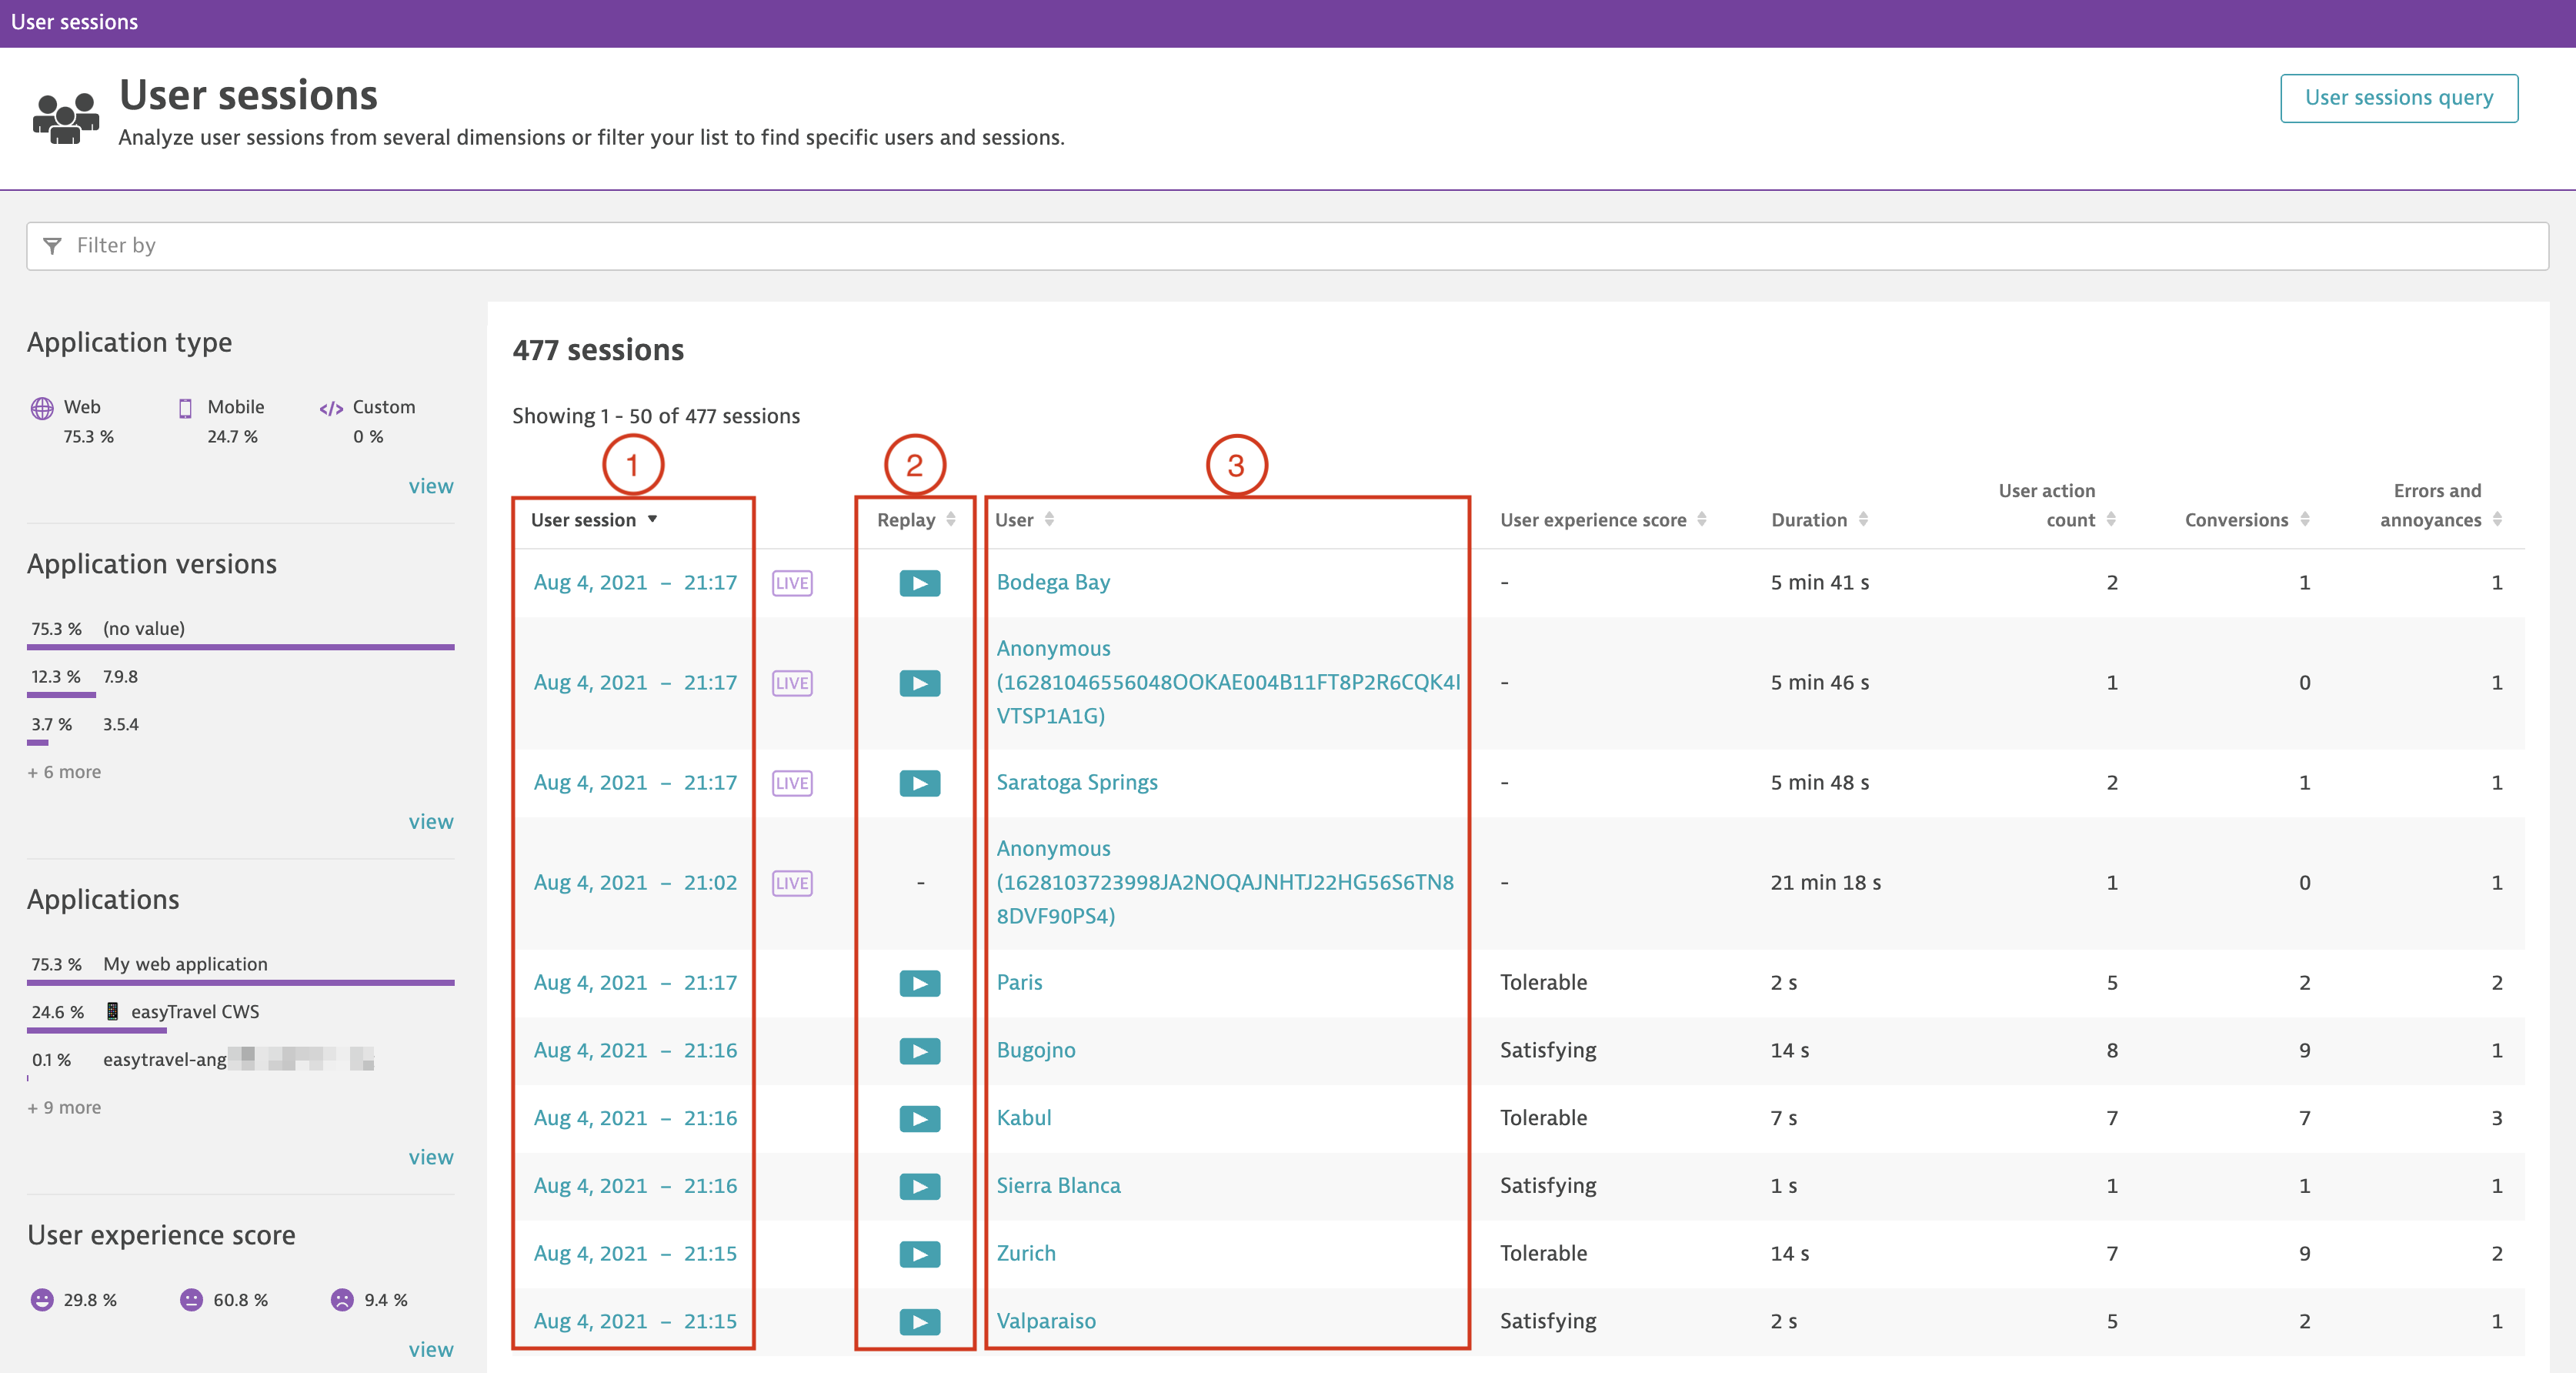
On the new User sessions page, you can:
- Find all details for each session with a direct link to the session and summary information—select the link for more details of actions, events, and errors for that session.
- View what your users were doing with a direct link for the replay of sessions (available when sessions are recorded). You can see how the user navigated through your application, what they selected, and how they might have been impacted by any issues.
- View details of each user with a direct link to a list of sessions and quick findings for the selected timeframe.
See where your users struggle with your applications
Let’s take a look at some use cases that will help you learn where your users struggle with your applications, which applications create the most issues for your users, and where your users encounter the most errors.
Use case 1: Proactive checks—when you’re not sure where to start
As an application owner, you might wish to know whether all your applications have enough traffic, if your users are converting, and if the overall application experience is satisfying for your users.
You can find all of this information on the User sessions page (go to Session segmentation in the Dynatrace menu). You’ll find huge value in the newly introduced findings panel on the left side. Here you’ll gain high-level insights that are aggregated over all users, applications, and user sessions.
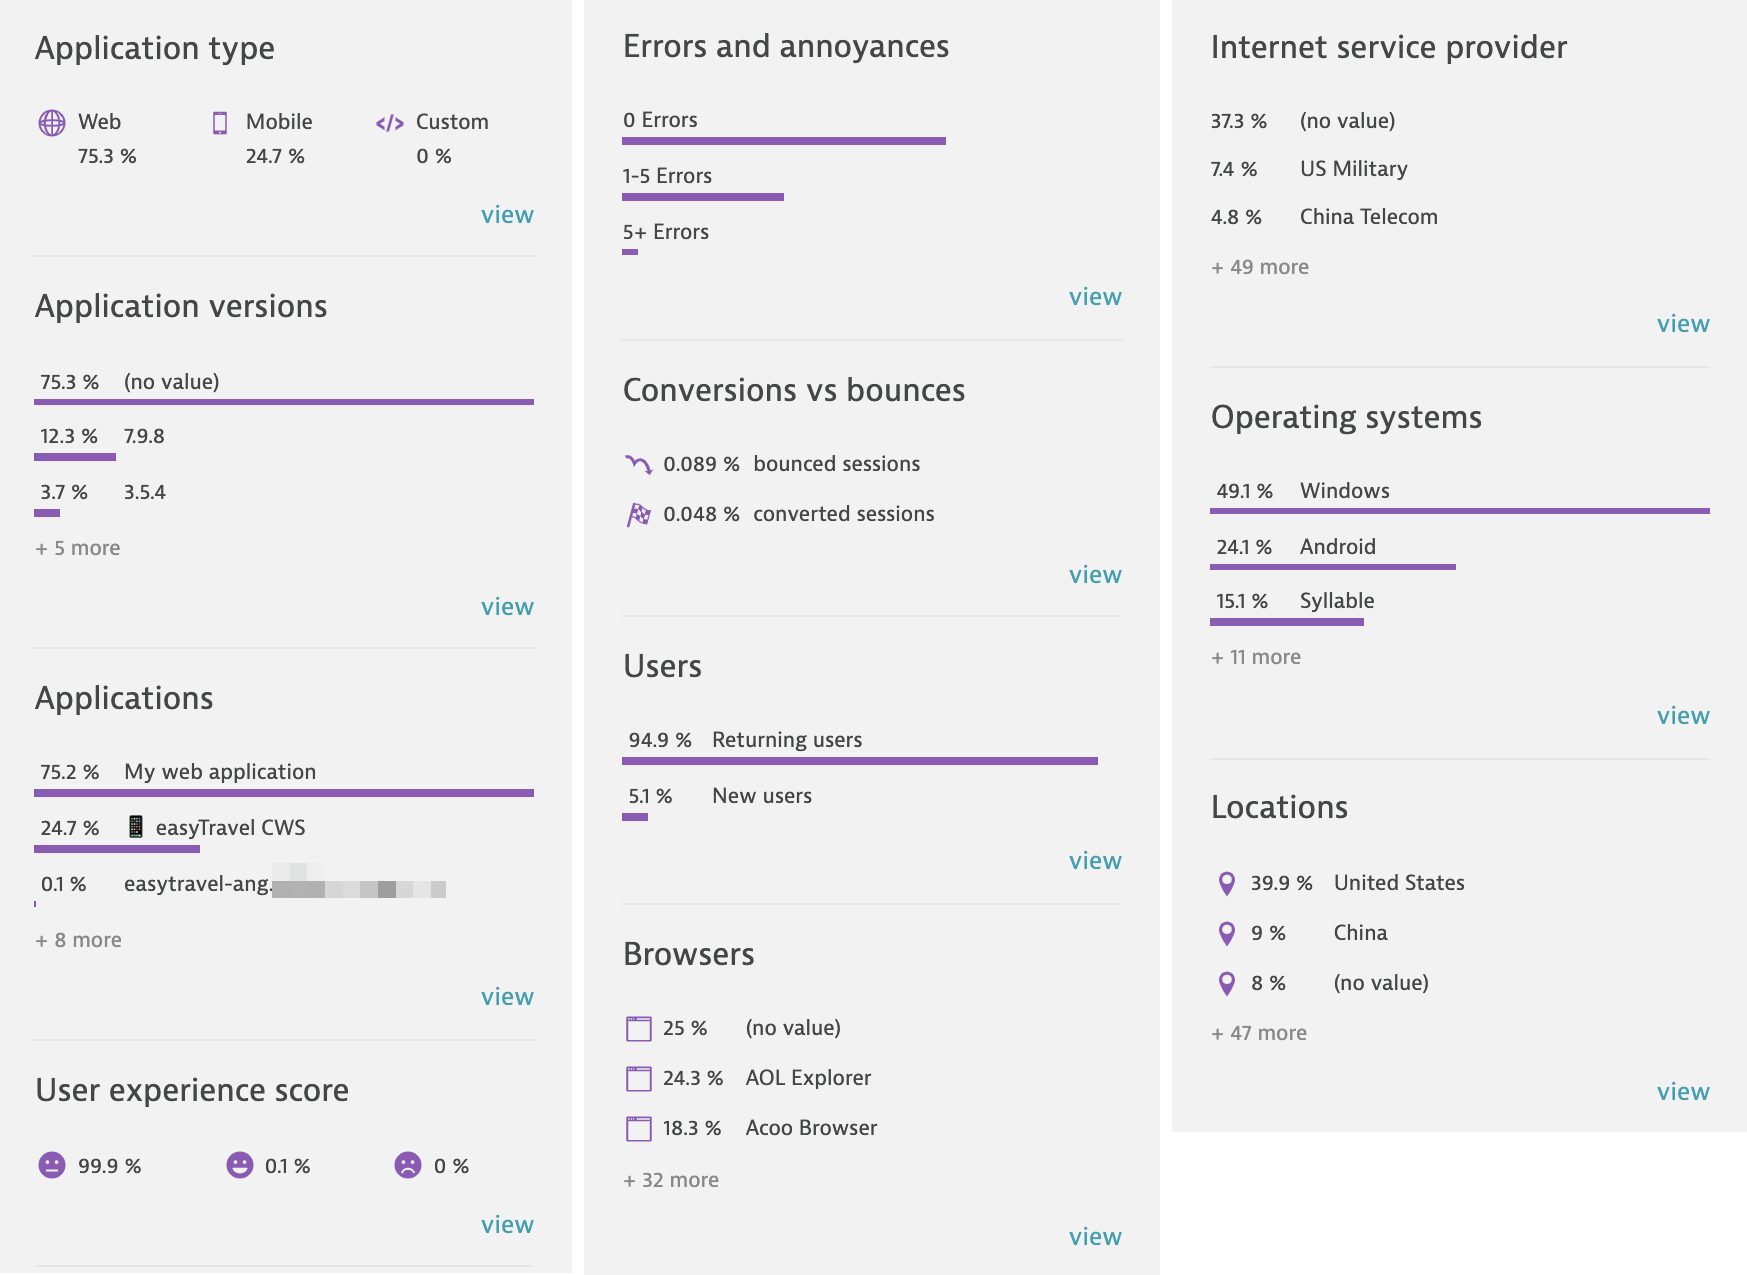
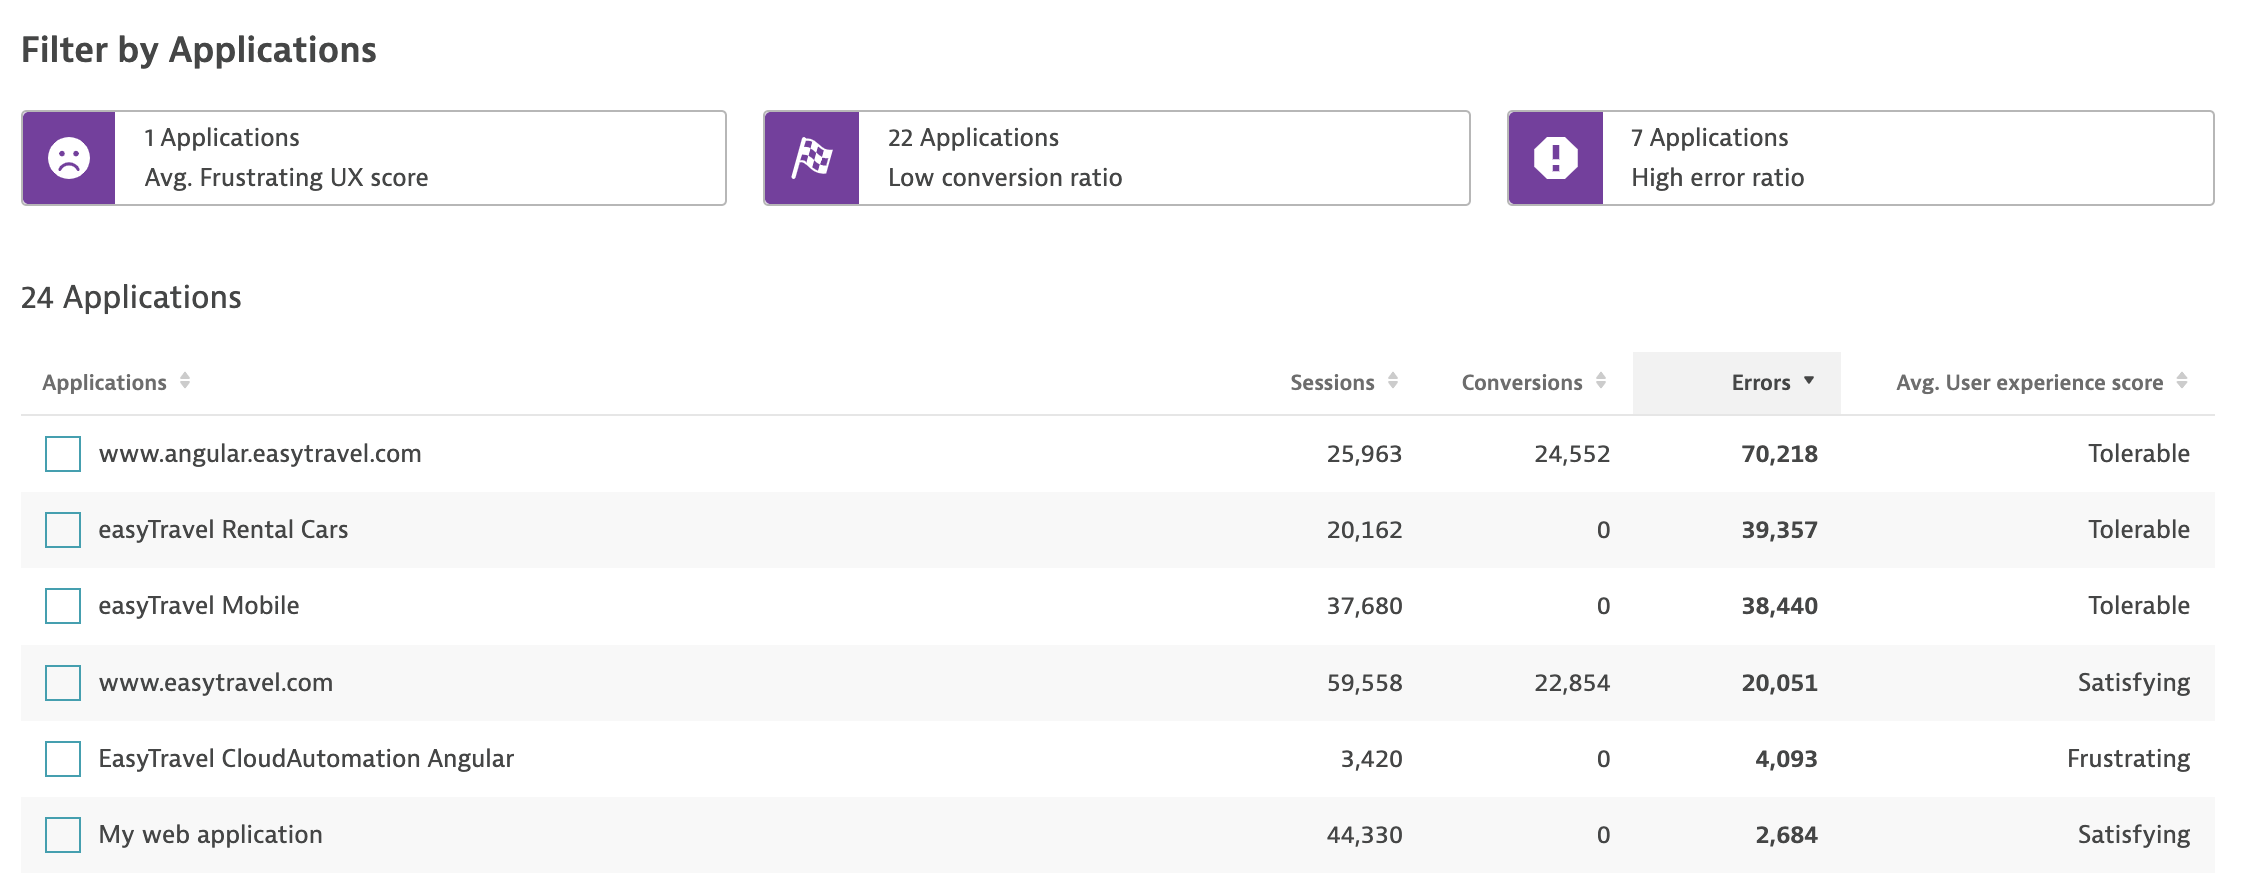
For example, in the Applications section you’ll find a great summary of all of your applications that are currently receiving traffic. Select this to see at a glance which of these applications have poor average user experience scores, lower conversions, or higher error ratios.
The Applications table also allows you to sort the information by any column that you’re interested in (for example, the number of sessions, to see which applications have the most traffic).
These insights are a great starting point for your analysis. That’s why we’ve also provided easy filters so you can drill down into subcategories and refine your selection to find the most important areas of focus.
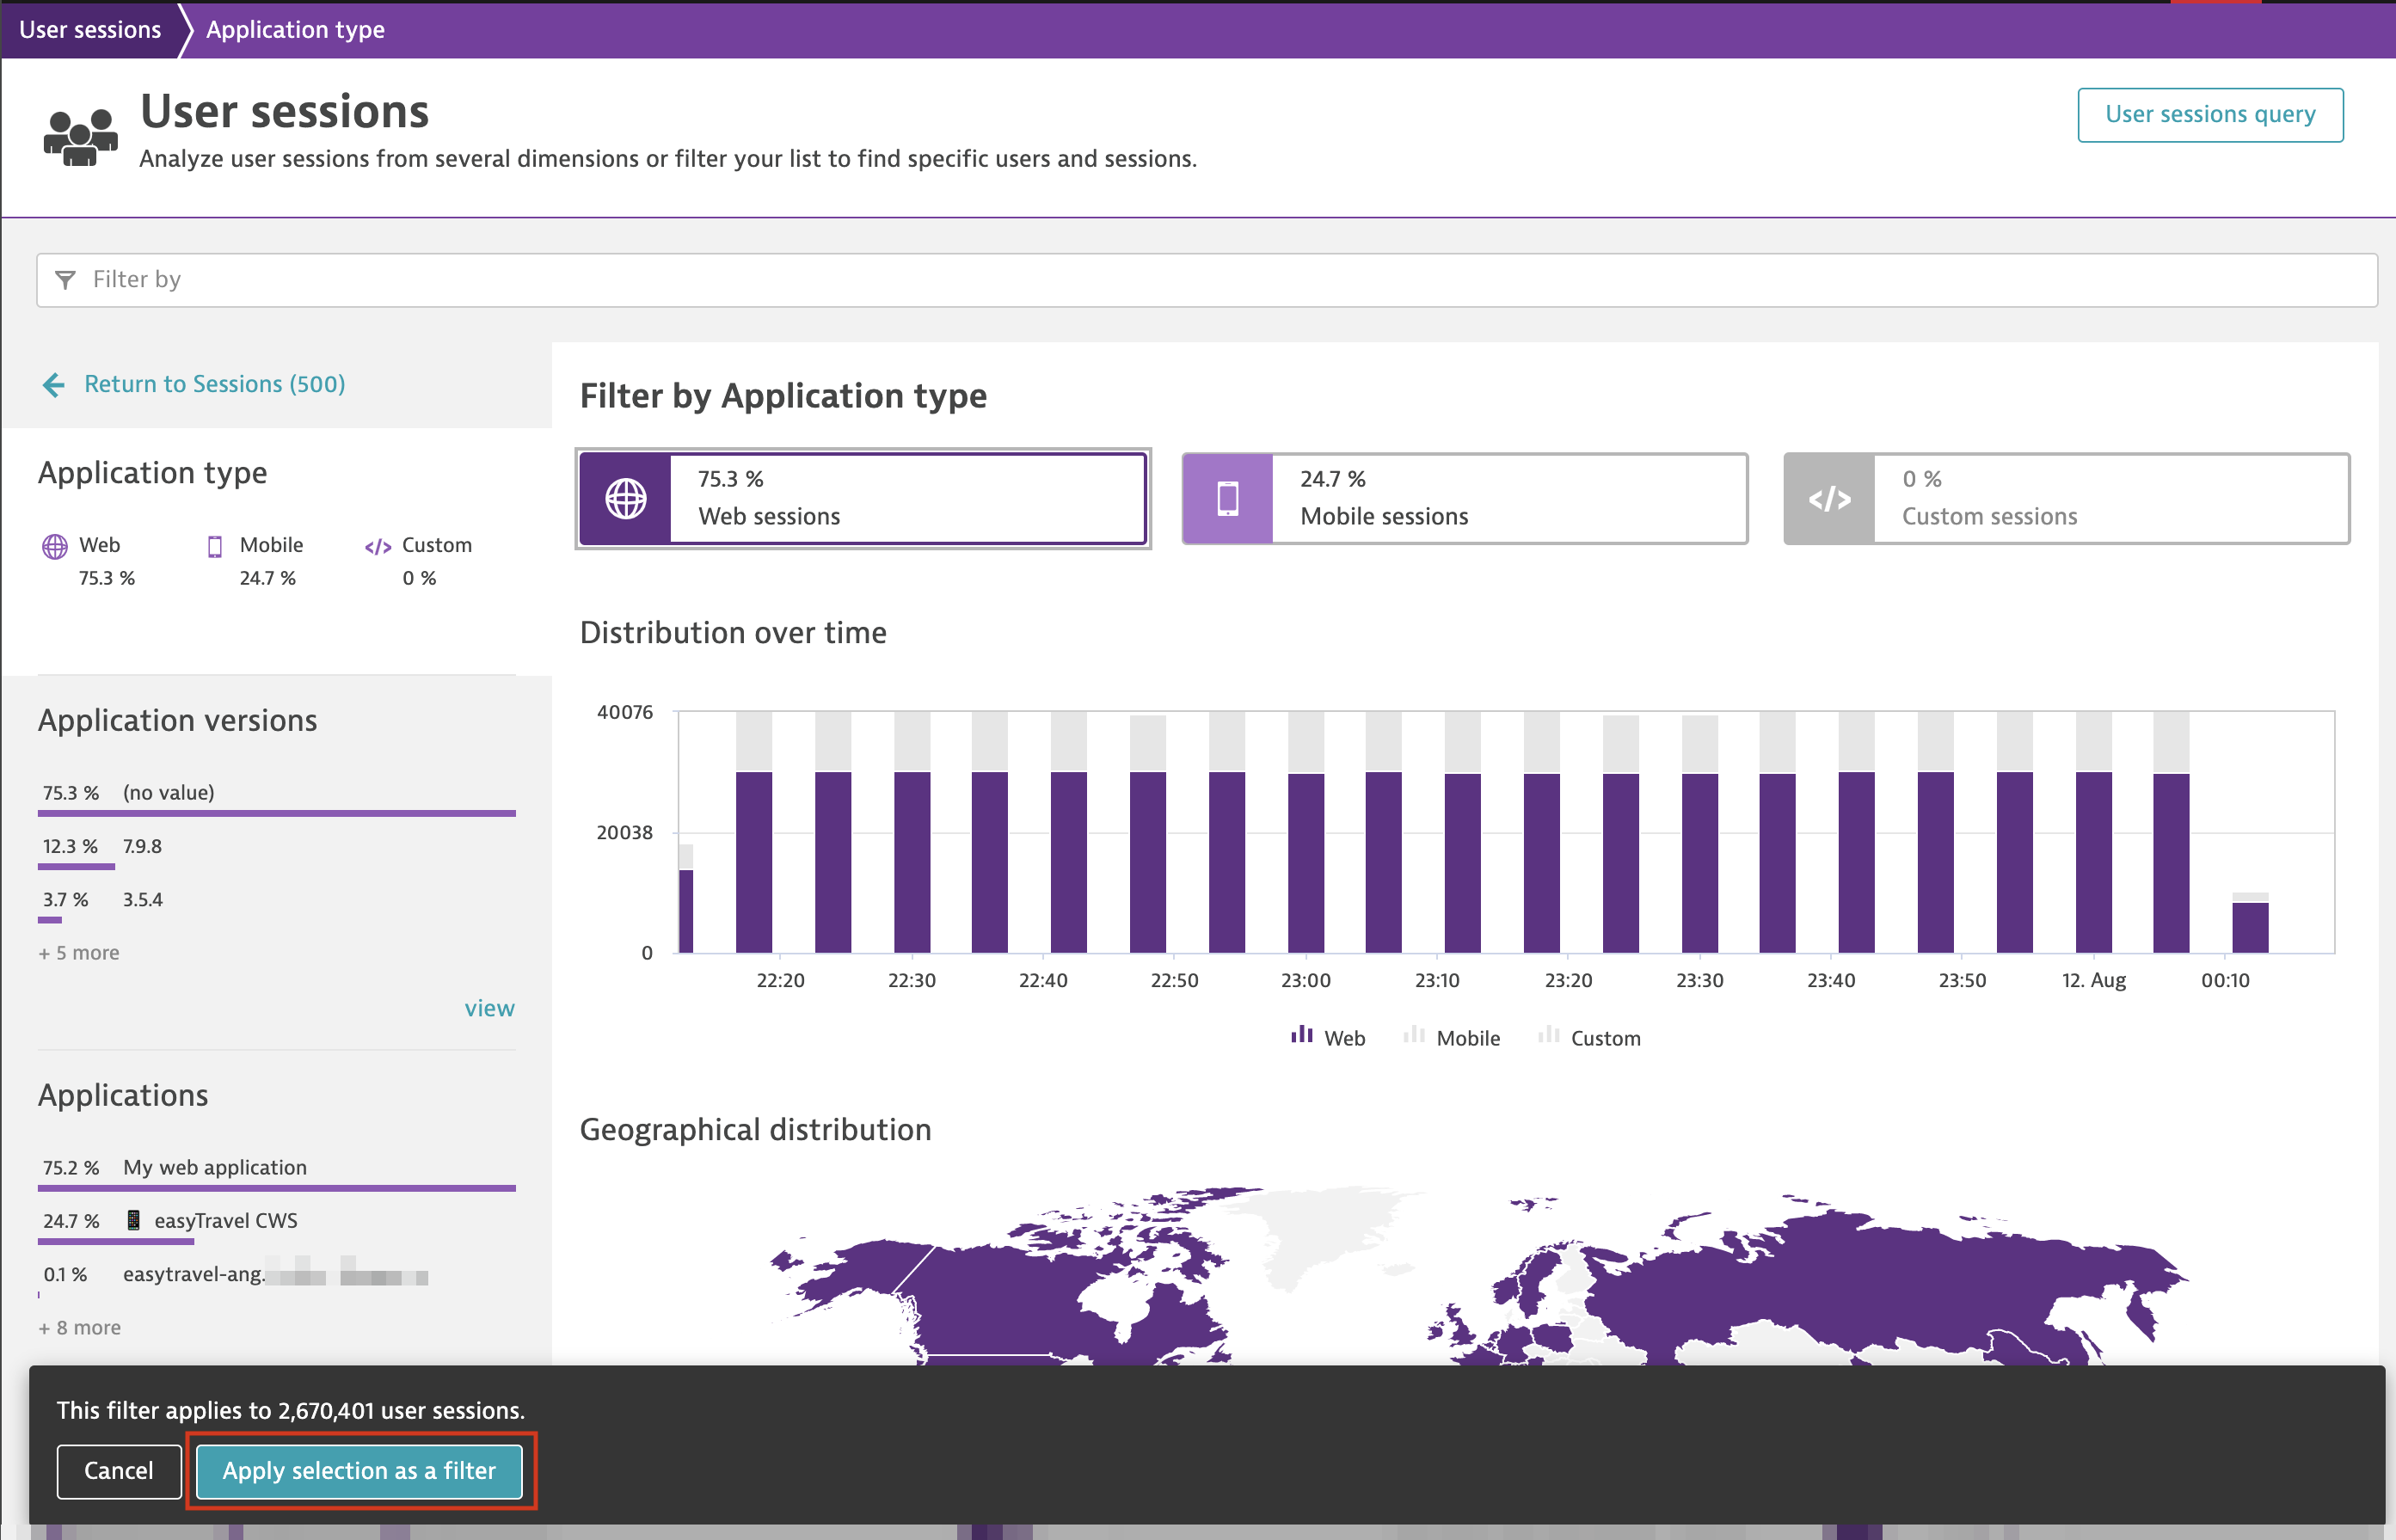
To provide this extra value, we’ve also added the ability to select multiple entities of the same type, such as applications, browsers, or locations. When multiple entities of the same type are selected, an OR filter is applied; if different types of entities are selected, an AND filter is applied. So if you select two different applications and the browser family Chrome, you’ll see filtered session information for all sessions from either application but only in Chrome.
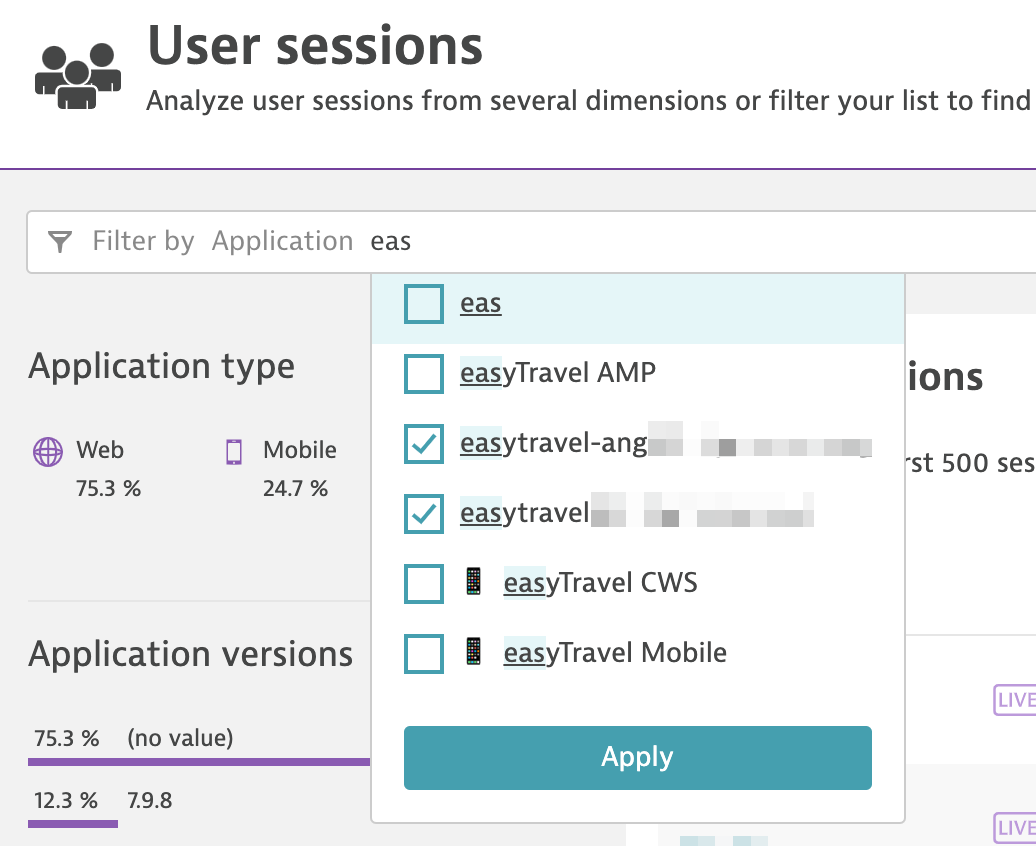

Use case 2: Proactive checks—when you know what you’re looking for
If you already know what you’re looking for, you likely need more information that’s specifically relevant to you. For example, you might be in a situation where you learn that users browsing with Chrome on small-screen devices face issues when trying to purchase certain items. And you might then remember that your team recently introduced a new version of your application specifically for devices with larger screens.
In such a case, you can likely think of some interesting segmentation searches. For example:
- Browser family: = Chrome
- Screen width ≤480 (automatically filters for devices with minimum 320 pixel resolution and also slightly larger devices with resolution around 480 pixels)
You can even add another filter to search directly for sessions with errors:
- Has errors: = Yes
Here’s the resulting filter bar, where you can continue to add a wide range of filters for sessions:

And consider adding some new entries to the list of filters:
- New user action property filters: Date, double, string, and long now enable you to search for sessions that contain your predefined user action properties. These user action filters are in addition to the existing session properties filters.
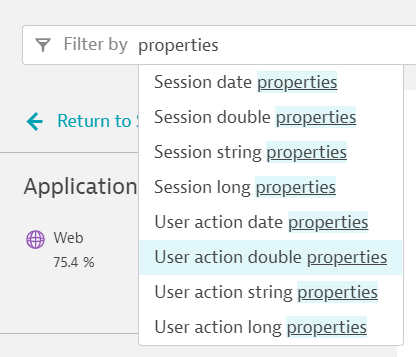
- New error filters: With the new User sessions page, filters for finding sessions with errors are more effective than before. Three different filters now make it easier to search.
- Has errors replaces the Errors filter in the older version of the User sessions page.
- Error count allows you to filter for sessions with a given number of errors, where you can define a range or values: Less than or equal to, Greater than or equal to, or Equals.

- Error type helps you find specific types of errors that you might be interested in, such as JavaScript errors.

- Resolution filters: Resolution can be searched via two new options, Screen height and Screen width, allowing for a new range of options. This is especially useful in the case of web applications where each user might be on a device with a totally different resolution.
Try it out
With the release of Dynatrace version 1.224, you can jump in and try out the totally redesigned User sessions page via the banner notification—simply turn on Try it now.

Your feedback matters a lot to us. Please don’t forget to select Give us feedback and tell us what you think.

And stay tuned for the next installment in this blog series for more interesting use cases in navigating user sessions.
If you’re new to Dynatrace
Start your free trial today and gain unmatched insights into the digital experience of all your web and mobile apps.


Looking for answers?
Start a new discussion or ask for help in our Q&A forum.
Go to forum