Dynatrace is proud to announce our first set of fully integrated, worldwide, multi-cloud, and high-availability public locations for HTTP monitoring. You can now detect regional issues by leveraging a range private and public Synthetic locations.
With today’s high expectations for the speed and availability of applications, you need a deep understanding of real user experiences to make the best business decisions. Dynatrace Digital Experience Monitoring, as part of the Dynatrace Software Intelligence Platform, connects front-end monitoring and the outside-in user perspective with application performance to understand the impact of performance issues across your full stack on user experience and business outcomes. Dynatrace Synthetic Monitoring ensures that your application is available and performs well from anywhere in the world to meet your SLAs.
With synthetic HTTP monitors, you can now also cover all endpoints that don’t directly expose a front end. These can be APIs used by your mobile apps or health-check endpoints provided by microservices. HTTP monitors are lightweight and a perfect fit for monitoring coverage for everything delivered via HTTP/S.
Get an outside-in view of all your applications with Dynatrace Synthetic Monitoring
Dynatrace Synthetic Monitoring helps you quickly verify if your application is delivering the expected end user experience by offering an outside-in view of all your applications and services, independent of real traffic. Synthetic monitors are executed at defined intervals from various locations to catch regional issues from a clean-room environment so each execution has exactly the same conditions. Synthetic Monitoring helps you cover use cases such as:
- Reporting SLA/SLOs internally as well as externally.
- Being alerted as soon as a critical endpoint/transaction is unavailable.
- Receiving immediate insights on performance changes from a clean-room environment.
- Detecting regional issues by leveraging private and public Synthetic locations.
Previously, you had to deploy a private Synthetic location in order to use HTTP monitors. We’re now proud to announce the first set of fully integrated, worldwide, multi-cloud, and high-availability public locations for HTTP monitoring.

Directly create HTTP monitors via the Dynatrace web UI or API
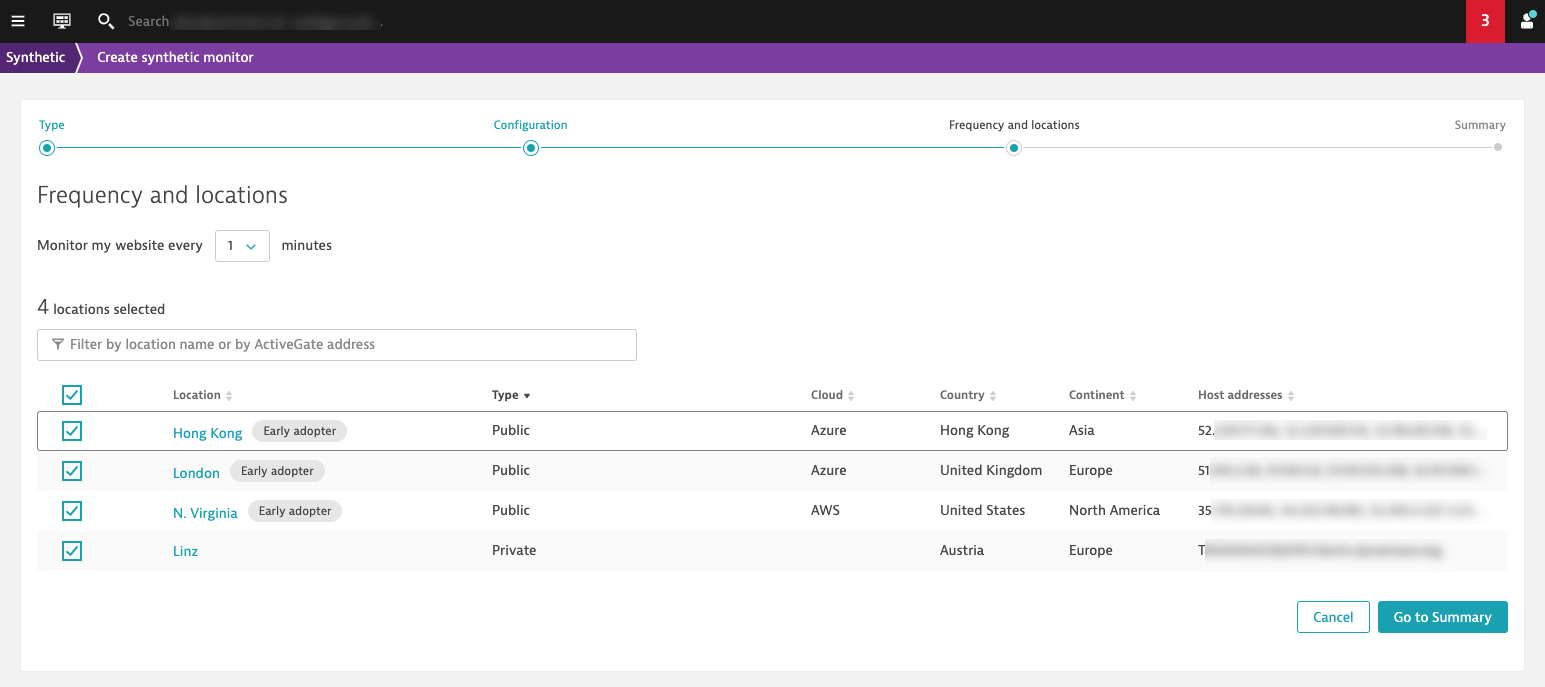
The newly added public locations are fully managed by Dynatrace and allow you to get started with HTTP monitors right away. This means you can now directly create HTTP monitors via the Dynatrace web UI or the API without any prerequisites—you don’t have to worry about maintaining Synthetic locations yourself. Here is the first batch of 15 public locations for HTTP monitoring:
- Chicago (Azure), Virginia (Azure), N. Virginia (AWS), N. California (AWS), San Jose (Azure), Texas (Azure), Ohio (AWS), Toronto (Azure), London (AWS), London (Azure), Frankfurt (AWS), Sydney (AWS), Hong Kong (Azure), Tokyo (Azure), Sao Paulo (AWS)
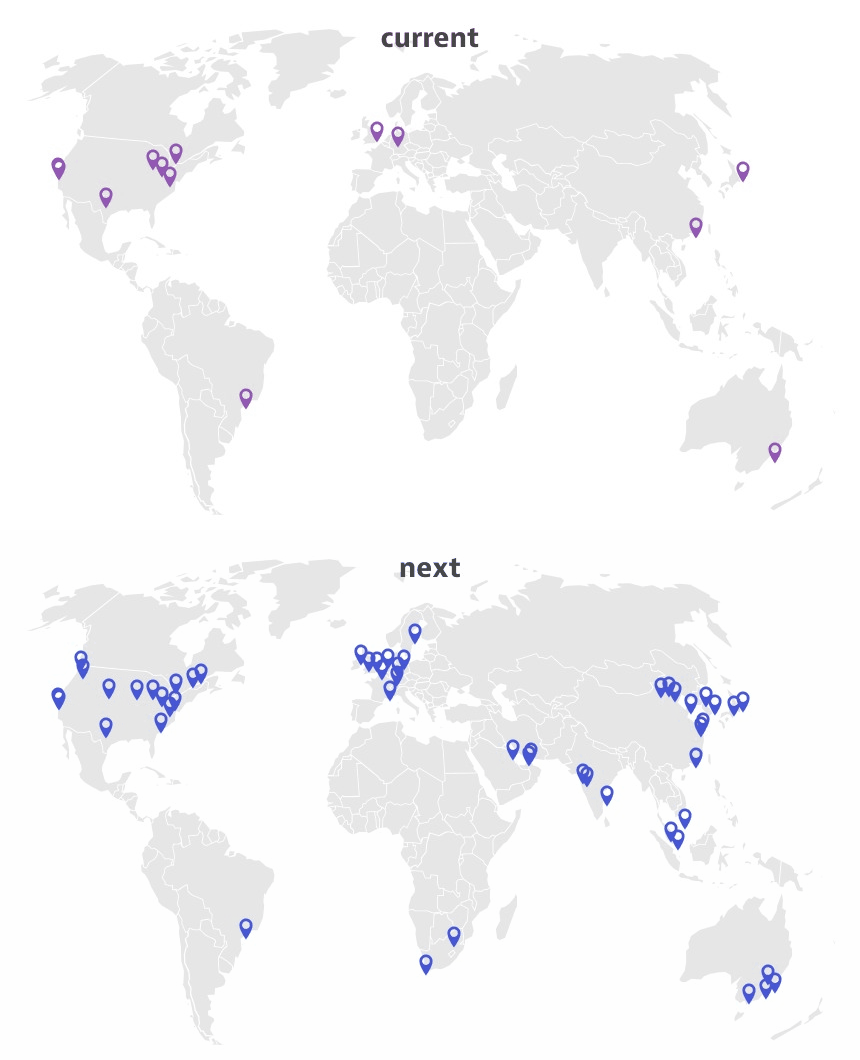
We’ll expand the number of public HTTP locations in the upcoming weeks to fully match our public location offering for browser monitors, which currently stands at 72 locations. Please ensure that your endpoints are available publicly or exclude the location IP addresses from your firewall rules. HTTP monitor locations use the same set of IP addresses as the browser monitoring locations. And, as before, you can always use private Synthetic locations that are located within your network infrastructure to measure complex internal applications and APIs.
What makes Dynatrace HTTP monitors unique?
All features previously available for private HTTP monitors are also available from the public locations. Here are some of the highlights that make HTTP monitors on the Dynatrace platform unique.
Full integration into the Dynatrace platform
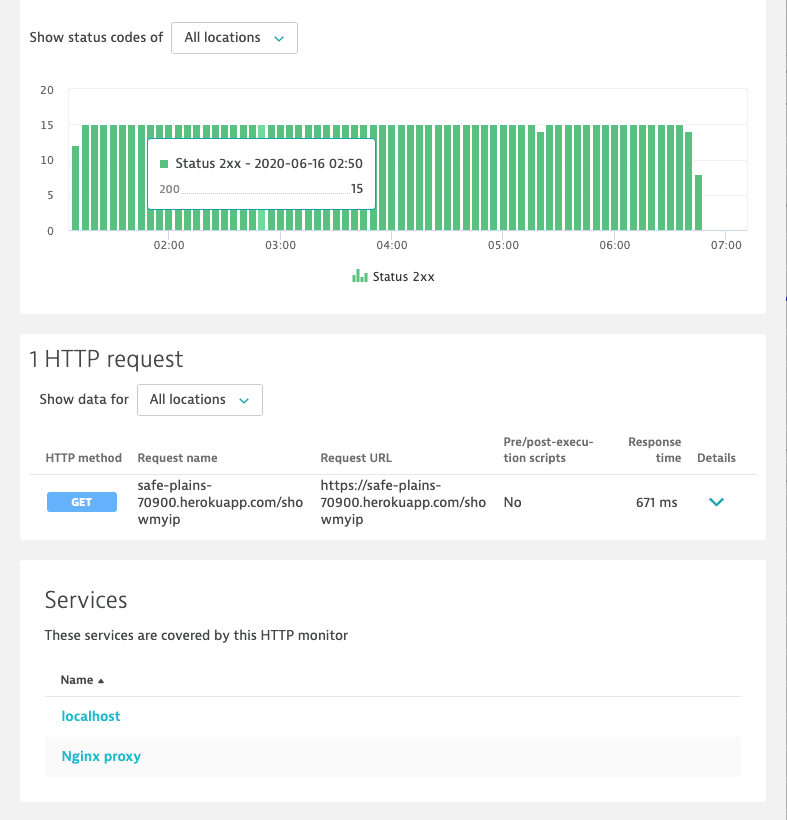
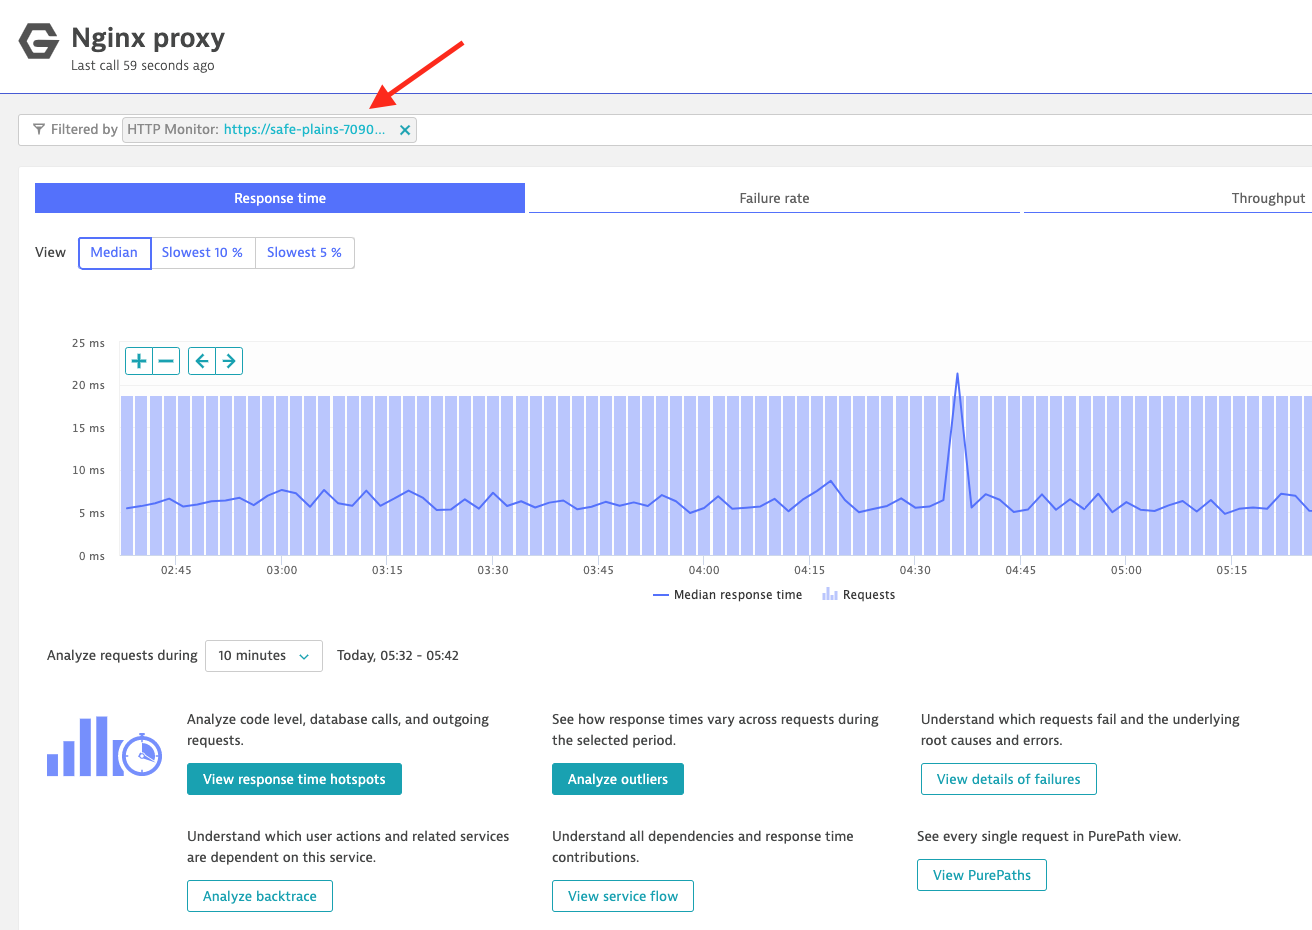
HTTP monitors are fully integrated into Dynatrace and provide you with an additional layer of visibility into your applications and services. Dynatrace automatically detects if an HTTP monitor is running against a service that is already monitored by OneAgent and links them together. With just one click, you can drill down to the service, which is filtered for requests coming from the HTTP monitor.
This allows you to compare synthetic traffic to real traffic, look at service flow to understand all involved dependencies, and even drill down to the code level to understand failures and root causes.
Automated SLA/SLO monitoring using the HTTP monitoring API
HTTP monitors are not only great for monitoring API endpoints. They provide a complete API that allows you to automate SLA monitoring and SLO monitoring. You can create, modify and delete HTTP monitors using the API. Automating the process of setting up HTTP monitors can make your Ops life a lot easier, as Andreas Grabner explains in his recent blog post.
Additionally, you can also query all metrics captured by an HTTP monitor to build reports and present data to various stakeholders.
Execution of complex transactions via scripting
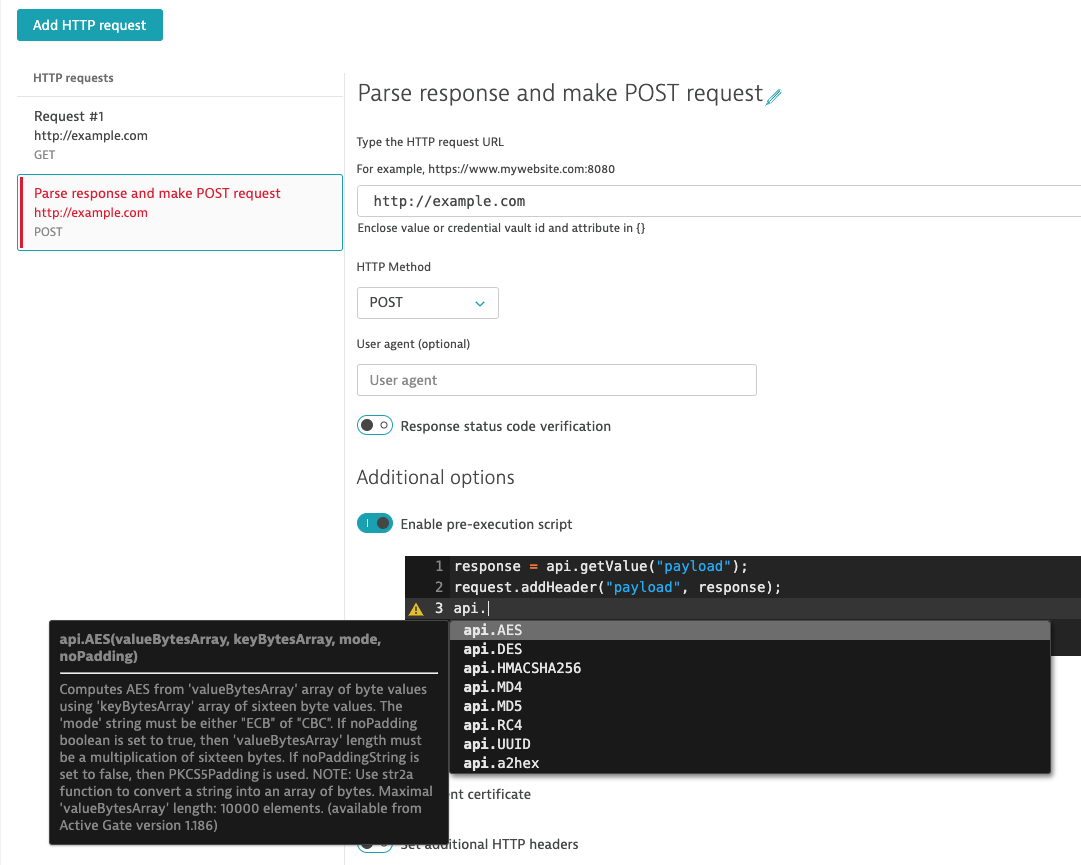
With Dynatrace HTTP monitors, you can chain multiple requests (GET, POST, PUT, DELETE, HEAD, PATCH, OPTIONS) together. You have full control over each request and can configure HTTP headers, valid status codes, as well response validation. Additionally, you have the option to add pre- and post-execution scripts. These enable you to add custom logic between HTTP monitor requests to do things like parsing the response, modifying the request URL, or skipping requests under certain conditions. To learn more about and pre- and post-execution scripts (with examples), check out Dynatrace Help.
But wait, there’s more!
- Support for OAuth 2.0, NTLM, and basic authentication
- Storage and management of credentials via the Synthetic Monitoring credential vault
- Prebuilt methods for encoding, generation of random values, and date formatting for pre-execution scripts
- Easy configuration via the UI or in script mode
- Full integration into the Dynatrace platform (custom charts, API, custom events, integration with Slack/PagerDuty, etc.)
How to get started
Creating a new HTTP monitor is easy—simply select Synthetic from the Dynatrace navigation menu, then select Create a synthetic monitor > Create an HTTP monitor.
For a simple monitor, just provide a name and the URL for the first request. Then Select frequency and locations from the new public HTTP monitoring locations. After you’ve created the monitor, it will be scheduled to run from the selected locations, and the first results will show up in the UI.
HTTP monitors vs. browser monitors
Dynatrace offers both HTTP and brower monitors. It’s important to understand the differences between these kinds of synthetic monitors to better decide when to use them.
HTTP monitors execute single HTTP/S requests. You have full control over each request and can also chain them together to solve more complex use cases. You can think of them as similar to executing a curl command (with no browser involved): curl https://example.com.
Browser monitors, on the other hand, use a real browser (Chrome) to monitor the availability of a web application or the most important user-facing workflows (clickpaths) through your application. A browser monitor also begins with a single (GET) request after you enter a URL into the address bar. However, a lot more happens after that. Modern applications make hundreds of requests and also make heavy use of JavaScript.
| HTTP monitors | Browser monitors |
|
|
Summary and what’s next
HTTP monitors are great for monitoring uptime, performance, as well as your defined SLA/SLOs. With the new public locations for HTTP monitors, Dynatrace provides global coverage as well as fully managed and highly available locations. These new locations allow you to get started with HTTP monitoring right away without the need to deploy any extra component.
We’re also already busy working on the next improvements, such as access to execution details like the response and HTTP headers or logs, an updated UI for the HTTP monitor details page based on your feedback, and linking HTTP monitors to custom and mobile applications. So stay tuned!
Related blog posts:


Looking for answers?
Start a new discussion or ask for help in our Q&A forum.
Go to forum