Accelerated delivery is one of the key principles of good user experience, and improved user experience leads to a better bottom line for companies. Customers enjoy using your digital channels more and buy more from your company. One recent public example is Zalando, a German retailer. By improving their load time by 100 ms, they increased their revenue by 0.6%.
For years, Dynatrace has helped companies across the world with our Real User Monitoring and Synthetic Monitoring solutions for managing application performance. Apdex is an industry standard that has existed since the early days of Web Performance Optimization (WPO). However, times have changed; today’s web applications no longer consist simply of page loads. With Single Page Applications (SPA), it has become crucial to see and manage the performance of non-page-load interactions that are triggered by user input. In Dynatrace, we call these “XHR user actions” as they usually generate an XHR request, but they can also be Fetch API calls.
The other thing that’s changed is the user expectations for the performance of these lighter weight interactions—To keep user experience high, they must be much faster than overall page load. The way Apdex defines performance levels (with reference to user experience)—satisfied, tolerable, and frustrating—needs to be examined. All you had to do previously was define the threshold for the level at which user experience changed from satisfied to tolerable; 4x this threshold defined the starting point for the frustrating level. As easy as Apdex levels are to understand, the way they’re calculated is now outdated. So we’ve improved our solution to meet changing customer needs.
Define and measure user experience levels (even in legacy browsers)
We took the next step to help you manage the performance and set targets for your user experience more easily while keeping the simplicity of user experience levels. With the release of Dynatrace version 1.181, Apdex configuration is more flexible and adaptable to today’s modern application landscapes.
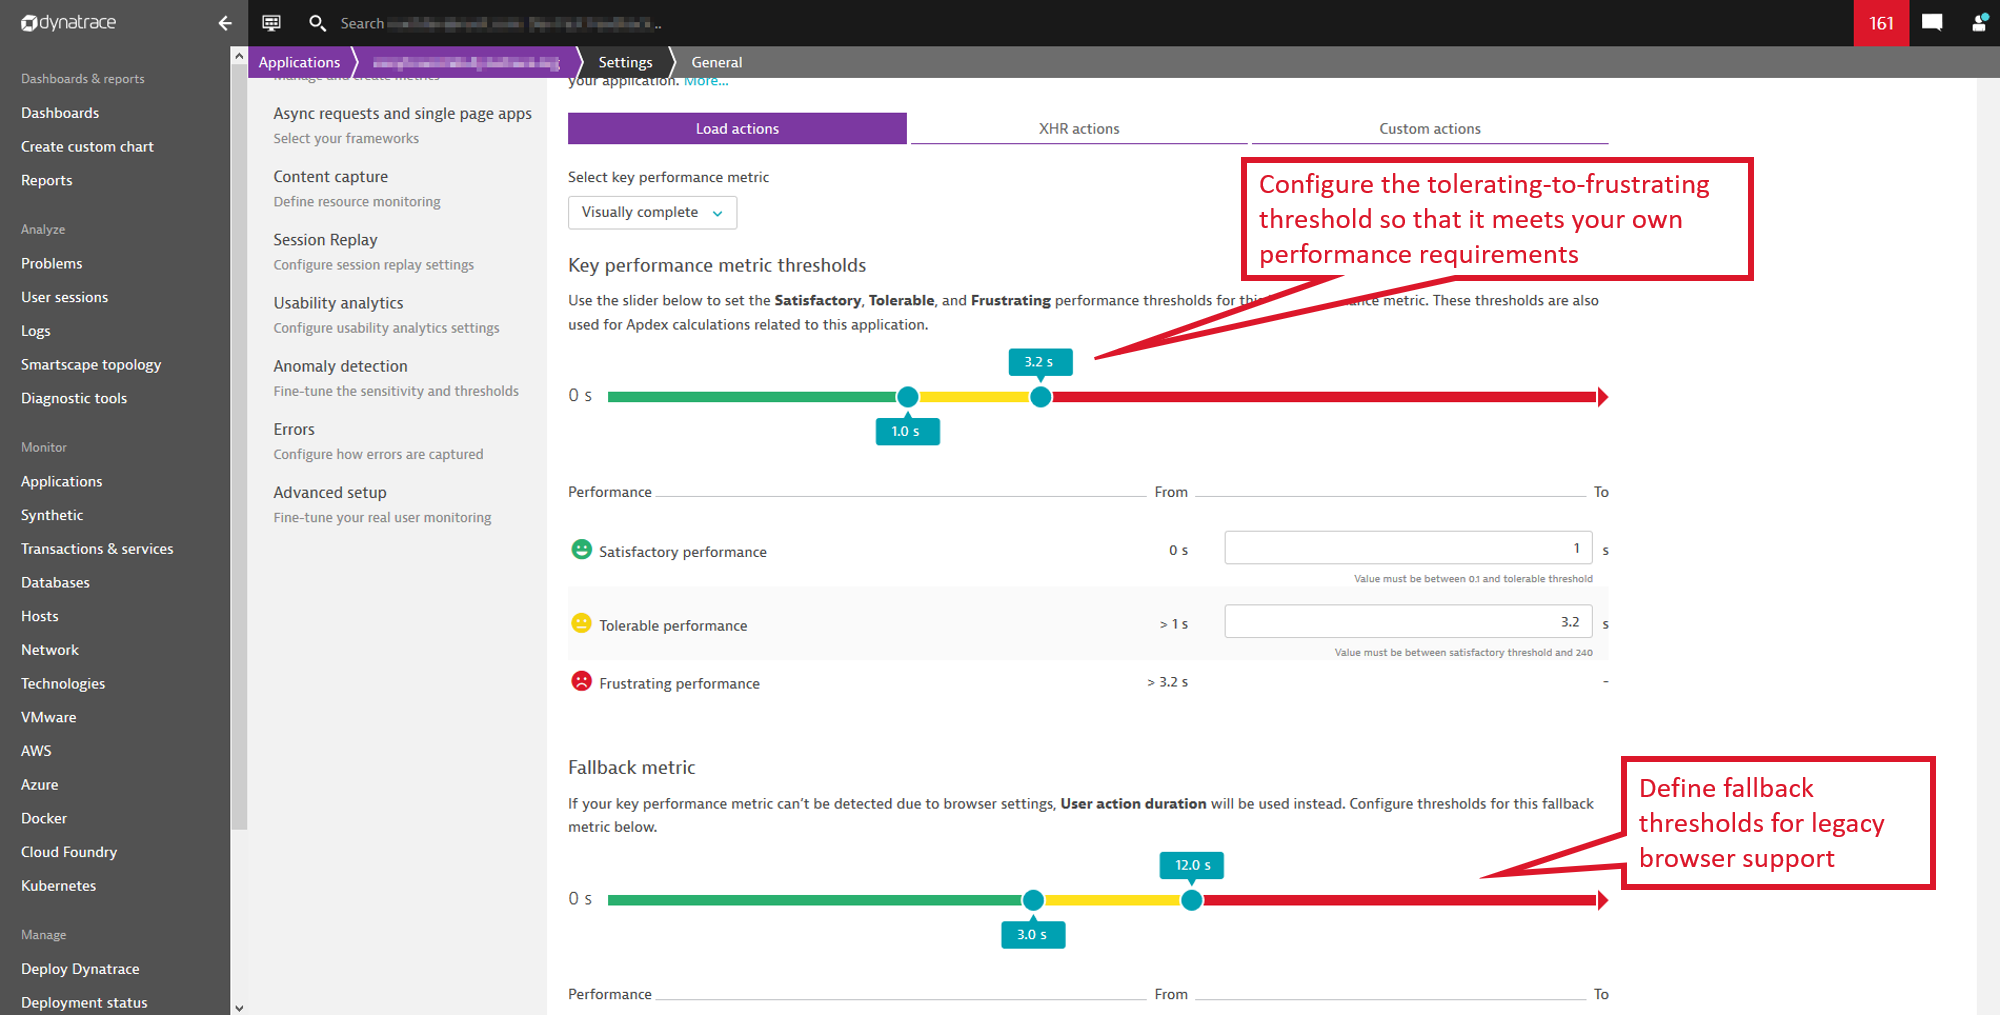
Define your own performance requirements with the more flexible Apdex
The first enhancement changes the way the threshold between tolerable and frustrating is defined—it’s no longer the fixed “4x the lower threshold” defined in the early 2000s. We’ve now made the setting configurable, meaning that you can fully customize not only the first threshold but also the second threshold, to whatever level meets your performance requirements.
Measure user experience even in legacy browsers
The second enhancement helps you manage expectations throughout your entire web application landscape, which includes not just public-facing websites but internal applications as well. A lot of websites have been optimized for Internet Explorer 7, so in many companies, Internet Explorer 11 is still the standard browser (with IE7 compatibility mode). Companies have even made the compatibility mode the default, which means that these browsers don’t provide any W3C navigation timings or support the MutationObserver API (see CanIUse.com). These capabilities are vital to seeing performance timings like Time to first byte, DOM interactive, Visually complete, Speed index, and others in your monitoring solution. However, Dynatrace can help in such mixed scenarios by allowing you to define the user action duration as a fallback metric when browsers don’t offer the required APIs. And you can define different thresholds for your primary metric as the user action duration spans the entire time from the beginning of the interaction to full load.
Easily set targets for user experience levels of your mobile apps
Dynatrace has always applied the Apdex concept to native mobile app real user monitoring. The biggest difference is that there are no standard timings defined for mobile user interactions, unlike the W3C navigation timings that are available for the web. The change we’ve made for Apdex calculation for mobile apps is that the threshold is no longer bound to the 4x-factor. The threshold is now fully flexible, and you can adjust it as needed for your business requirements.
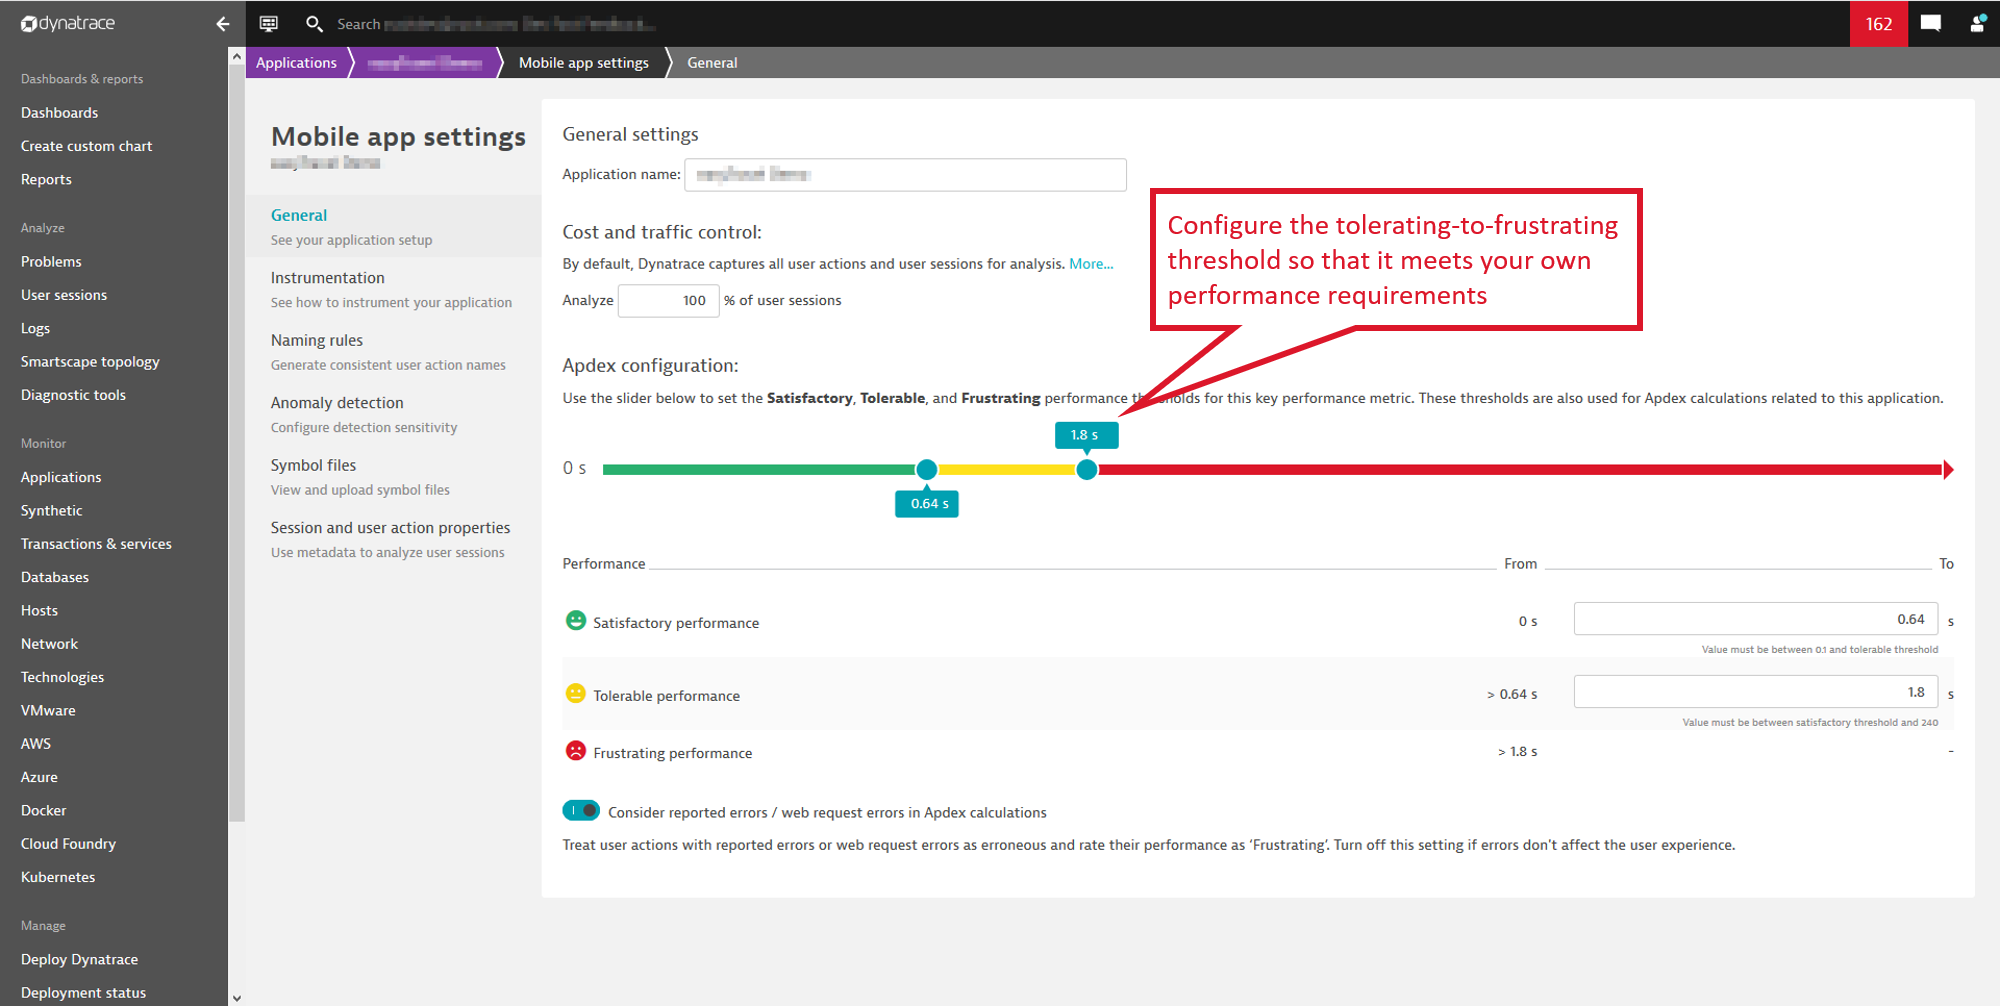
See the Apdex in different contexts in Dynatrace
Finally, here’s a quick tour through some of the places in Dynatrace where you’ll find Apdex supporting you in documenting and meeting the performance targets set for your web applications.
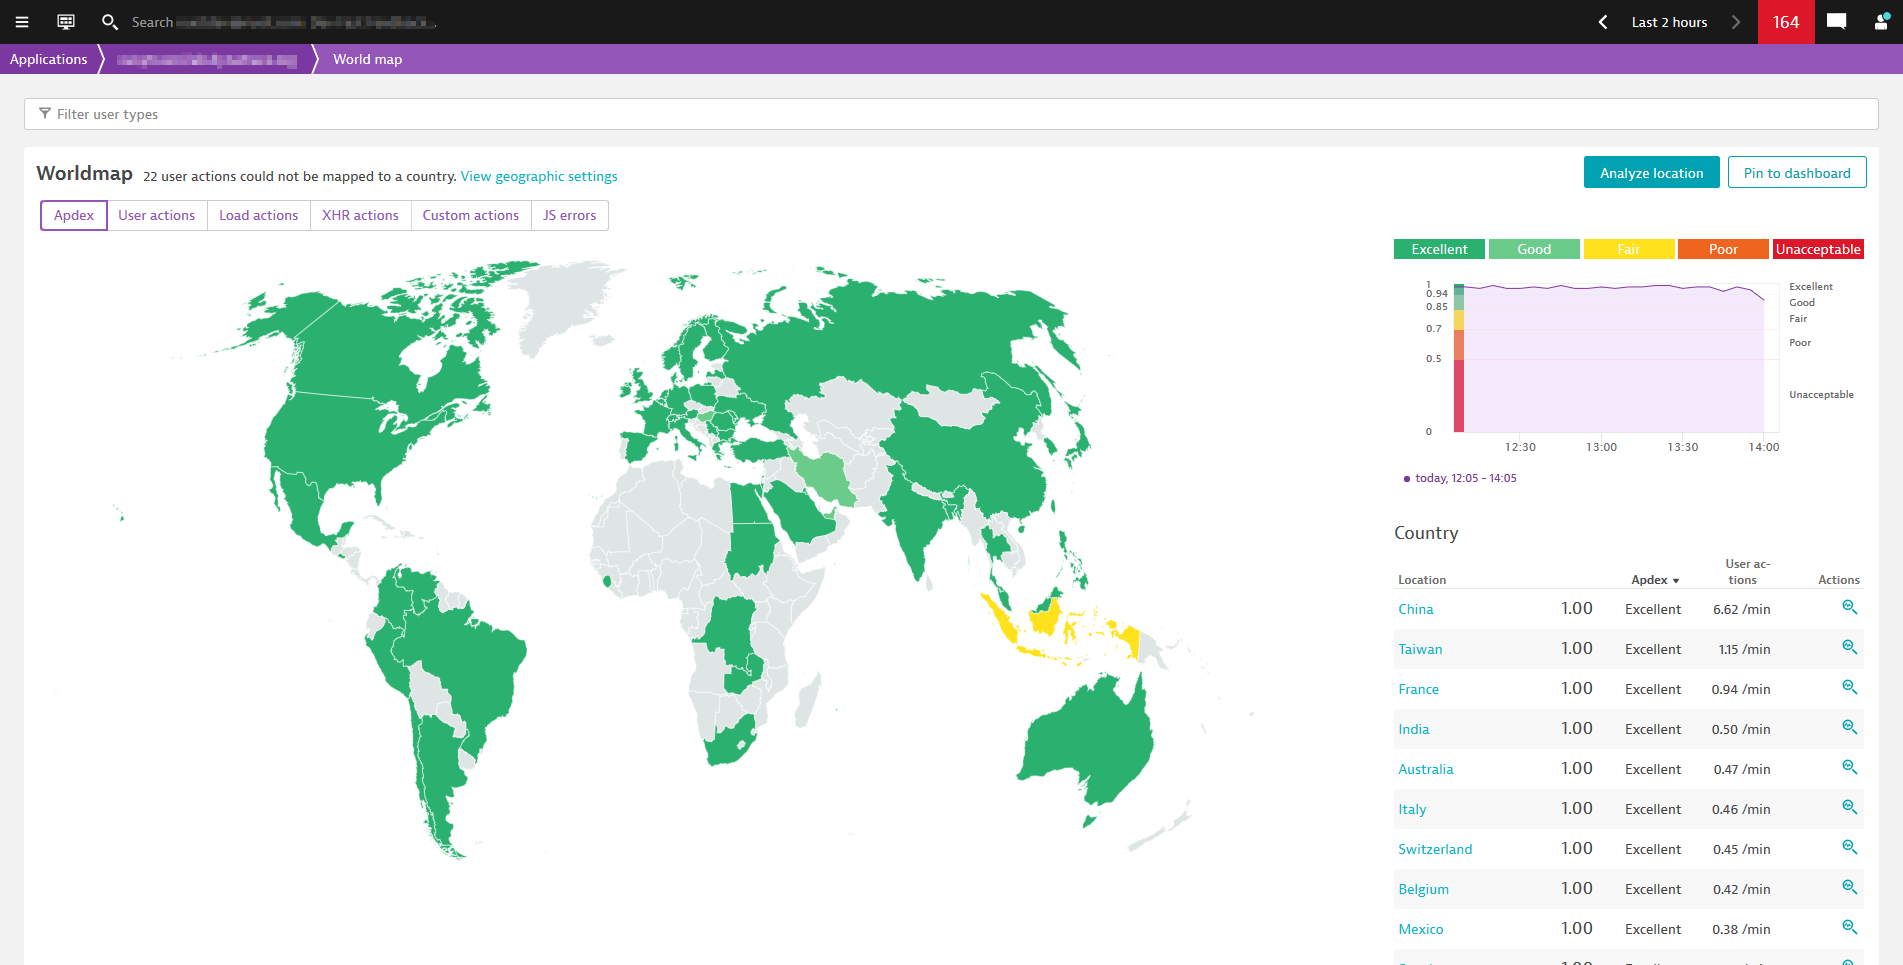
Location-based Apdex analysis
- Get a worldwide view with color-coded Apdex scores and other performance information about your end users’ experience.
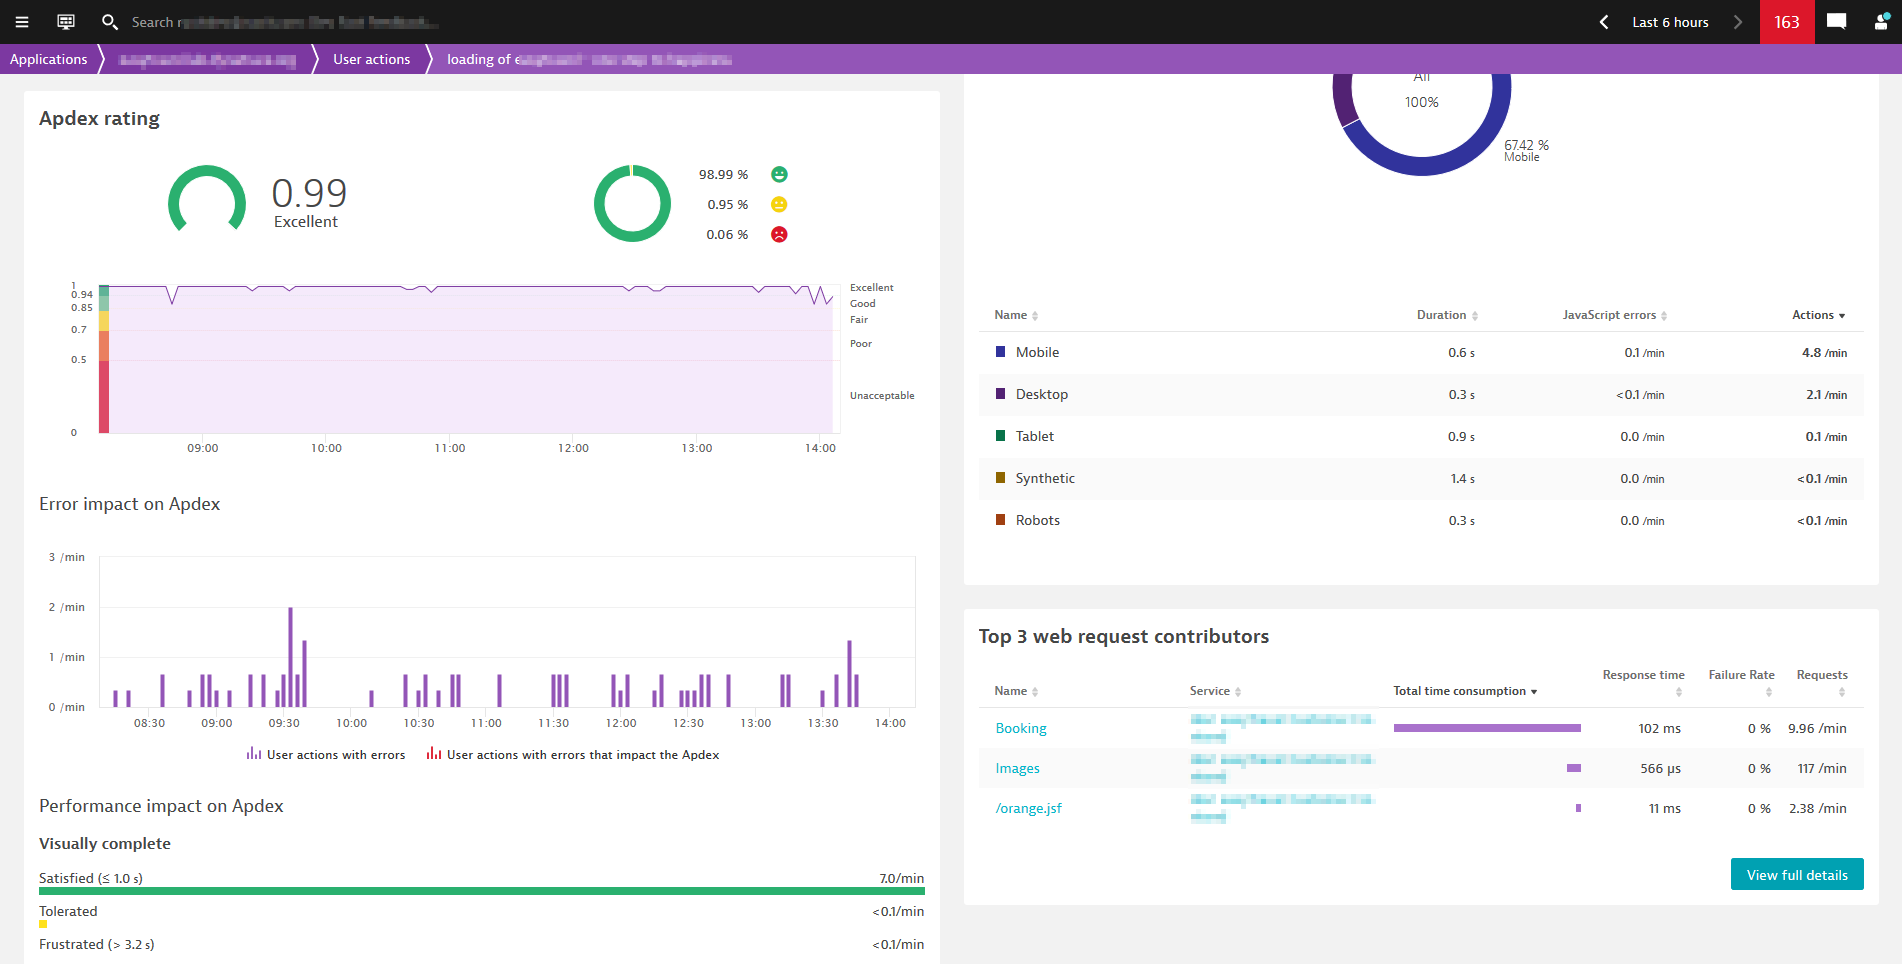
User action-based Apdex analysis
- Analyze user satisfaction within a certain timeframe for a specific user action.
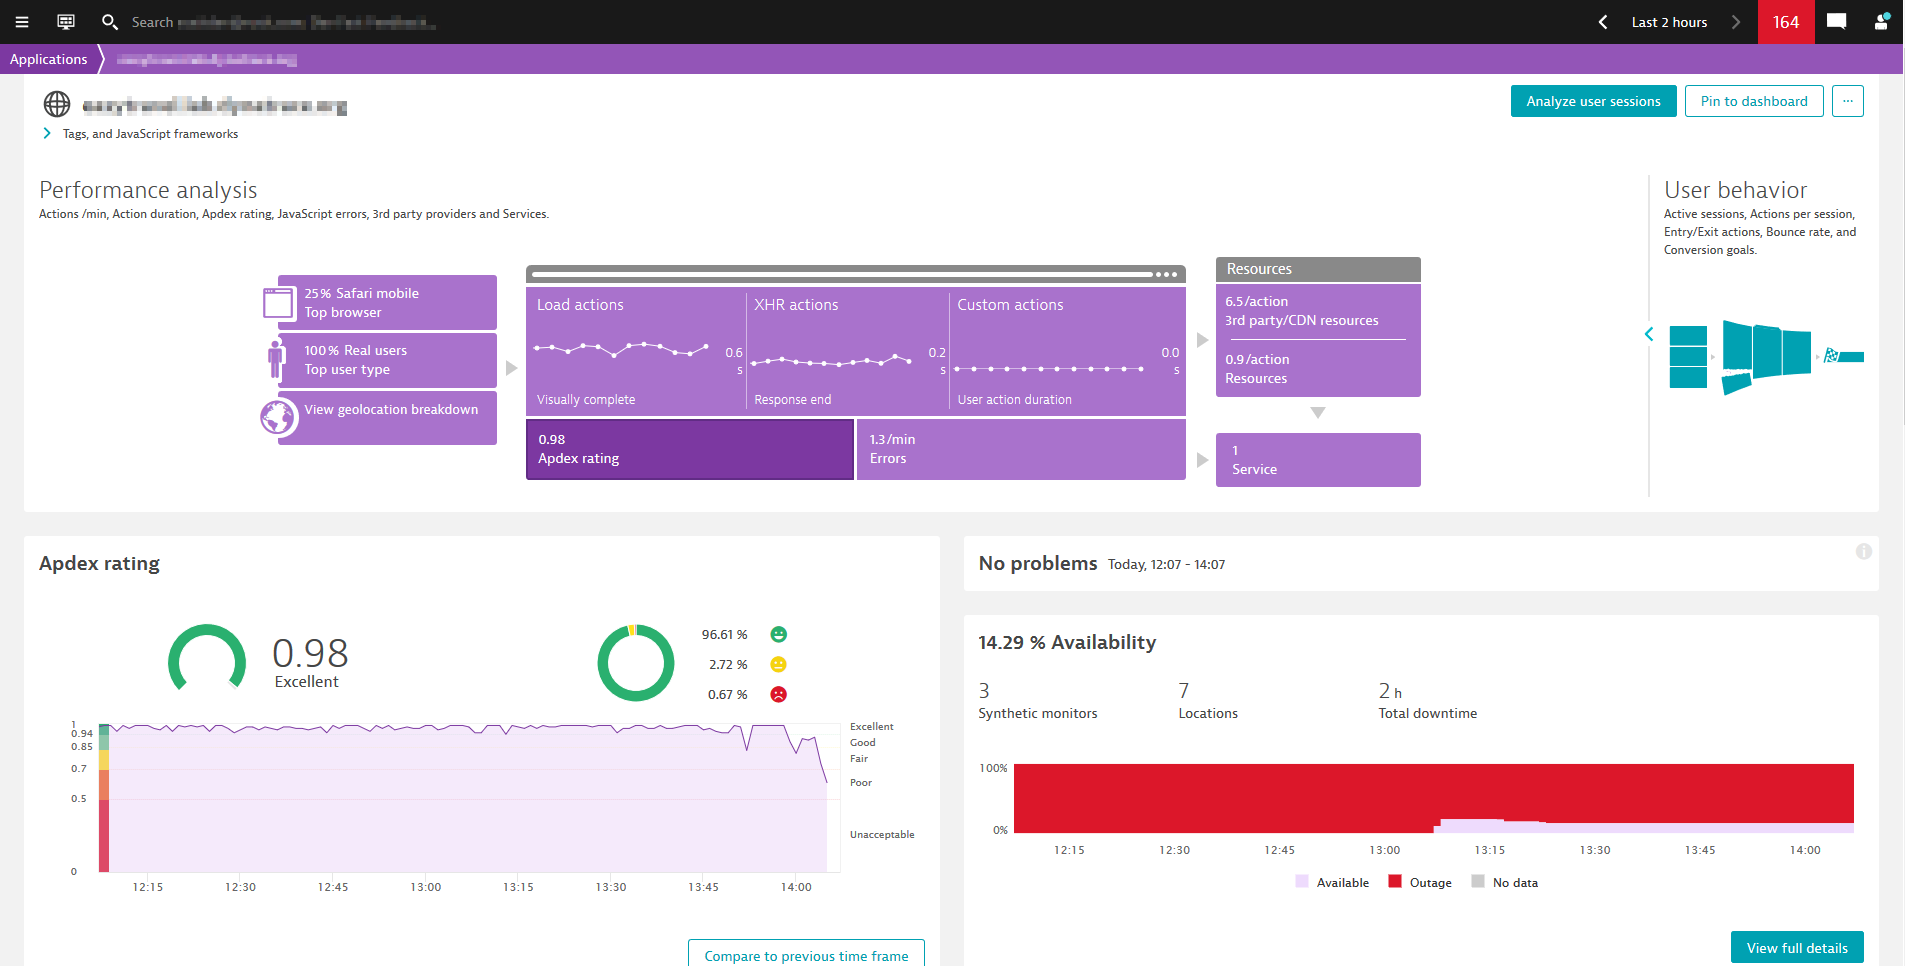
Application-based Apdex analysis
- See how user satisfaction evolves over time for a specific application during a specific timeframe.
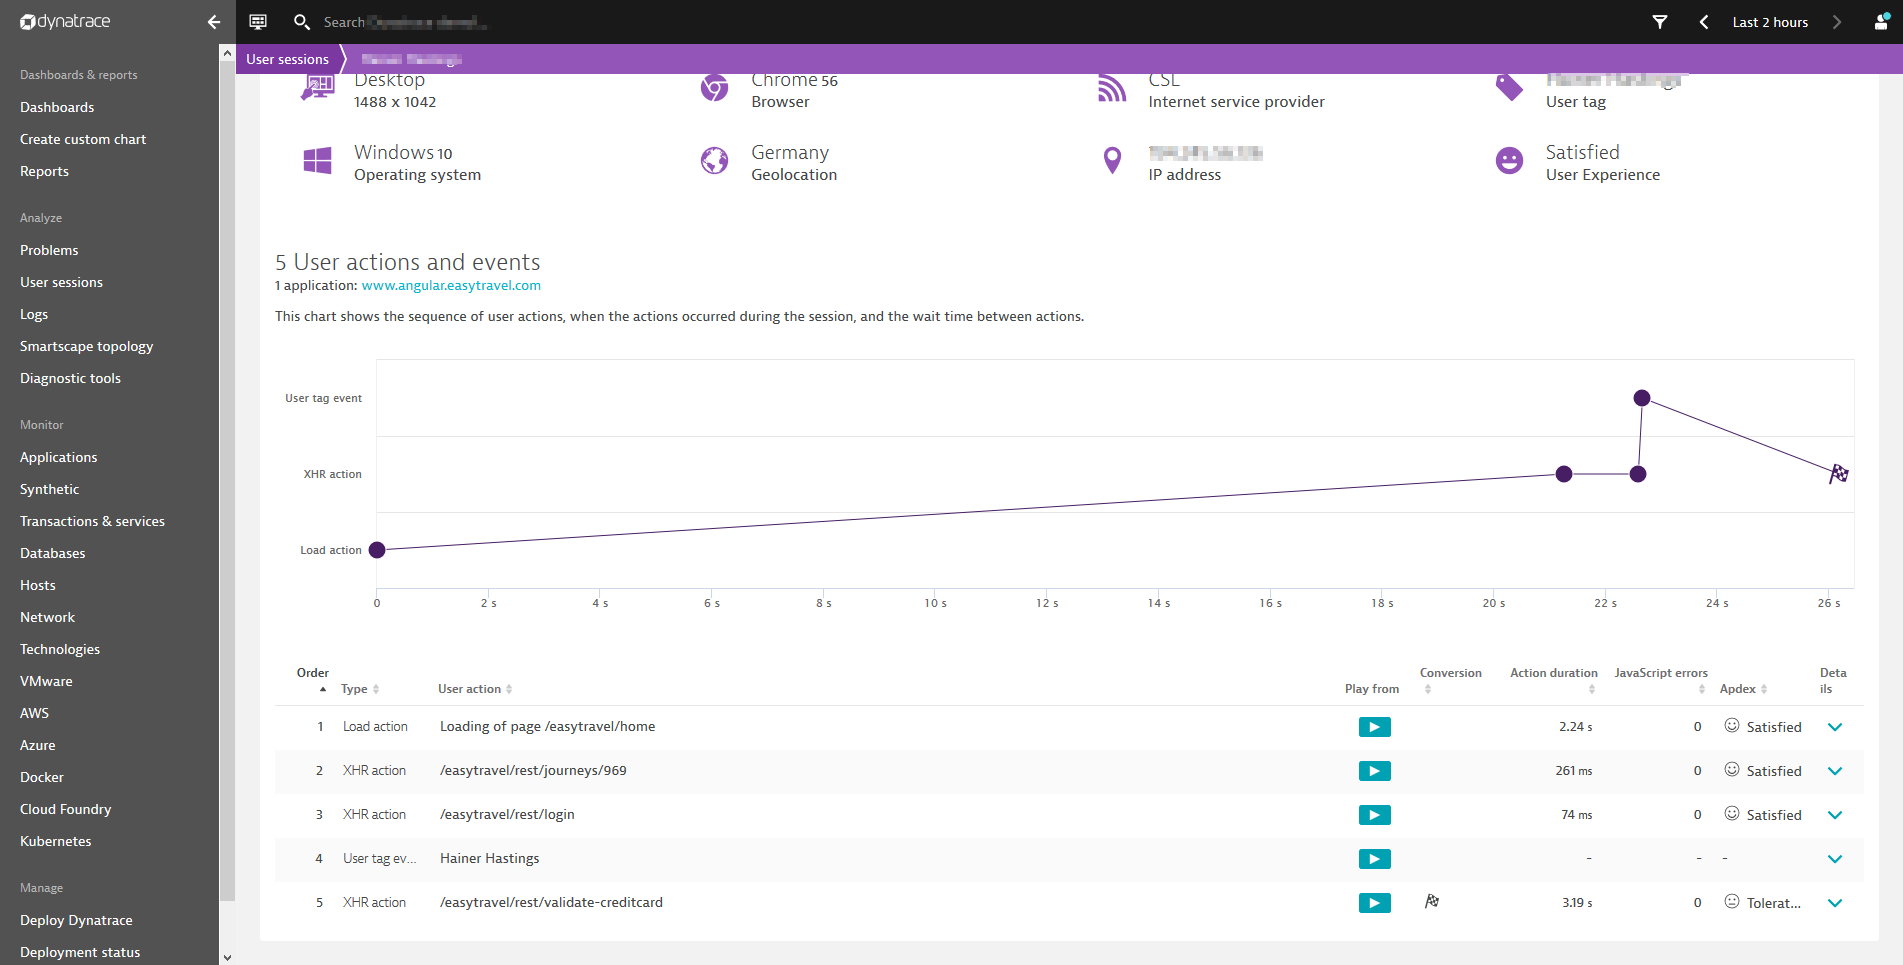
Apdex in the context of a cross-application user journey
- Check the Apdex and understand problematic steps for each user action of a user journey.
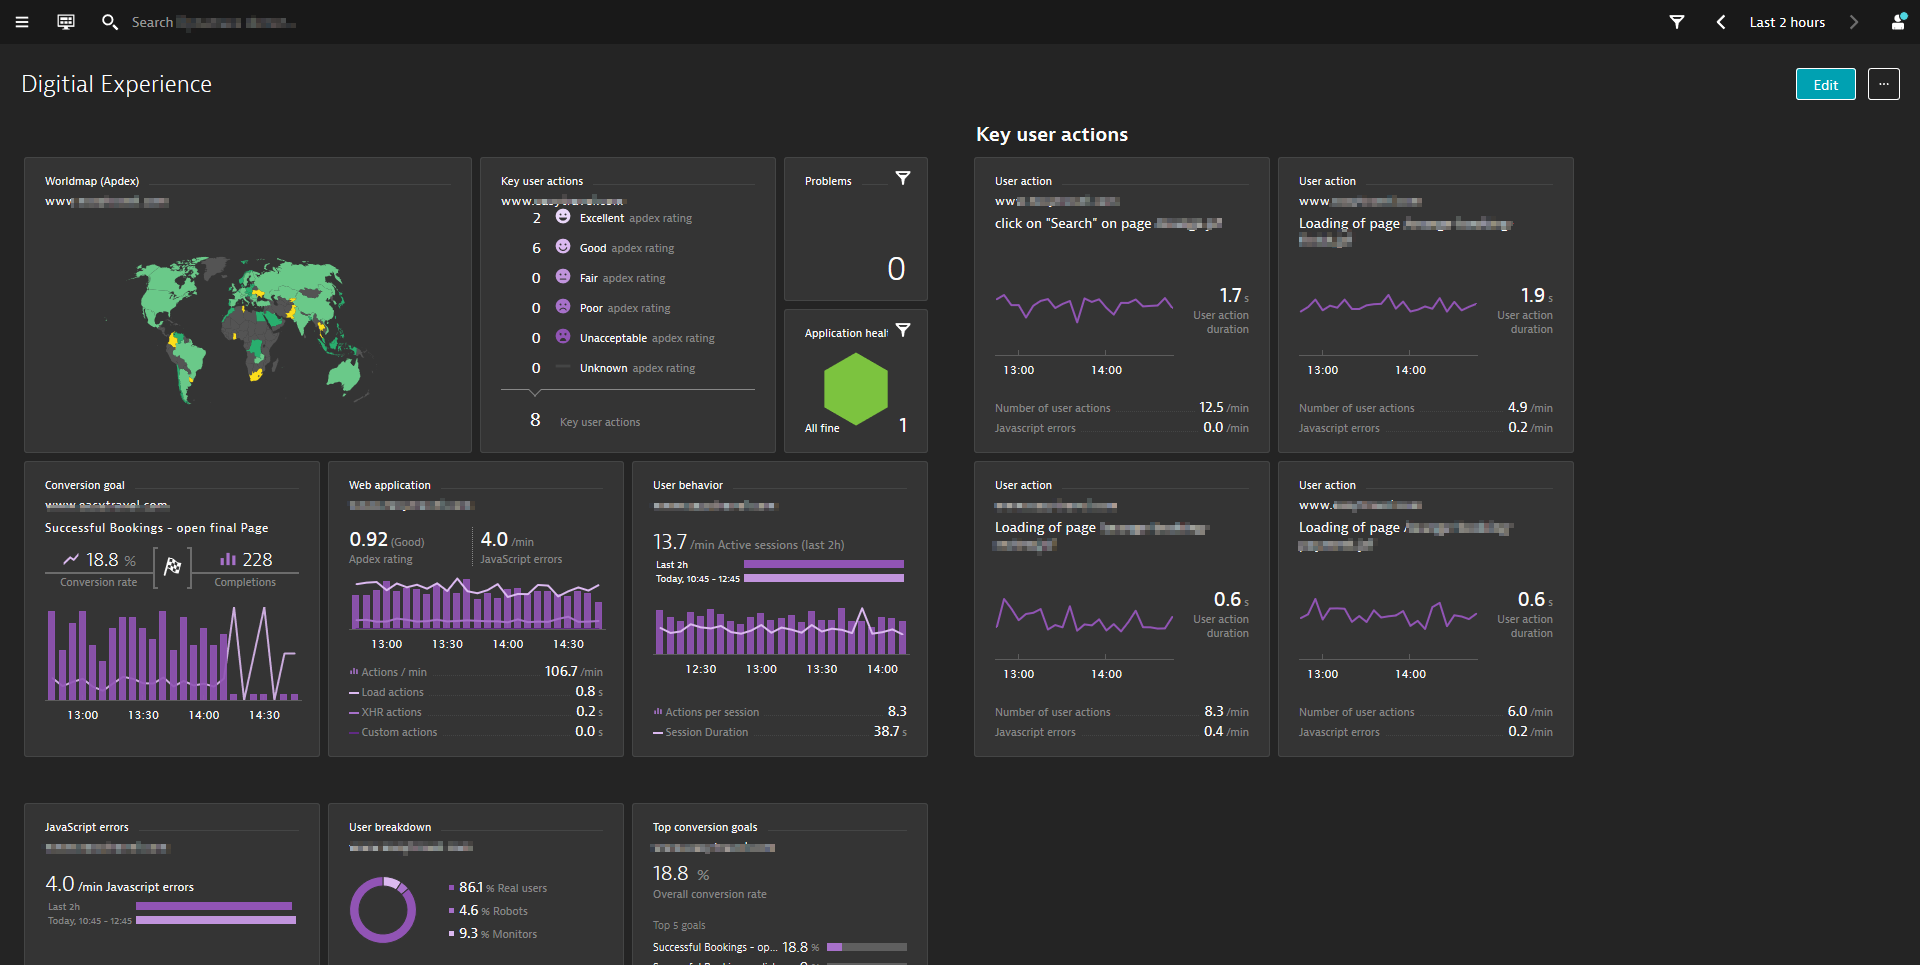
Apdex in business reporting
- Highlight the Apdex as a core metric for your business peers by adding Apdex-specific tiles to your Dynatrace dashboards. See example below.


Looking for answers?
Start a new discussion or ask for help in our Q&A forum.
Go to forum