We’re happy to announce that Dynatrace now supports the monitoring of .NET Core (CoreCLR) applications that run on Windows. For .NET Core applications, Dynatrace now provides web and database response times, CPU usage, failure analysis, and GC metrics. Dynatrace can monitor standalone .NET Core apps, ASP.NET Core apps (behind IIS or otherwise), and integrates with Azure App Service (PaaS). All this is available with a single installation of OneAgent, zero code changes, and zero configuration.
Enable .NET Core monitoring
a
Here are the high-level steps you need to get started.
- If you haven’t done so already, create a Dynatrace account.
- Download and install OneAgent for Windows.
- Within the Dynatrace UI, go to Settings > Deploy Dynatrace and click the Windows button to get started.
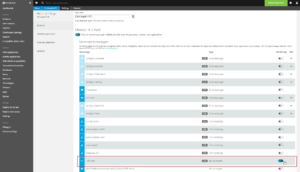
- Enable monitoring of .NET Core beta for your host.
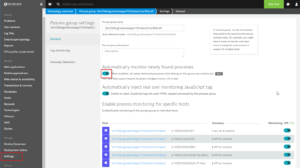
- Enable monitoring for your .NET Core process.
- Restart your .NET Core application.
Dynatrace OneAgent will immediately inject itself into the .NET Core process and begin capturing monitoring data.
What’s included
Web monitoring
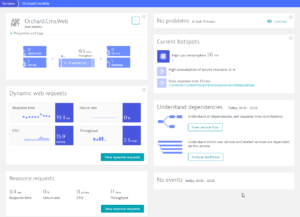
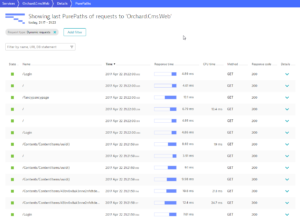
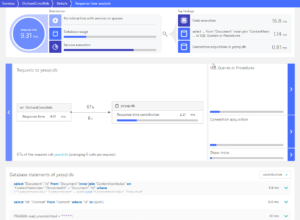
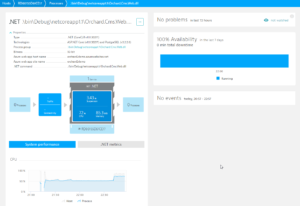
Dynatrace provides out-of-the-box support for ASP.NET Core (versions 1.0 and 1.1). For each web request, you get response times, CPU usage, and locking times. Dynatrace also detects each failed request and provides an exception stacktrace that shows you the root cause of the failure. Dynatrace monitors every single transaction, so you won’t miss any errors.
Database monitoring
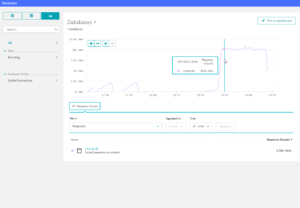
OneAgent monitors all ADO.NET-based database interactions, including Entity Framework Core. You’ll see execution times of every single SQL statement.
CPU method hotspots
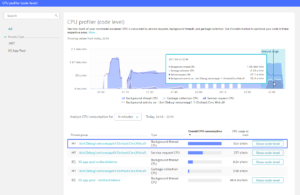
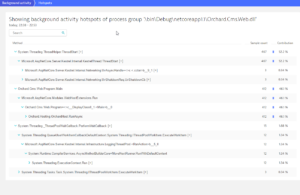
Dynatrace monitors the CPU usage of threads as they process each transaction. Additionally, OneAgent monitors background activity threads (i.e, CPU time that’s spent on threads that handle background tasks).
GC Metrics
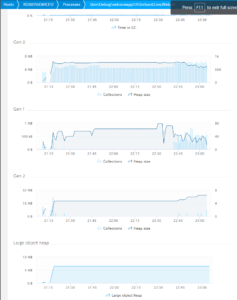
Dynatrace delivers the following GC metrics out-of-the-box:
- % Time in GC
- Gen 0/1/2 Heap Size
- Gen 0/1/2 Collection Count
- LOH Size
These metrics are named based on the .NET Memory Performance Counter metrics that are available with full CLR. However, since performance counters aren’t available in .NET Core, we’ve employed Event Tracing for Windows (ETW) to gather this information.
Custom Entrypoints
If you’re not running a web application, but rather a standalone executable (GUI application, batch process, etc), you can specify any method in your code to act as the executable’s entrypoint. To do this, go to Settings > Server-side service monitoring > Custom services, click the Create custom service button, and set up the method as a custom service.
Azure Integration
For Azure App Service, take advantage of our Azure Site Extension. For Azure VM’s, use our VM Extension.
Infrastructure monitoring
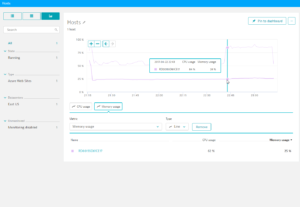
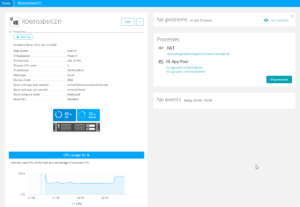
While this is independent of our .NET Core support, as soon as you install OneAgent you’ll gain visibility into your host’s CPU usage, memory usage, network usage (split by processes), and much more.
Real user monitoring
If you’re using IIS, Apache, or Nginx as a web server for your ASP.NET Core application, you can take advantage of real user monitoring. This means that you can track visits, user actions, browser rendering performance, and JavaScript errors. It’s basically like the F12 developer console, for every user. In production. With history!
FAQs
When will .NET Core support be available?
If you’re a Dynatrace SaaS customer, update your OneAgent to version 117 and you’re ready to go. If you’re a Dynatrace Managed customer, .NET Core support will be available to you with the next release (Late April 2017).
What about Linux?
Linux support is on the way, but we cannot give an ETA.
Which .NET Core versions do you support?
Currently 1.0 and 1.1.
What does beta mean?
While we always strive for the highest quality, and while .NET Core monitoring has been thoroughly tested, it needs more battle testing before it is worthy of a GA label. We don’t recommend that you use it in production just yet.
ASP.NET Core + .NET Framework 4.X is however fully supported and production ready.
Thank you, Microsoft for Open Source!
As you may know, Microsoft has open-sourced many elements of .NET Core, including CoreCLR and .NET Core Framework. This has been tremendously helpful to our team while working on Dynatrace .NET Core support. Being able to read CLR code and step through it via a debugger has made our work much easier. Additionally, Microsoft was easy to get in touch with and supported us with many helpful conversations on GitHub. We were even able to give something back to Microsoft through a few of our contributions. So, thank you Microsoft for open sourcing .NET. Keep up the good work!



Looking for answers?
Start a new discussion or ask for help in our Q&A forum.
Go to forum