Analyzing OpenTelemetry metrics is effortless with Dynatrace enhanced support for OpenTelemetry Protocol (OTLP) metric exporters. Dynatrace simplifies the acquisition and analysis of OpenTelemetry metrics emitted from cloud-native workloads by discovering contextual relationships between Kubernetes pods, services, nodes, and clusters.
The release candidate of OpenTelemetry metrics was announced earlier this year at Kubecon in Valencia, Spain. Since then, organizations have embraced OTLP as an all-in-one protocol for observability signals, including metrics, traces, and logs, which will also gain Dynatrace support in early 2023.
Realizing the promise of OpenTelemetry is a challenge for most organizations
The biggest hurdles in adopting OpenTelemetry are complexity and lack of context.
- OpenTelemetry signals are often analyzed in data silos with missing context and relationships between the data and underlying topology. This leads to significant time wasted in connecting data with application workloads by manually applying labels, or by building crosslinks between the dashboards of incompatible tools.
- Code changes are often required to refine observability data. This results in site reliability engineers nudging development teams to add resource attributes, endpoints, and tokens to their source code. Thus, measuring application performance becomes an unnecessarily frustrating coordination effort between teams.
- Choosing where and how to collect data is overwhelming. Kubernetes teams lack simple, consistent, vendor-agnostic architectures for analyzing observability signals across teams. This results in custom solutions that require throw-away work whenever a particular software solution is added or removed.
Two things are typically missing, especially within medium and large organizations: First, teams need a simple means of configuring industry-standard exporters, agents, and collectors. Second, embracing the complexity of OpenTelemetry signal collection must come with a guaranteed payoff: gaining analytical insights and causal relationships that improve business performance.
Dynatrace OTLP support reduces complexity, provides context-awareness, and unlocks Davis® insights.
OpenTelemetry SDKs are available for most contemporary programming languages, such as C++, Go, Java, JavaScript, and Python (see https://opentelemetry.io/status/ for the full list). The OpenTelemetry Operator can be used for automated instrumentation, or metrics and resources can be added using open source libraries for each language.
As of Dynatrace version 1.254, organizations using OpenTelemetry can use standard OTLP exporters to send traces and metrics to their Dynatrace environments. Combining these signals with the Dynatrace Operator enables autodiscovery of context such as pod, namespace, node, and cluster information. Dimensions like these are added automatically to OpenTelemetry metrics and traces, empowering Davis insights and root-cause problem detection.
The screenshot below shows a Dynatrace dashboard with native OpenTelemetry metrics, and a Service Level Objective emitted from a Kubernetes workload. The dashboard measures order fulfillment and shows the missed SLO, which targets 99.6% order fulfillment, as well as a drop in fulfillment. This example is a good starting point for exploratory analysis with context-aware Dynatrace Davis insights.

Apply relevant signals in context for exploratory analysis
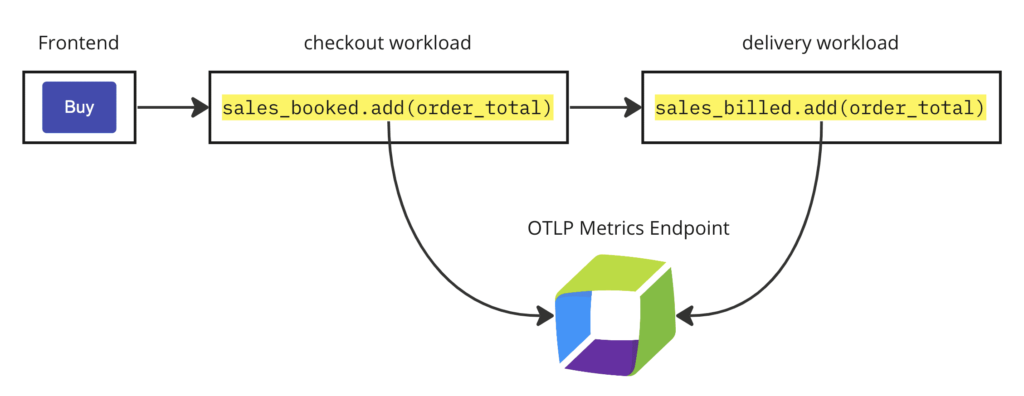
Going deeper into this example shows how Dynatrace provides an unprecedented level of exploratory analysis for both OneAgent and other data sources. The illustration below shows how the OpenTelemetry metrics for the order fulfillment counters are sent from a Python workload in Kubernetes using OTLP endpoints.
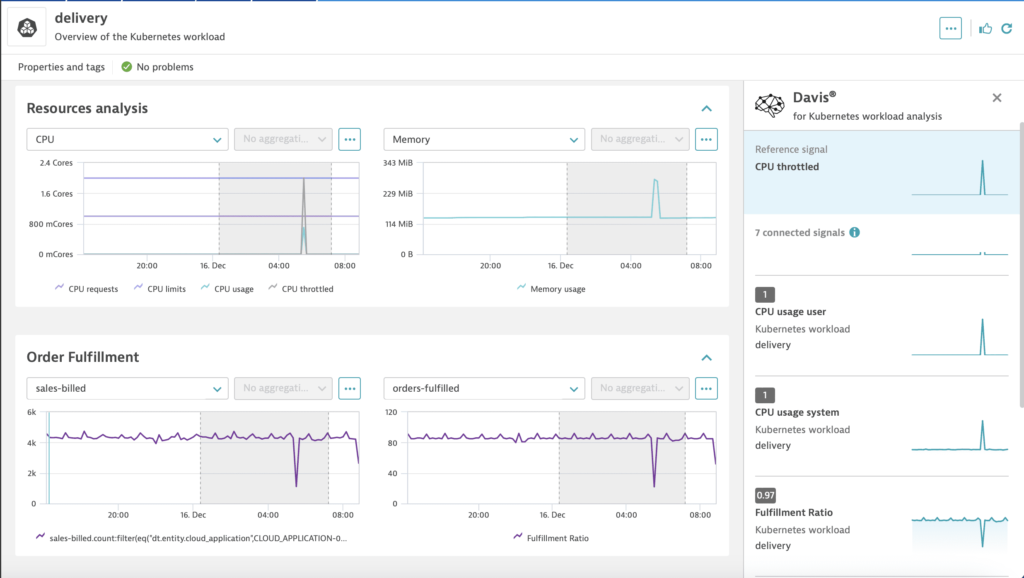
The missed SLO can be analytically explored and improved using Davis insights on an out-of-the-box Kubernetes workload overview. Kubernetes workload pages offer resource analysis, lists of services, pods, events, and logs. In addition, at the bottom of the page, OpenTelemetry order fulfillment metrics are automatically associated with the workload using the Dynatrace Smartscape® topological model.
Davis can correlate all the signals on the Kubernetes workload page including the injected OpenTelemetry metrics. By selecting Analyze on this page, Davis correlates significant CPU throttling with the drop in order fulfillment that led to the missed SLO.
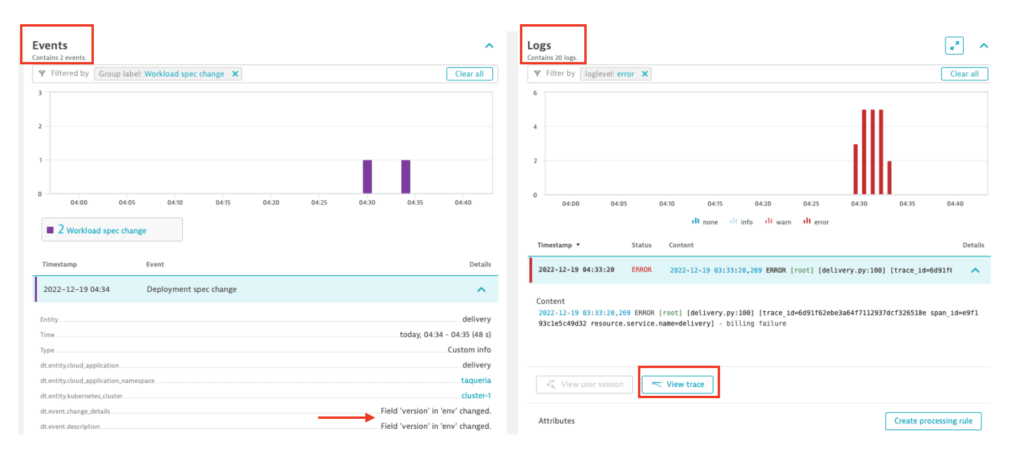
The same page provides further analysis with workload logs and events. Dynatrace detected a change event in the deployment specification at the same time CPU throttling spiked and order fulfillment dropped. An additional piece of the puzzle is available in the log viewer which shows billing failure messages on the workload, along with links to the distributed traces. Dynatrace automatically connects these traces to log lines—select View trace to take a closer look at the distributed trace.
The distributed trace produced a billing failure log line at 04:22:26 in the morning. The trace begins with the frontend workload and progresses through the delivery workload. It shows HTTP 500 errors, timeouts, and a 750x increase in response time compared to a normal span, both of which are shown side-by-side below.
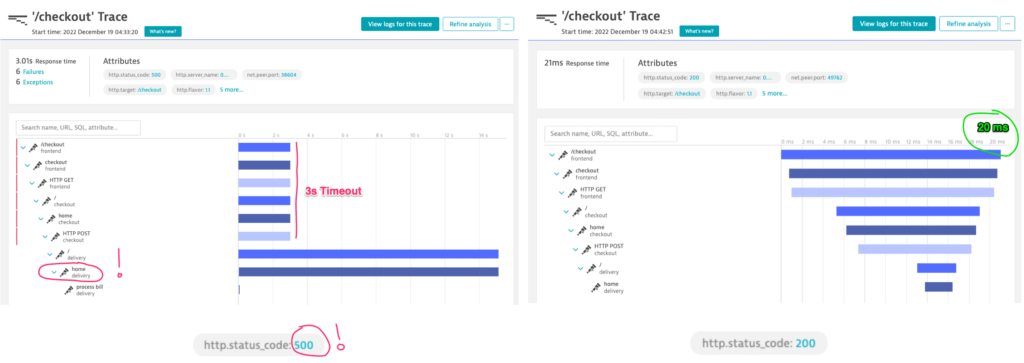
The exploration is complete. Beginning with a failed SLO, Davis established a positive correlation between Kubernetes workload CPU throttling and sales fulfillment, all triggered by a deployment event. Dynatrace distributed tracing points to a problem in a particular method, which behaved normally up until the deployment event.
The unique ability of Dynatrace to provide every observability signal in context and correlate those signals across open sources of data, such as OpenTelemetry metrics and traces, made this exploratory analysis incredibly fast and easy.
What’s ahead in 2023
Cloud-native observability, especially for OpenTelemetry, is a significant investment area for Dynatrace. OpenTelemetry logs will join traces and metrics support in 2023. Likewise, Dynatrace is also investing in the OpenTelemetry Collector as a means of collecting, transforming, and contextualizing data to bring the full power of Dynatrace Davis AI-powered automated observability to cloud-native workloads in Kubernetes. These investments contribute to our goal of OpenTelemetry signal collection at massive scale without the cost of do-it-yourself infrastructure, maintenance, and support.
If you’re interested in more information about OpenTelemetry metrics, Davis insights for exploratory analysis, and the extensibility of an out-of-the-box Kubernetes workload overview, have a look at these resources:
- Send data to Dynatrace with OpenTelemetry – Doc page.
- Dynatrace Extends its Davis AI Engine to Enable Ad Hoc, Exploratory Analytics – Press Release
- Prevent potential problems quickly and efficiently with Davis exploratory analysis – Blog post
- Extend out-of-the-box overview (unified analysis) pages – Doc page
- Example application used for this blog post, including order fulfillment chart injection (located in the
dynatracedirectory). https://github.com/mreider/taqueria
To start using Dynatrace, create your free trial account, install OneAgent on a host, or send OpenTelemetry signals, and experience the power of intelligent, context-aware AI analytics for yourself!


Looking for answers?
Start a new discussion or ask for help in our Q&A forum.
Go to forum