With the most important components becoming release candidates, Dynatrace now supports the full OpenTelemetry specification on all runtimes and automatically adds intelligence to metrics at enterprise scale. This allows for effortless rollout in large environments across thousands of instances and teams.
After the OpenTelemetry spec for traces was declared stable in February 2021, the community shifted its attention to the second observability signal: metrics. With the announcement at KubeCon Europe, most components (specification, APIs, SDKs) that create, collect, and process OpenTelemetry metrics now have the complete set of OpenTelemetry metrics functionality and are ready for use. Kudos and thanks to all fellow contributors.❤️
Developers are likely to adopt the new OpenTelemetry spec faster because it’s helpful to capture metrics that are exposed over the OpenTelemetry protocol or Prometheus, and it’s easy to instrument any web services and client applications you’ve built to migrate away from OpenCensus, much like how it was done with OpenTracing a year ago. SRE and DevOps teams, on the other hand, empower stable, secure, and frequent deployments while developers add thousands of new metrics, potentially with every sprint. So these metrics are immensely valuable to SRE and DevOps teams. You build it, you ship it.
But how can you capture, store, and analyze OpenTelemetry metrics at enterprise scale? How can you prevent alert storms? How can you explore metric, trace, and (in the near future) log signals with just a few clicks? And what should you do with data that doesn’t come from OpenTelemetry? Not to worry. Dynatrace has you covered on all these points.
Automation and intelligence for metrics at enterprise scale
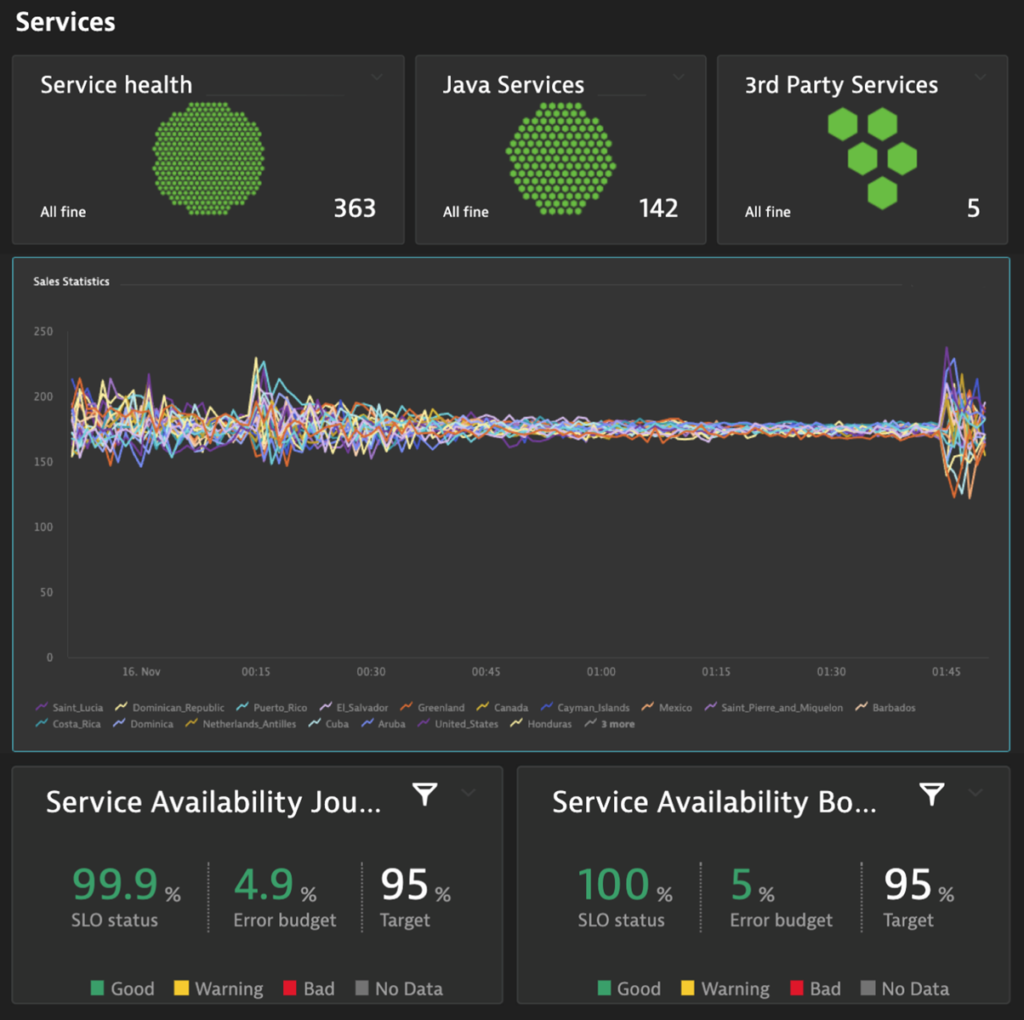
First, it’s about getting the data. You can send OpenTelemetry metrics to Dynatrace via the OpenTelemetry collector and Dynatrace Metrics API. All metrics are automatically baselined and anomalies are detected. Metrics are stored for easy analysis on dashboards, definition of service level objectives, and more.

Now, it’s about intelligent automation.
Metrics can either be sent to the Dynatrace API or, when Dynatrace OneAgent runs on a host, OpenTelemetry signals can be captured and sent automatically and securely; no endpoint or credentials need to be configured for the exporter. This allows for effortless and standardized rollouts in large enterprise environments across thousands of (virtual) machines and containers, for hundreds of teams.
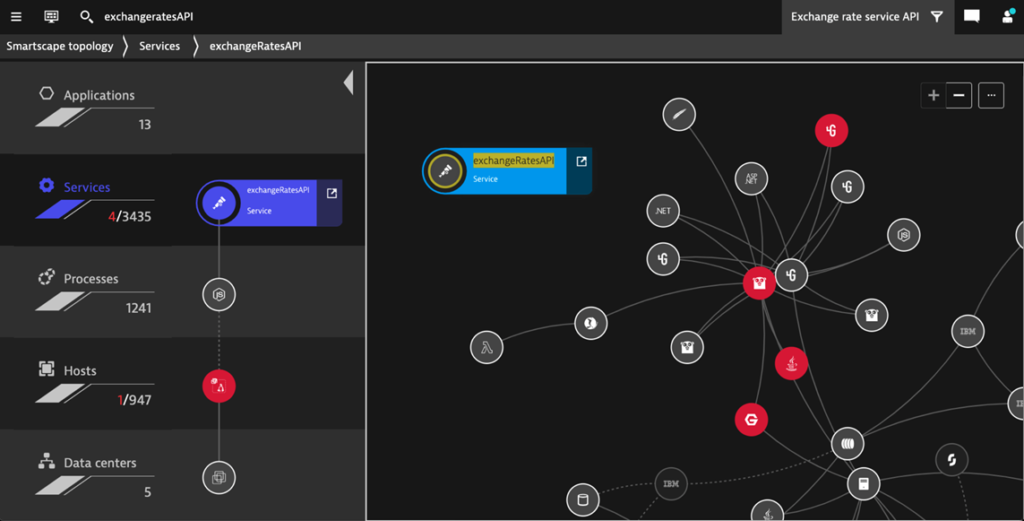
To deliver the answers that large organizations need, OpenTelemetry metrics are enriched with metadata, such as host- and process names added to the Dynatrace Smartscape® topology model. In this way, all OpenTelemetry signals are analyzed by Dynatrace Davis® AI. All dependencies are auto-detected and used for root cause analysis. Alert storms and fire drills are prevented effectively, with zero configuration.

You can do much more with metrics than pin them to your dashboards. The Dynatrace web interface combines all data sources intuitively, and invites you to explore metrics in a few clicks. You can see what’s going on without needing to understand all the inner workings and dependencies.
What’s next
As a key contributor to the OpenTelemetry project, Dynatrace will continue to work with the OpenTelemetry community, and other vendors, in improving the robustness and ease of use of OpenTelemetry metrics and its SDKs.
We’re also working on further extending our OpenTelemetry support to make it radically easier to onboard new app teams and applications to the Dynatrace Software Intelligence Platform. We’re evolving the automated analysis of all enterprise application traces, metrics, and logs in context to supercharge observability. So, stay tuned.
Get started with Dynatrace and OpenTelemetry
If you’d like to try out Dynatrace, get started with your Dynatrace free trial today.
To learn more about OpenTelemetry and Dynatrace, see our Documentation and our “How to do OpenTelemetry with Dynatrace” webinar recording.


Looking for answers?
Start a new discussion or ask for help in our Q&A forum.
Go to forum