At Dynatrace we not only sell our performance monitoring solutions to our customers – we use them in the way we want our customers to use them. The benefit of this “eat your own dog food” – or – “drink your own Champagne” (as we like to call it) is that we see first-hand if our features need to be improved to deliver what we promise.
On my last trip to our engineering lab in Linz, Austria I got pulled aside by Stefan Gusenbauer, Development Lead for Dynatrace. He said: “You always write blogs about how to integrate Dynatrace AppMon into your pipeline, and how PurePath can save the day to get fast feedback on problems discovered by automated tests. I do the same thing, but now I use Dynatrace (formerly known as Dynatrace) in our Continuous Test Environment where we execute WebDriver tests on every new Dynatrace build we deploy every 2 hours. So, we use Dynatrace on Dynatrace! Let me show you how Dynatrace helped me today identifying an architectural regression by simply looking at the data captured for our functional tests. You will love it”
He was absolutely right. I loved what he showed me! He proved that Dynatrace integrated into your Continuous Test Environment will give developers fast feedback on performance, scalability and architectural regressions. A story I have been telling with Dynatrace AppMon for years – but now also proven to work with our new Dynatrace platform.
Stefan was so kind to guide me through his steps and I took the opportunity to capture it as a video:
For those that prefer text instead of video – here’s a quick recap of the story.
Step #1: Reacting to automated Build Notification
Stefan’s project uses QuickBuild to execute the functional tests via Gradle. In case something goes wrong e.g: functional tests fail, take longer than normal, emails get sent out to the Dev Owners.
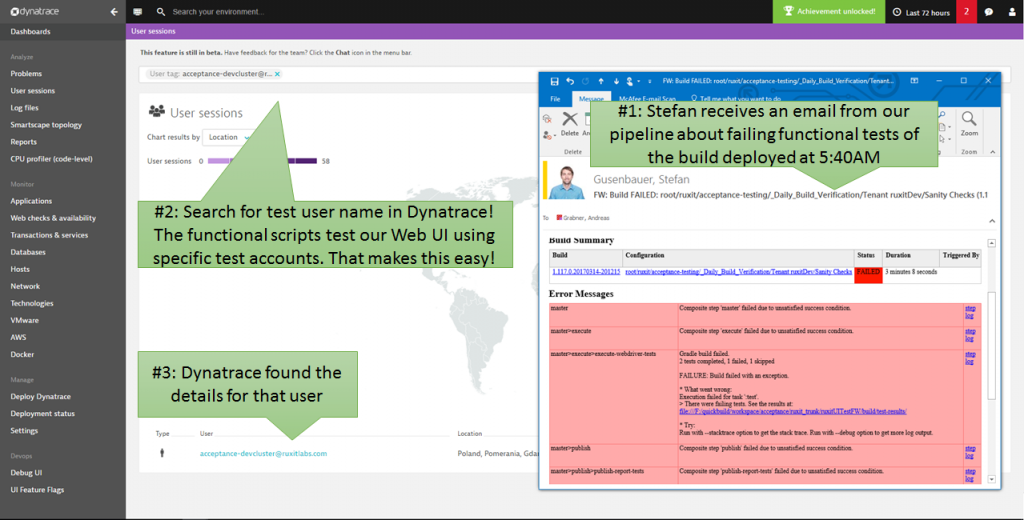
In the screenshot below you can see that email he received in the morning, notifying him that one of the functional tests has failed. The functional test results showed him that a certain action couldn’t be executed due to a previous long-running test step. This could mean many things: there was an application issue or the tests are just unstable, and something happened with the test execution. The triage for that process could be a bit tricky.
Having Dynatrace installed on that test environment makes this easy for Stefan. Why? Because Dynatrace captures every single browser session (from real our synthetic traffic) and captures meta data such as the username from the login form it is easy to look up all the browser sessions Dynatrace has captured in a certain time frame:

Step #2: Identifying the problematic test run
Dynatrace automatically groups all captured browser session data for uniquely identified visitors. In the following screenshot, we see that every hour Dynatrace captured another browser session from the automated test execution. Tests are executed out of our Gdansk, Poland lab. It’s good to have that geographical information, especially when executing tests from different locations around the world using your own or commercial cloud-based testing services. The fact that Dynatrace automatically captures all this meta data makes it easy to select what you want to analyze and validate what is happening.
Having this chronological overview makes it easy to spot and select the problematic test in question. It’s the one at 5:48 a.m.:

Step #3: Identifying the problematic test step
A click on that session from test run at 5:48 a.m. brings us to the overview of what this browser did. The timeline view displays what happened in that browser session, and where the longest running session was that caused the test script to abort. The page took 28s to load which exceeded the timeout setting of the functional test script. The proof that Dynatrace delivers is that the problem is an issue on server-side processing!

Step #4: Analyzing the Waterfall
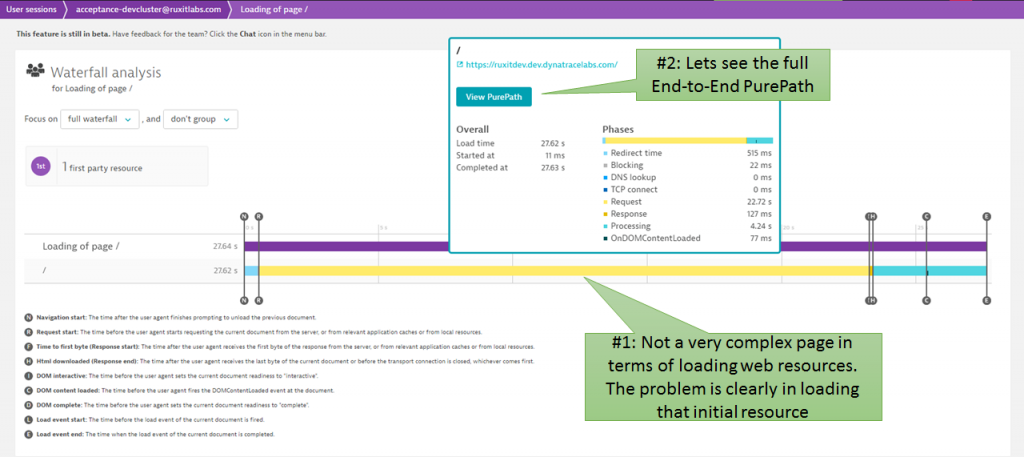
When a page loads slow many things can be causing the problem. It could be an issue with slow-loading resources (images, CSS, JavaScript) or slow executing JavaScript code on the browser. In our case, here the loaded page was rather simply from a waterfall analysis perspective. It is a single page app and that action tries to load the initial HTML. That request is the actual hotspot as we can see:

Step #5: Server-Side Hotspots
The new Dynatrace PurePath view not only shows you code level details but more importantly highlights the top findings. Much wait time and code execution — which looks very suspicious already – may be some asynchronous access that is synced through wait? Let’s see:

Step #6: Root Cause Detected
Drilling through the actual PurePath data showed that doFilter was accessing the underlying persistence layer through several asynchronous calls, which later had to wait on each other, leading to the high wait and code execution time. With that information, Stefan immediately knew that this was not only the problem for the failing test, but that this is an actual architectural regression. These calls should have never been made for that particular action that was tested by the script:

The power of Continuous Testing and Monitoring
Continuous Testing makes it possible to detect regressions in combination with Monitoring ,and an approach that automatically captures and tags these test executions correctly make the triage process for problems easier. This leads to faster feedback not only on functional regressions but also performance, scalability and architectural regressions.
Thanks again to Stefan for sharing this story. We’ll keep using our own products, and innovating by automating these feedback loops from which we all benefit!
If you want to test Dynatrace on your own get your SaaS Trial by signing up here.


Looking for answers?
Start a new discussion or ask for help in our Q&A forum.
Go to forum