Dynatrace Managed release notes version 1.178
New features and enhancements
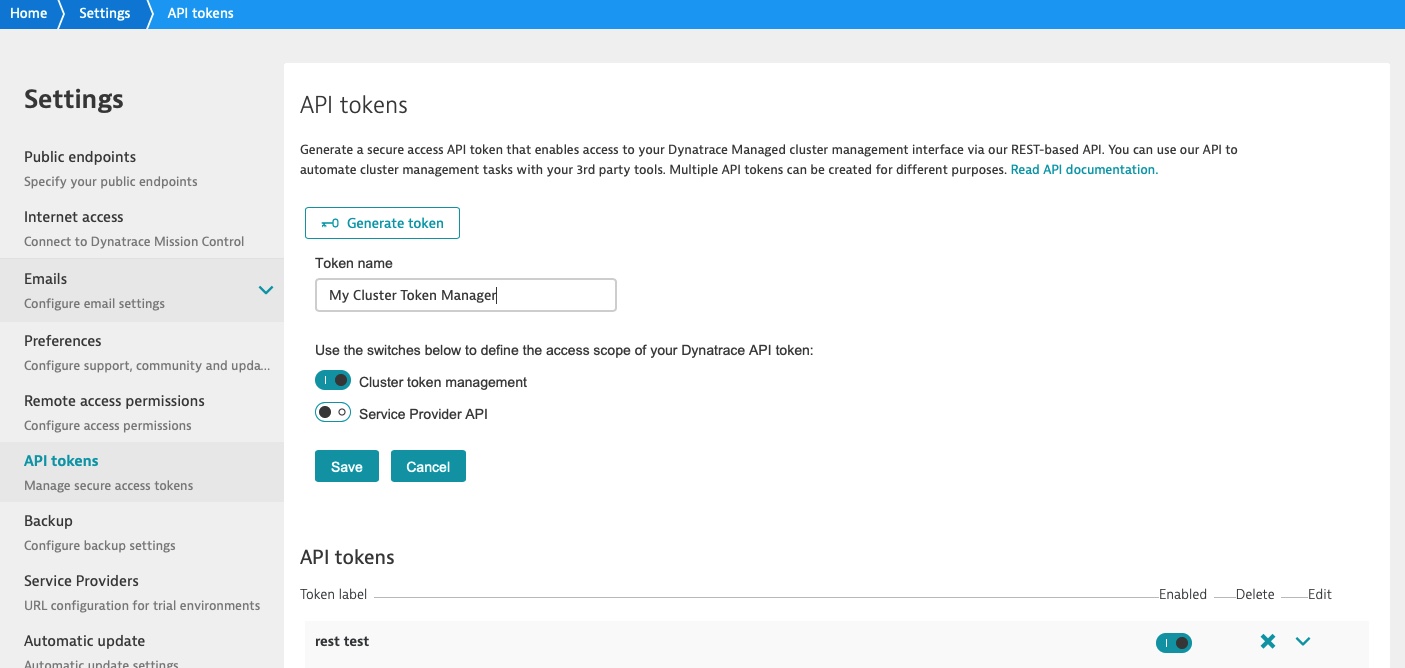
Improve the security of your tokens with automated token rotation
Regularly changing your password is a good security practice. Same goes for Dynatrace cluster REST API authentication tokens. Our new cluster-scoped token helps administrators who need to rotate tokens automatically. Until now, the process was cumbersome or even not possible at all. It was required to manually create a token every time and store it in a secure place (for example, Secret Server or a CI/CD service). Moreover, not all tokens were manageable. By providing automation via Dynatrace Cluster API, it's possible to get and control all cluster-context tokens.
To get started, you need to log into the Cluster Management Console and navigate to API tokens in settings. You'll see an extended view and form where you can create different scopes for tokens. The new token scope is called Cluster token management.
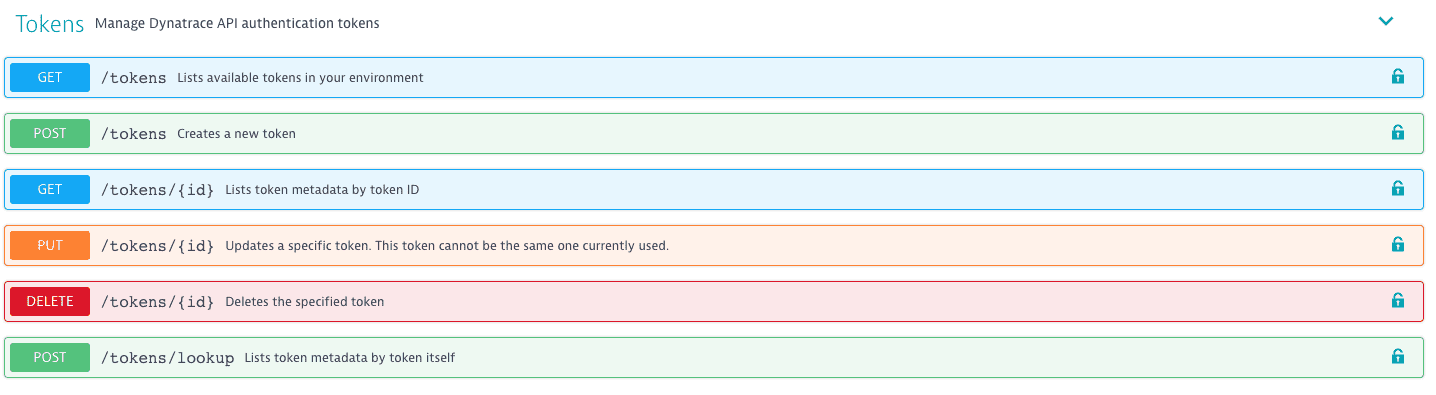
To get the interface details, use the Dynatrace API Explorer, which is available from the user menu under Cluster Management API. Select the Cluster API definition.
Improved cluster resilience for high user traffic volume
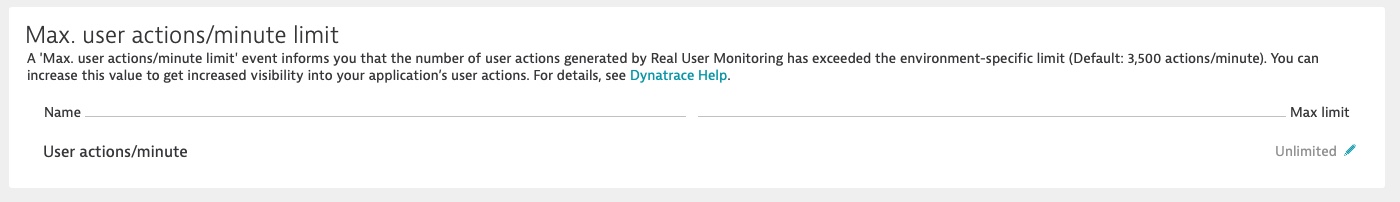
Since the introduction of Adaptive load reduction with Dynatrace traffic management in version 1.156 we ensure that Dynatrace scales in high-traffic environments and that your network bandwidth is used efficiently. Now we're introducing a similar safeguard concept for high-traffic RUM environments by enforcing a maximum user action count per-minute limit for Dynatrace Managed. The maximum user action count per minute limit, which is specific to your environment, is there to prevent unexpected high consumption of your license volume by unforeseen IT events like unannounced marketing campaigns, unplanned load tests, DDoS attacks, aggressive web scanners, or other. Take a look below to see what the new tile on the Environment settings page looks like and to read the details in RUM: What does a 'Max. user actions per minute exceeded' message mean? in the Dynatrace Community.
Set default timeframe and management zone filters for dashboards
To date, dashboards persisted the currently selected timeframe and management zone filter. As this became a source of confusion, we've now made this an explicit configuration step and added a Settings section for dashboards. These settings provide you with control over a dashboard's Default filters.
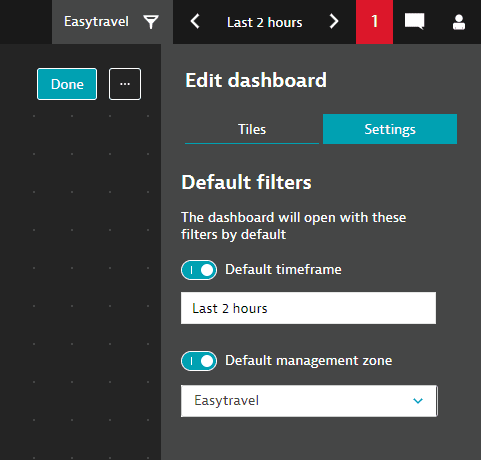
Initially, dashboards don't have any default filters applied. Default dashboards open with the user's currently selected timeframe and management zone setting. To configure a default timeframe and management zone for a dashboard, turn on the relevant toggles and configure your desired settings.
Rate switcher for metrics
The representation of selected metrics during a select timeframe can be switched from totals to a fixed rate (per second, per minute or per hour). See Create custom charts for details.
Other changes
- Restored cluster has backup configuration disabled to prevent overwriting of data. Once the new cluster is running well, backup must be re-enabled manually.
- Out-of-the box coherent configuration of OS user
uidand OS groupgidrunning Dynatrace services across cluster nodes. - New
/adminresource was published to enable login to Dynatrace Managed in SSO-only authentication mode. - Security vulnerability fixes and bug fixes are delivered with the update of JRE to version 8u222.
- We now support up to 15 nodes per cluster to further extend linear scale for webscale deployments of Dynatrace.
Resolved issues
Dynatrace Managed General Availability (Build .178)
The Dynatrace Managed .178 GA release contains 12 resolved issues.
ON-PREM
- Installation file propagation bug was fixed: corrupted signature files can now be overwritten by correct ones during next download attempts. (APM-191613)
- Warning is displayed if Managed is not able to calculate free space. (APM-192250)
- "Too many failed login attempts for this username (...)" message will now not appear if a lot of time passed between attempts. (APM-194304)
- Outdated information about scheduled automatic upgrade still visible. (APM-194444)
- Node tile should be red if OneAgent traffic is disabled and a node is malfunctioning. (APM-196097)
- Environment name restriction was lifted in Web UI - alphabets other than Latin are now supported. (APM-196228)
- 'New Managed Update Available' email is sending repeatedly when there is a problem with installer distribution among cluster's nodes. (APM-196258)
Cluster
- License consumption was not updated after conversion from offline license to full online license. (APM-195155)
ON-PREM Console
- External sites like Dynatrace Documentation or Dynatrace RSS feed may sometimes not be available. (APM-190775)
- Synthetic monitor could not be created for websites that require User-Agent header. (APM-194959)
Installer and Upgrade
- Fix for "Upgrade now" button not available even if upgrade is ready to start. (APM-193841)
- Fix for potential failure of cluster upgrade in progress when new version is published. (APM-196520)
Dynatrace SaaS General Availability (Build .177)
The Dynatrace SaaS .177 GA release contains 20 resolved issues.
RUM
- Fix an issue with displaying the mobile top actions list. (APM-195067)
- Fixed validation of Android symbol files containing empty lines. (APM-194319)
Session Replay
- Session Replay enabling switch toggle does not accurately show the current state. (APM-191706)
- Error message stopped showing when replaying on a cluster without a proper SSL certificate in place. (APM-194897)
Synthetic
- No data reported for HTTP monitors by windows Active Gate. (APM-202638)
- For multi-node clusters, in some cases, cluster AG was not reporting any results for HTTP monitors. (APM-207871)
Cluster
- In some cases user was not able to save private location configuration. (APM-194119)
- DT configuration API fix - empty configuration for few minutes after new tenant creation. (APM-190506)
- DataCenter services screen - link to host may become unavailable. (APM-193762)
- Improvements to NAM integration metric display. (APM-193754)
- AWS availability zone screen fix - affected ec2s might have not been marked red. (APM-195003)
- REST API for USQL queries can fail for specific queries if parameter explain is set to false. (APM-194981)
- Fixed an issue where entities older than 72h were not displayed in the tagging-view although having the tag. (APM-194556)
- Fixed incorrectly scaled Custom Chart metrics of Azure Redis Cache. (APM-186272)
- Mobile Correlation: improved linking of web requests to service calls processed in different thread. (APM-193718)
- Mobile App: fixed no more closed problems visible in mobile app when AI 2 was used. (APM-192856)
- Fix caching issue of Kubernetes limit configuration. (APM-194269)
- IBM ZLinux (early adopter) agents were not selectable for download in the UI due to inconsistent internal installer type naming. This was hotfixed and verified to be available. (APM-194172)
Core UI
- Empty notifications are displayed in some cases. (APM-190797)
- 403 forbidden error possible when creating an integration token and having multiple management zones. (APM-192482)
Dynatrace SaaS General Availability (Build .178)
The Dynatrace SaaS .178 GA release contains 23 resolved issues.
Cluster
- Improved filtering for Log Tree when filtering for host name or host tag. (APM-191497)
- Showing teaser if NFS is missing for Managed Customers. (APM-194107)
- Changes on PaaS host details - introducing new tab with on memory details and presenting both physical and container memory usage. (APM-193472)
- Host anomaly detection settings - fixed problem with clicking on a navigation breadcrumbs in managed environment. (APM-198268)
- Technology overview and Process group screens - fix temporary problem with displaying range (min and max) series on charts. (APM-199133)
- Fixed an issue where the change of network-speed of NICs was not handled correctly. (APM-196879)
- Mobile App: fixed no more closed problems visible in mobile app when AI 2 was used. (APM-192856)
- Mobile Symbolication: added symbolication of Last Exception Backtrace frames. (APM-196765)
- API Explorer sporadically showed a TypeError under certain circumstances. This was fixed. (APM-196613)
Agent & SG
- Network overview screen - filtering for tags that contained '=' chart is fixed. (APM-196101)
Code-Level
- Chart zooming with Shift + Mouse scroll on service details screen fixed. (APM-195941)
- Show correct number of mutli-value request attributes in PurePath view when the user can only see the masked value. (APM-195980)
- Better position and avoid unintentionally closing the service drilldown overlay. (APM-196065)
- Show all request groups for databases ("Default requests" was shown twice while other groups were not shown). (APM-196210)
RUM
- Fixed naming of session count metrics for mobile apps. (APM-195395)
- Fixed url decoding in provider breakdown table. (APM-196125)
Session Replay
- When determining the safety of enabling Session Replay detection of ASP apps raises false positives. (APM-194090)
- Player stops showing mouse clicks ripple animation after skipping in the timeline. (APM-196138)
Core UI
- Dynatrace achievements not marked as completed in some rare cases. (APM-194461)
- Broken ctrl/cmd+click on breadcrumb items. (APM-195111)
- Breadcrumbs do not work on session replay screen when having special characters in the session id. (APM-195640)
- Endless loading data on a host dashboard with a problem context. (APM-196165)
- Generate API token button reappears unnecessarily. (APM-196567)