
Psst… We have a secret to share: Dynatrace loves OpenTelemetry! And why shouldn’t we?
OpenTelemetry (OTel) is an open source framework for generating, ingesting, transforming, and exporting telemetry data. Backed by most of the industry’s major observability vendors, OpenTelemetry has become one of the CNCF’s most active open source projects, second only to Kubernetes. In fact, Dynatrace is proud to be one of the leading contributors of OpenTelemetry since the project’s inception.
How Dynatrace supports OpenTelemetry
Dynatrace is an active member of the OpenTelemetry community. Dynatracers hold key leadership roles as project maintainers or approvers in the following groups:
- OpenTelemetry Technical Committee
- OpenTelemetry Specification (Metrics, Semantic Conventions)
- OpenTelemetry for JavaScript
- OpenTelemetry Collector
- OpenTelemetry Demo project
- OpenTelemetry End User SIG
In fact, Dynatrace has a team dedicated to contributing to OpenTelemetry and ensuring that the Dynatrace platform integrates smoothly with OpenTelemetry data.
Dynatrace and OpenTelemery data ingest
Here are some fun facts about Dynatrace ingestion of OpenTelemetry data:
- Dynatrace accepts data in the native OpenTelemetry Protocol (OTLP) format via HTTP
- Dynatrace supports OpenTelemetry traces, logs, and metrics
- Dynatrace supports all languages supported by OpenTelemetry
- To send OTel data to Dynatrace, you can either use the opentelemetry-collector-contrib distribution, build your own collector distribution, or use the Dynatrace OpenTelemetry Collector distribution.
- Learn more about configuring the collector of your choice to send data to Dynatrace, and check out our Dynatrace OpenTelemetry Collector use cases.
Send OpenTelemetry data to Dynatrace
To send OpenTelemetry data to Dynatrace, you need:
- A Dynatrace account
- A Dynatrace OTLP endpoint
- A Dynatrace API token
- An OpenTelemetry-instrumented application
Learn more about sending OpenTelemetry data to Dynatrace.
Explore OpenTelemetry data with Dynatrace
Dynatrace makes unified observability possible by storing all data in Grail™, a unified and purpose-built data lakehouse optimized for storing and analyzing traces, metrics, logs, and more.
Once your data is ingested into Dynatrace, you can use the platform to ask meaningful questions, get useful answers, and act effectively on what you learn. For example, you can:
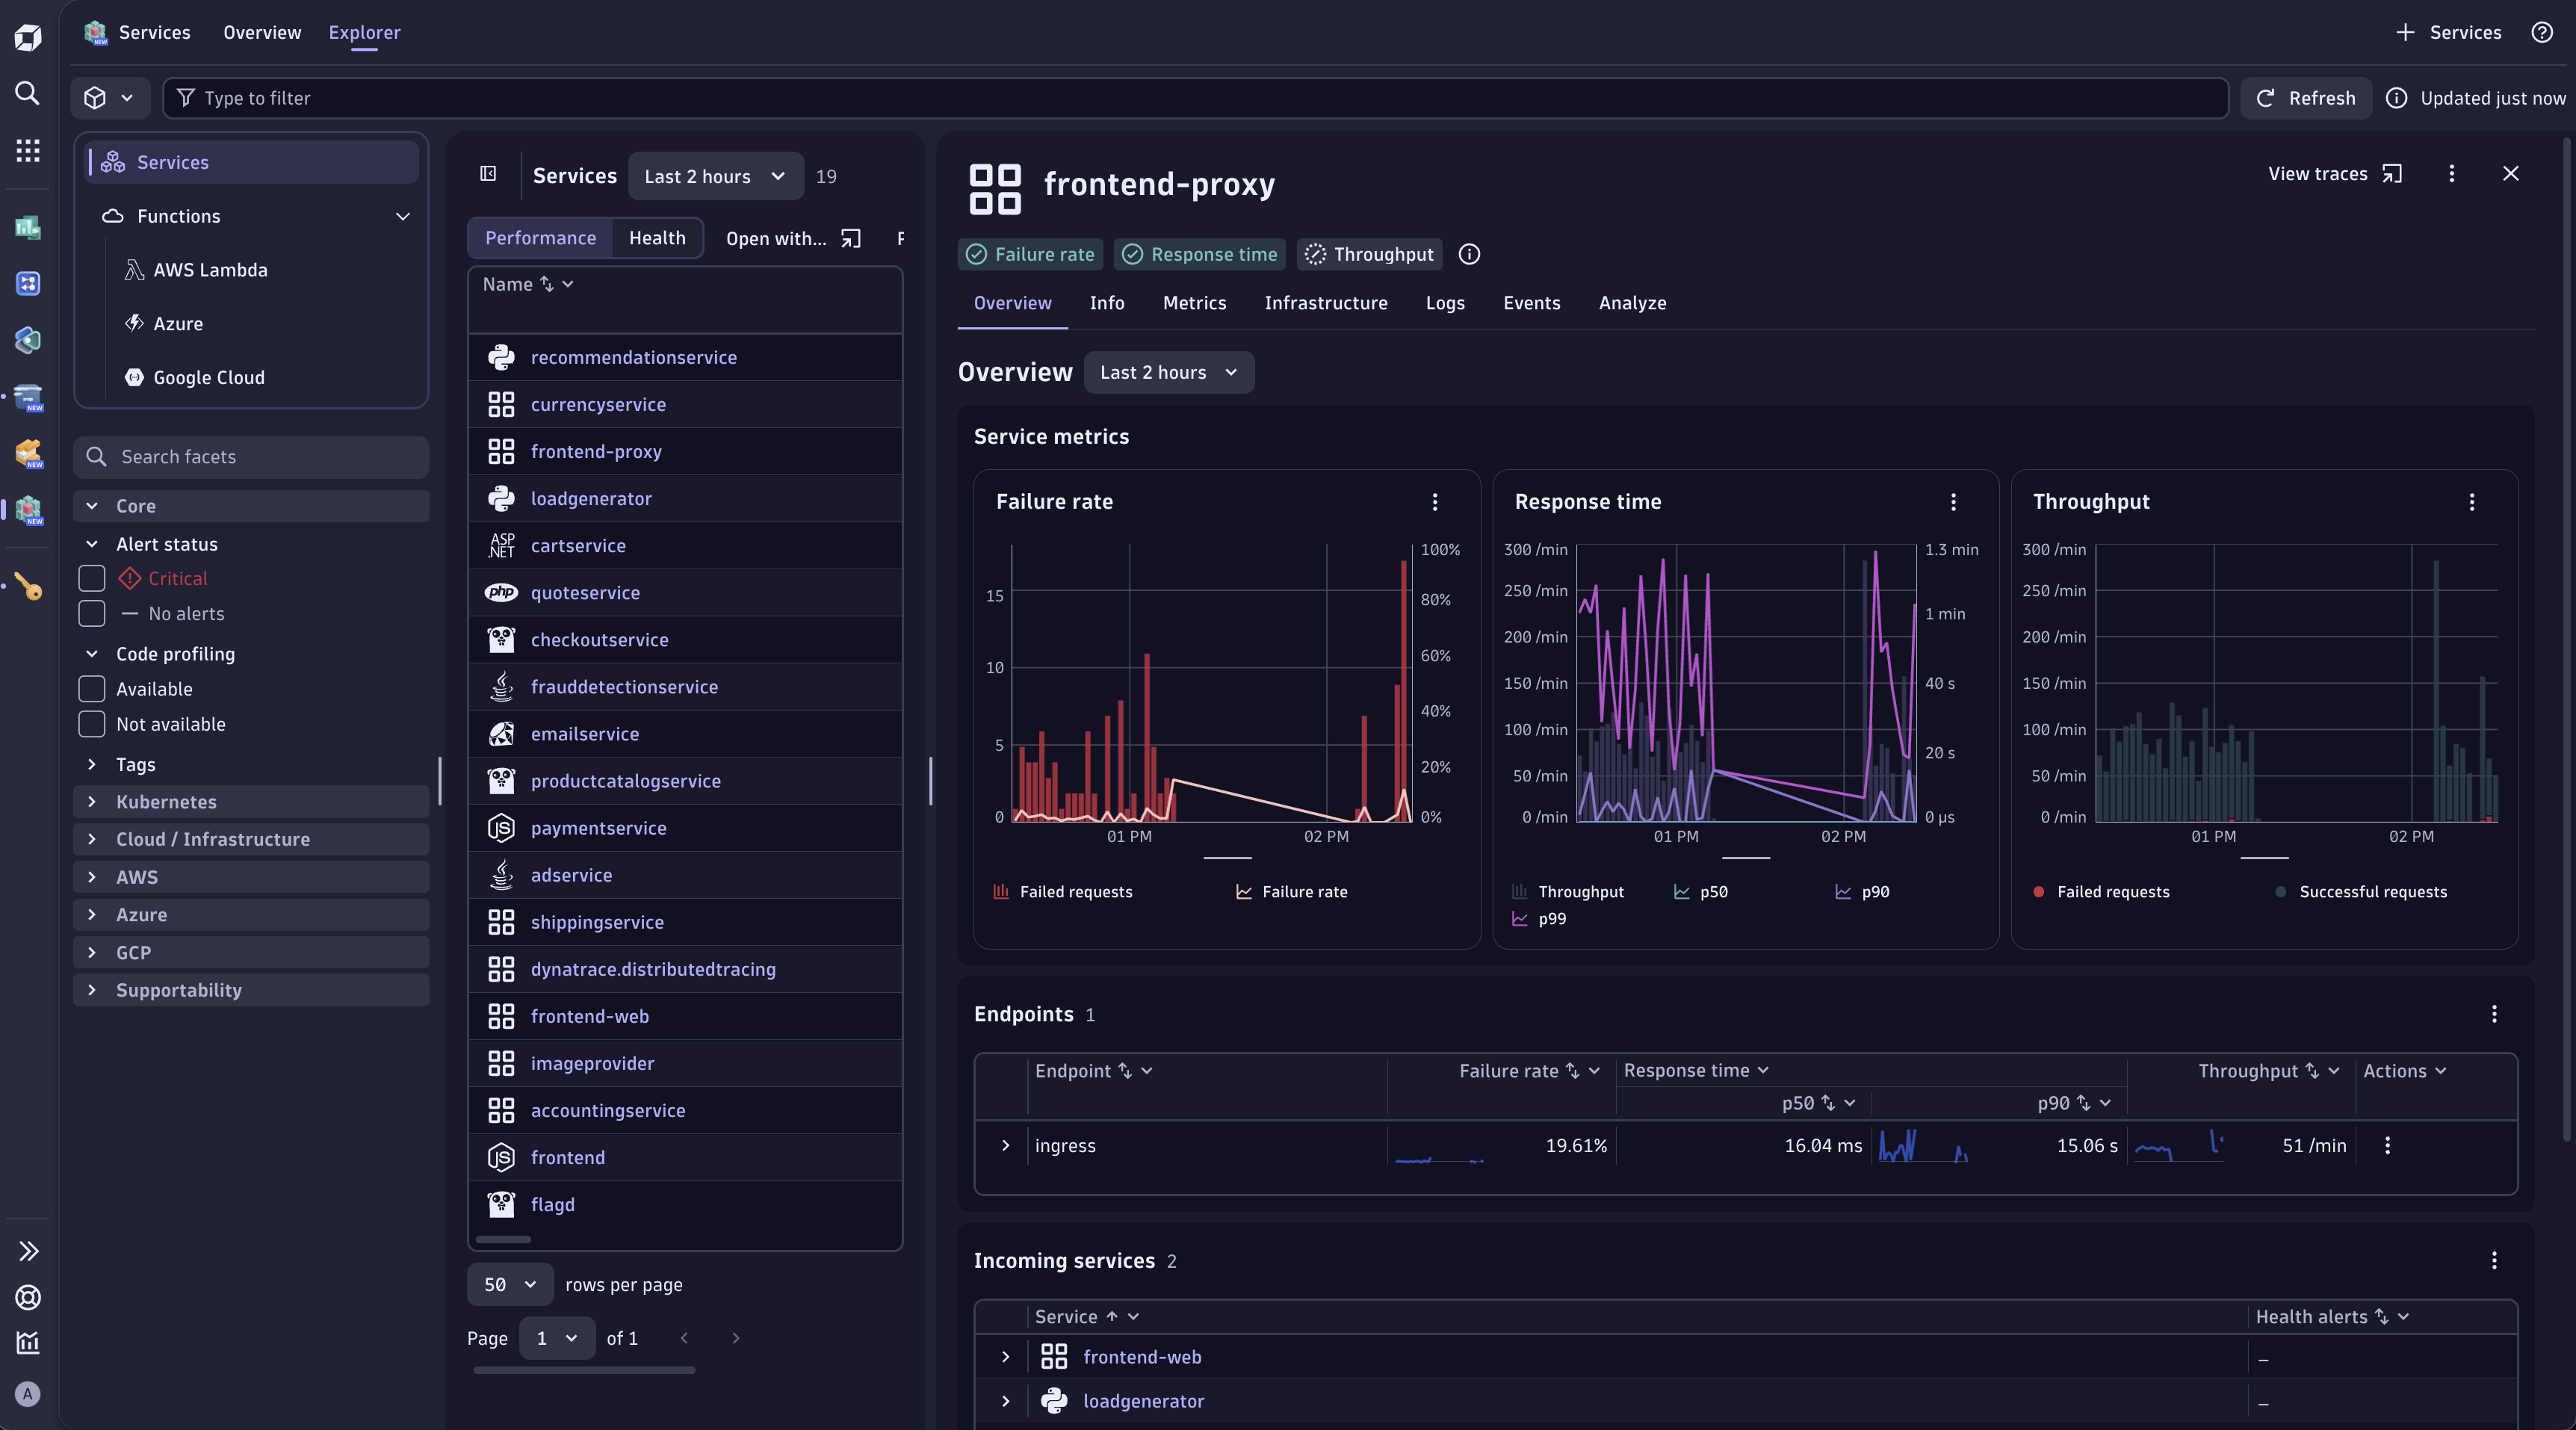
Analyze your deployed services with automated health analysis and more in the Services app.
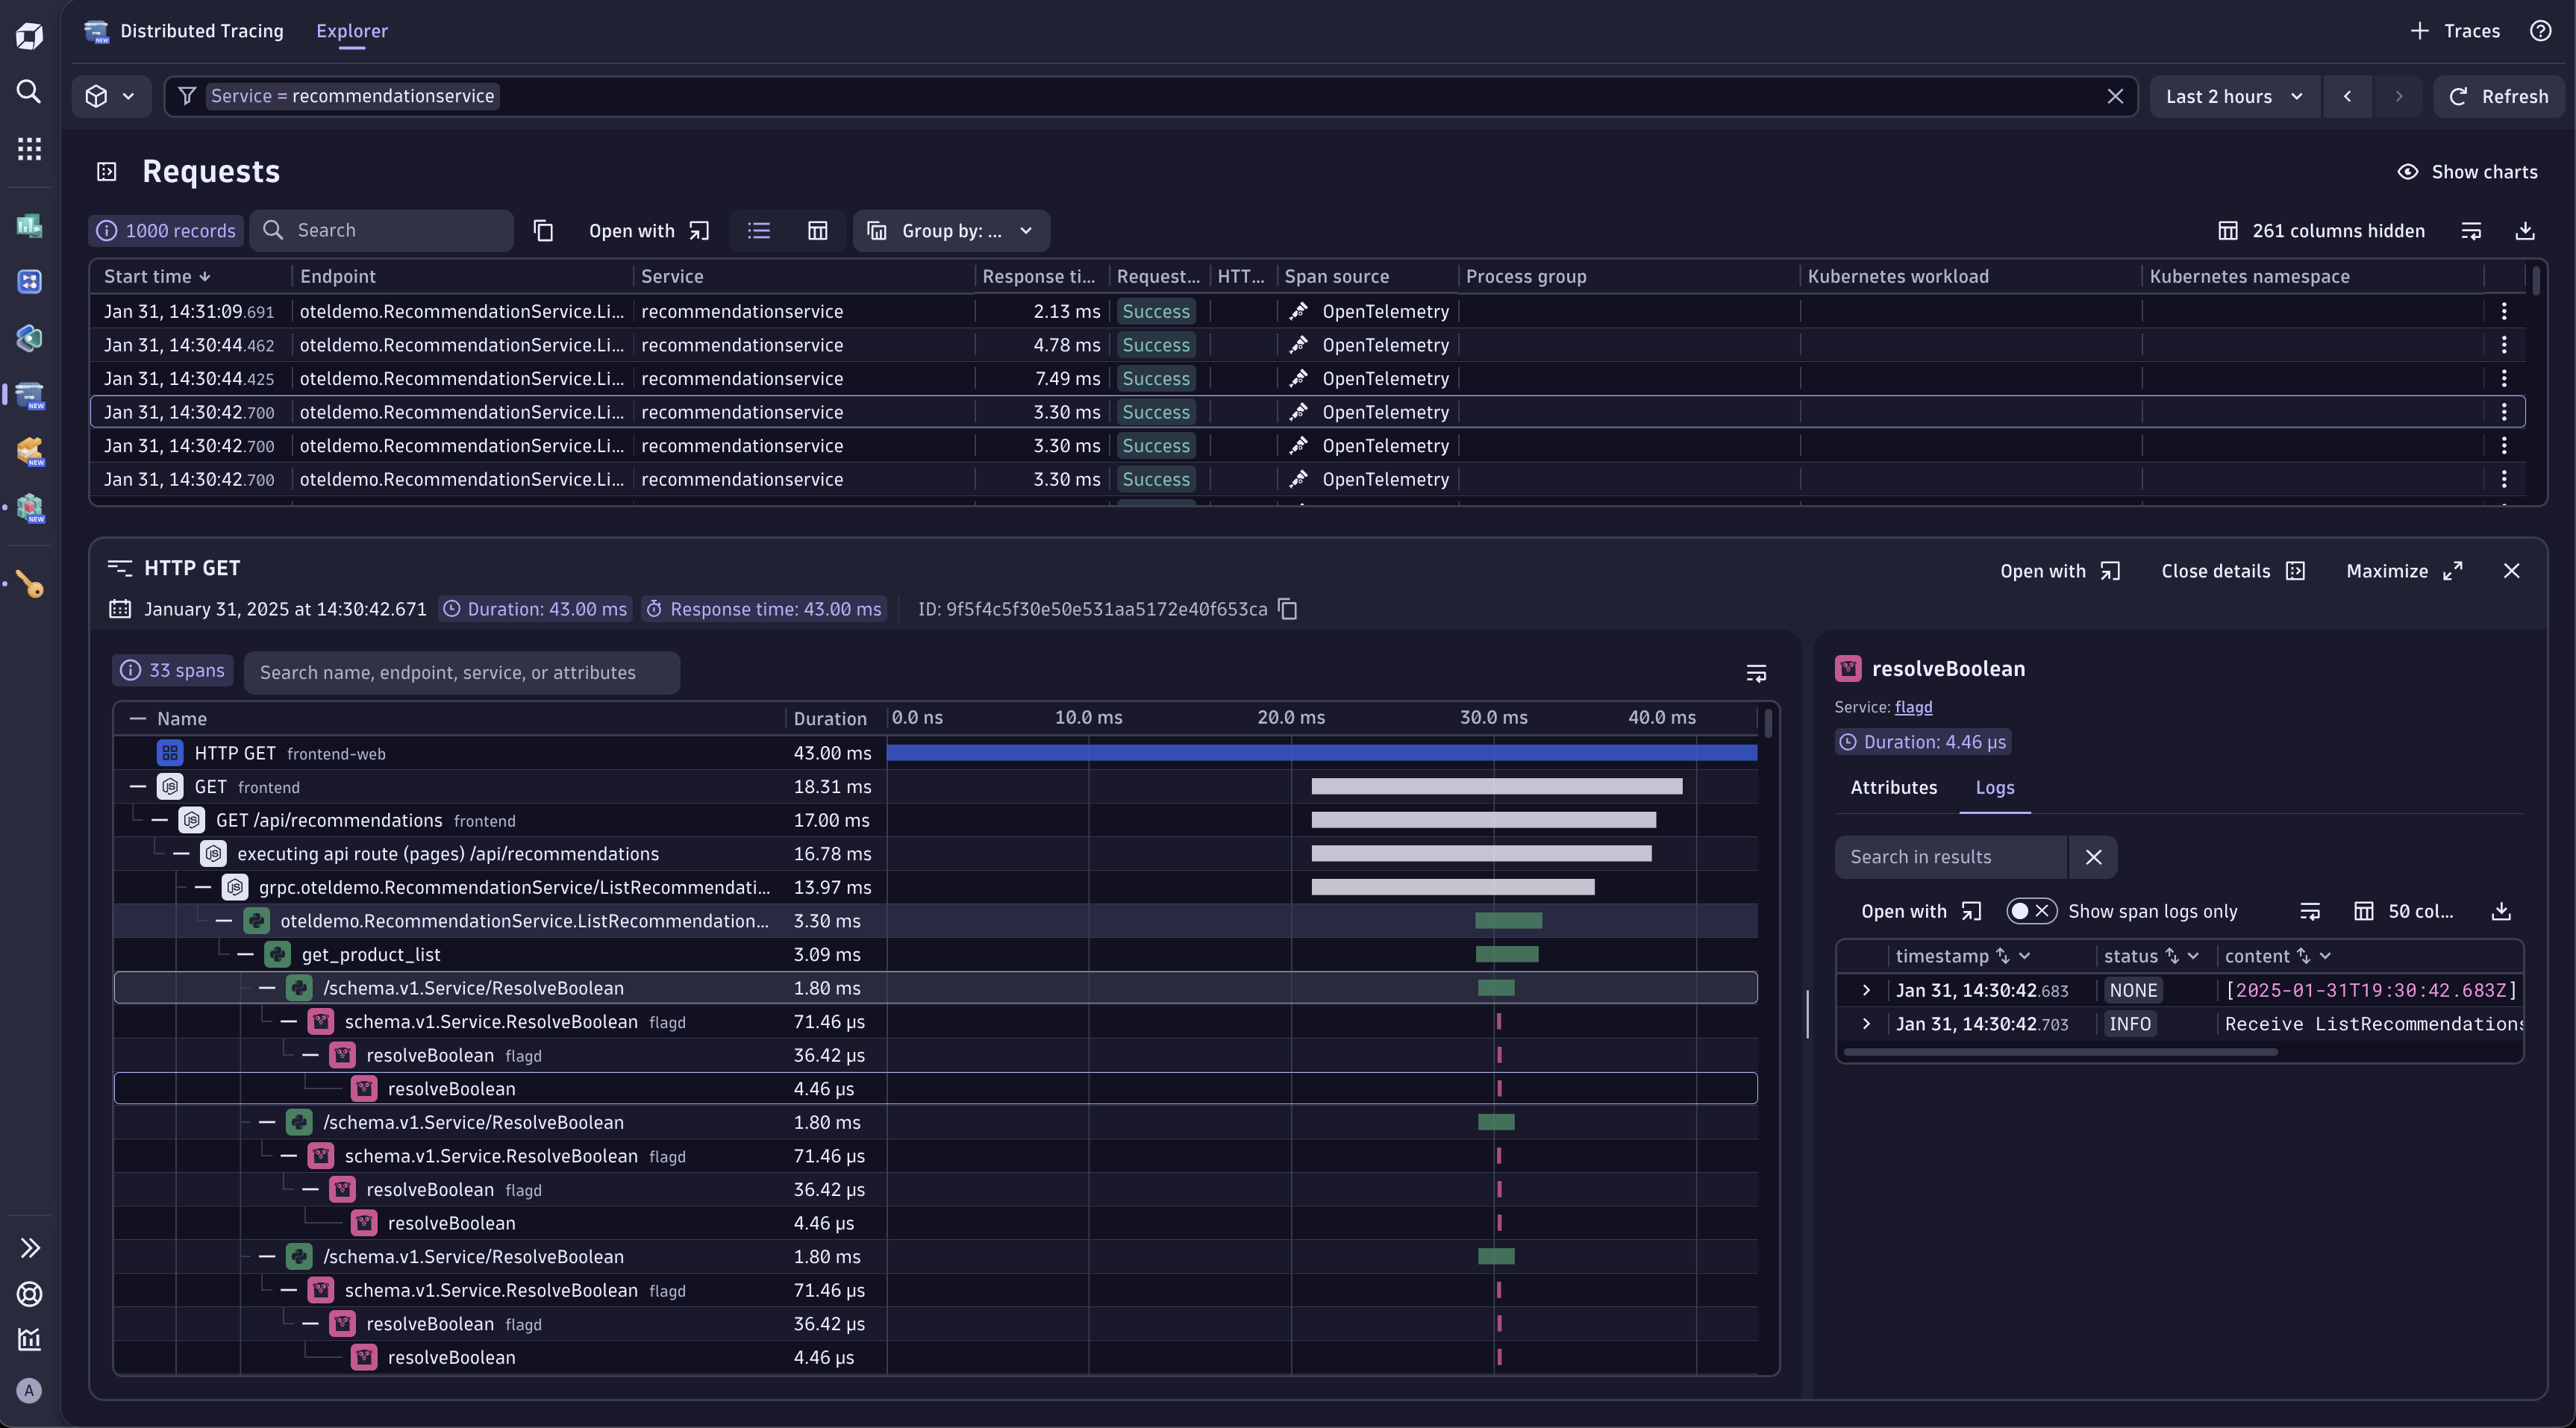
View your traces in the Distributed Tracing app.
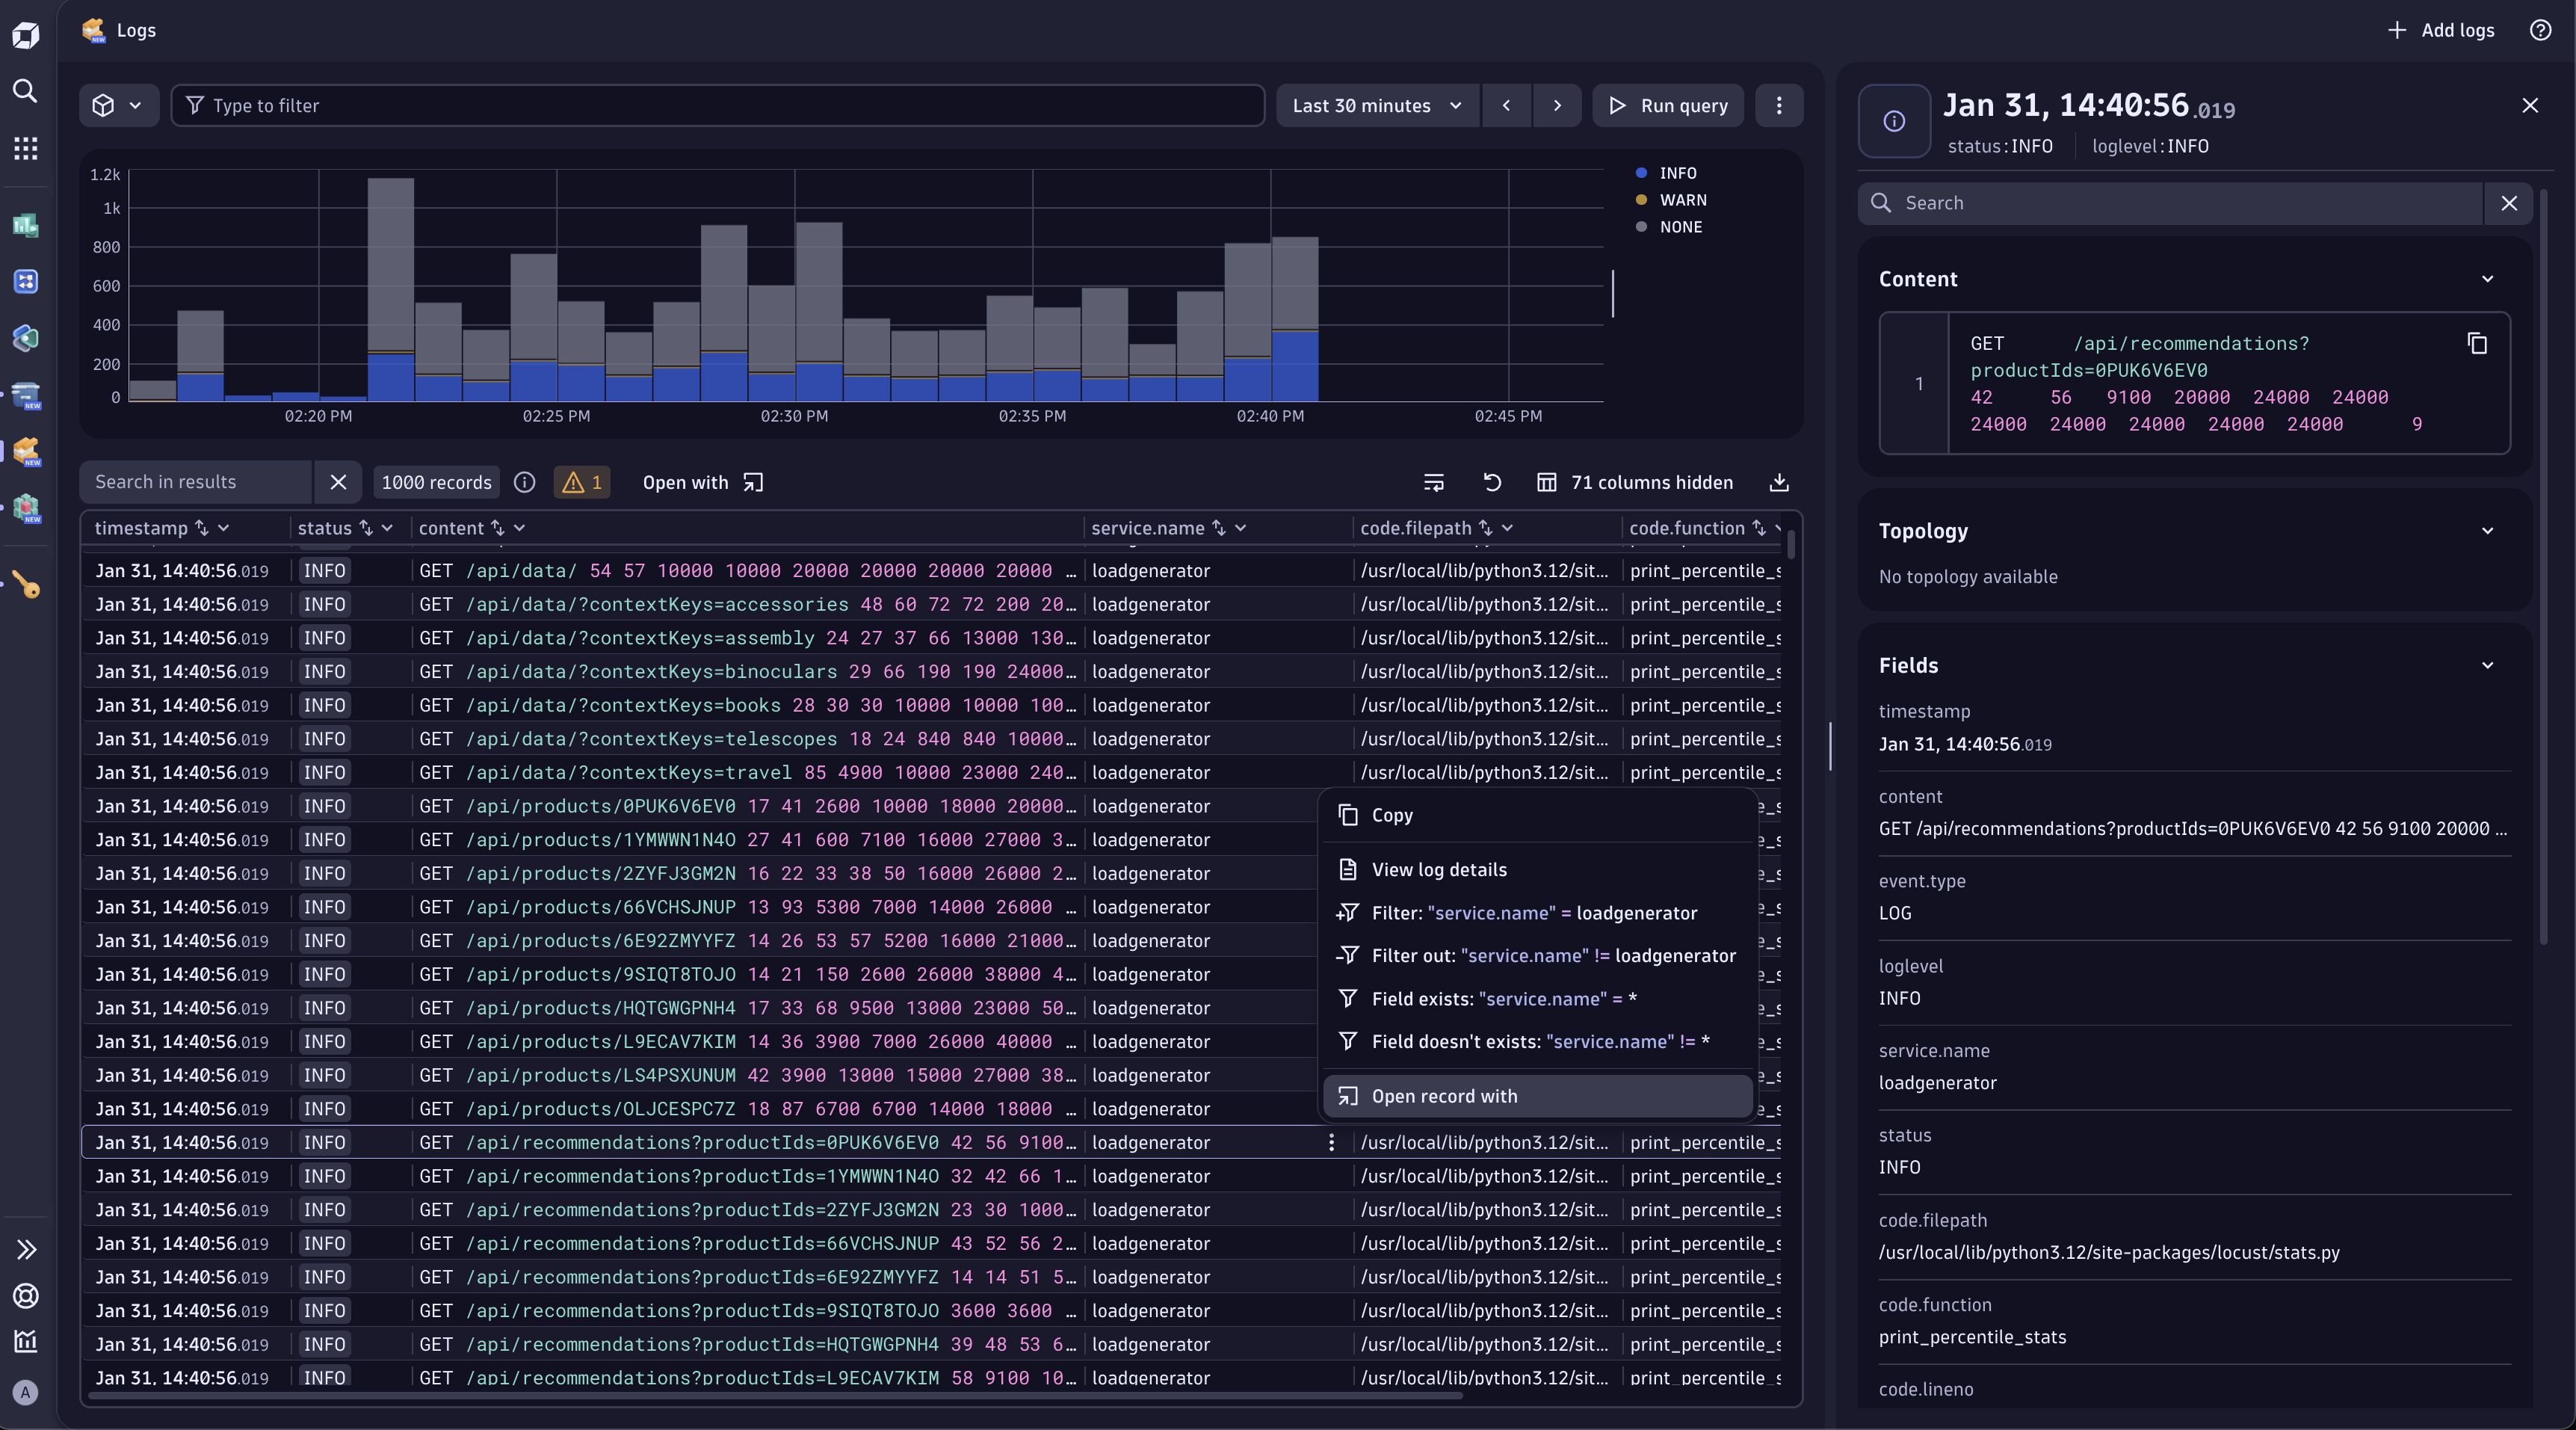
View your logs, including logs related to the distributed traces, in the Logs app.
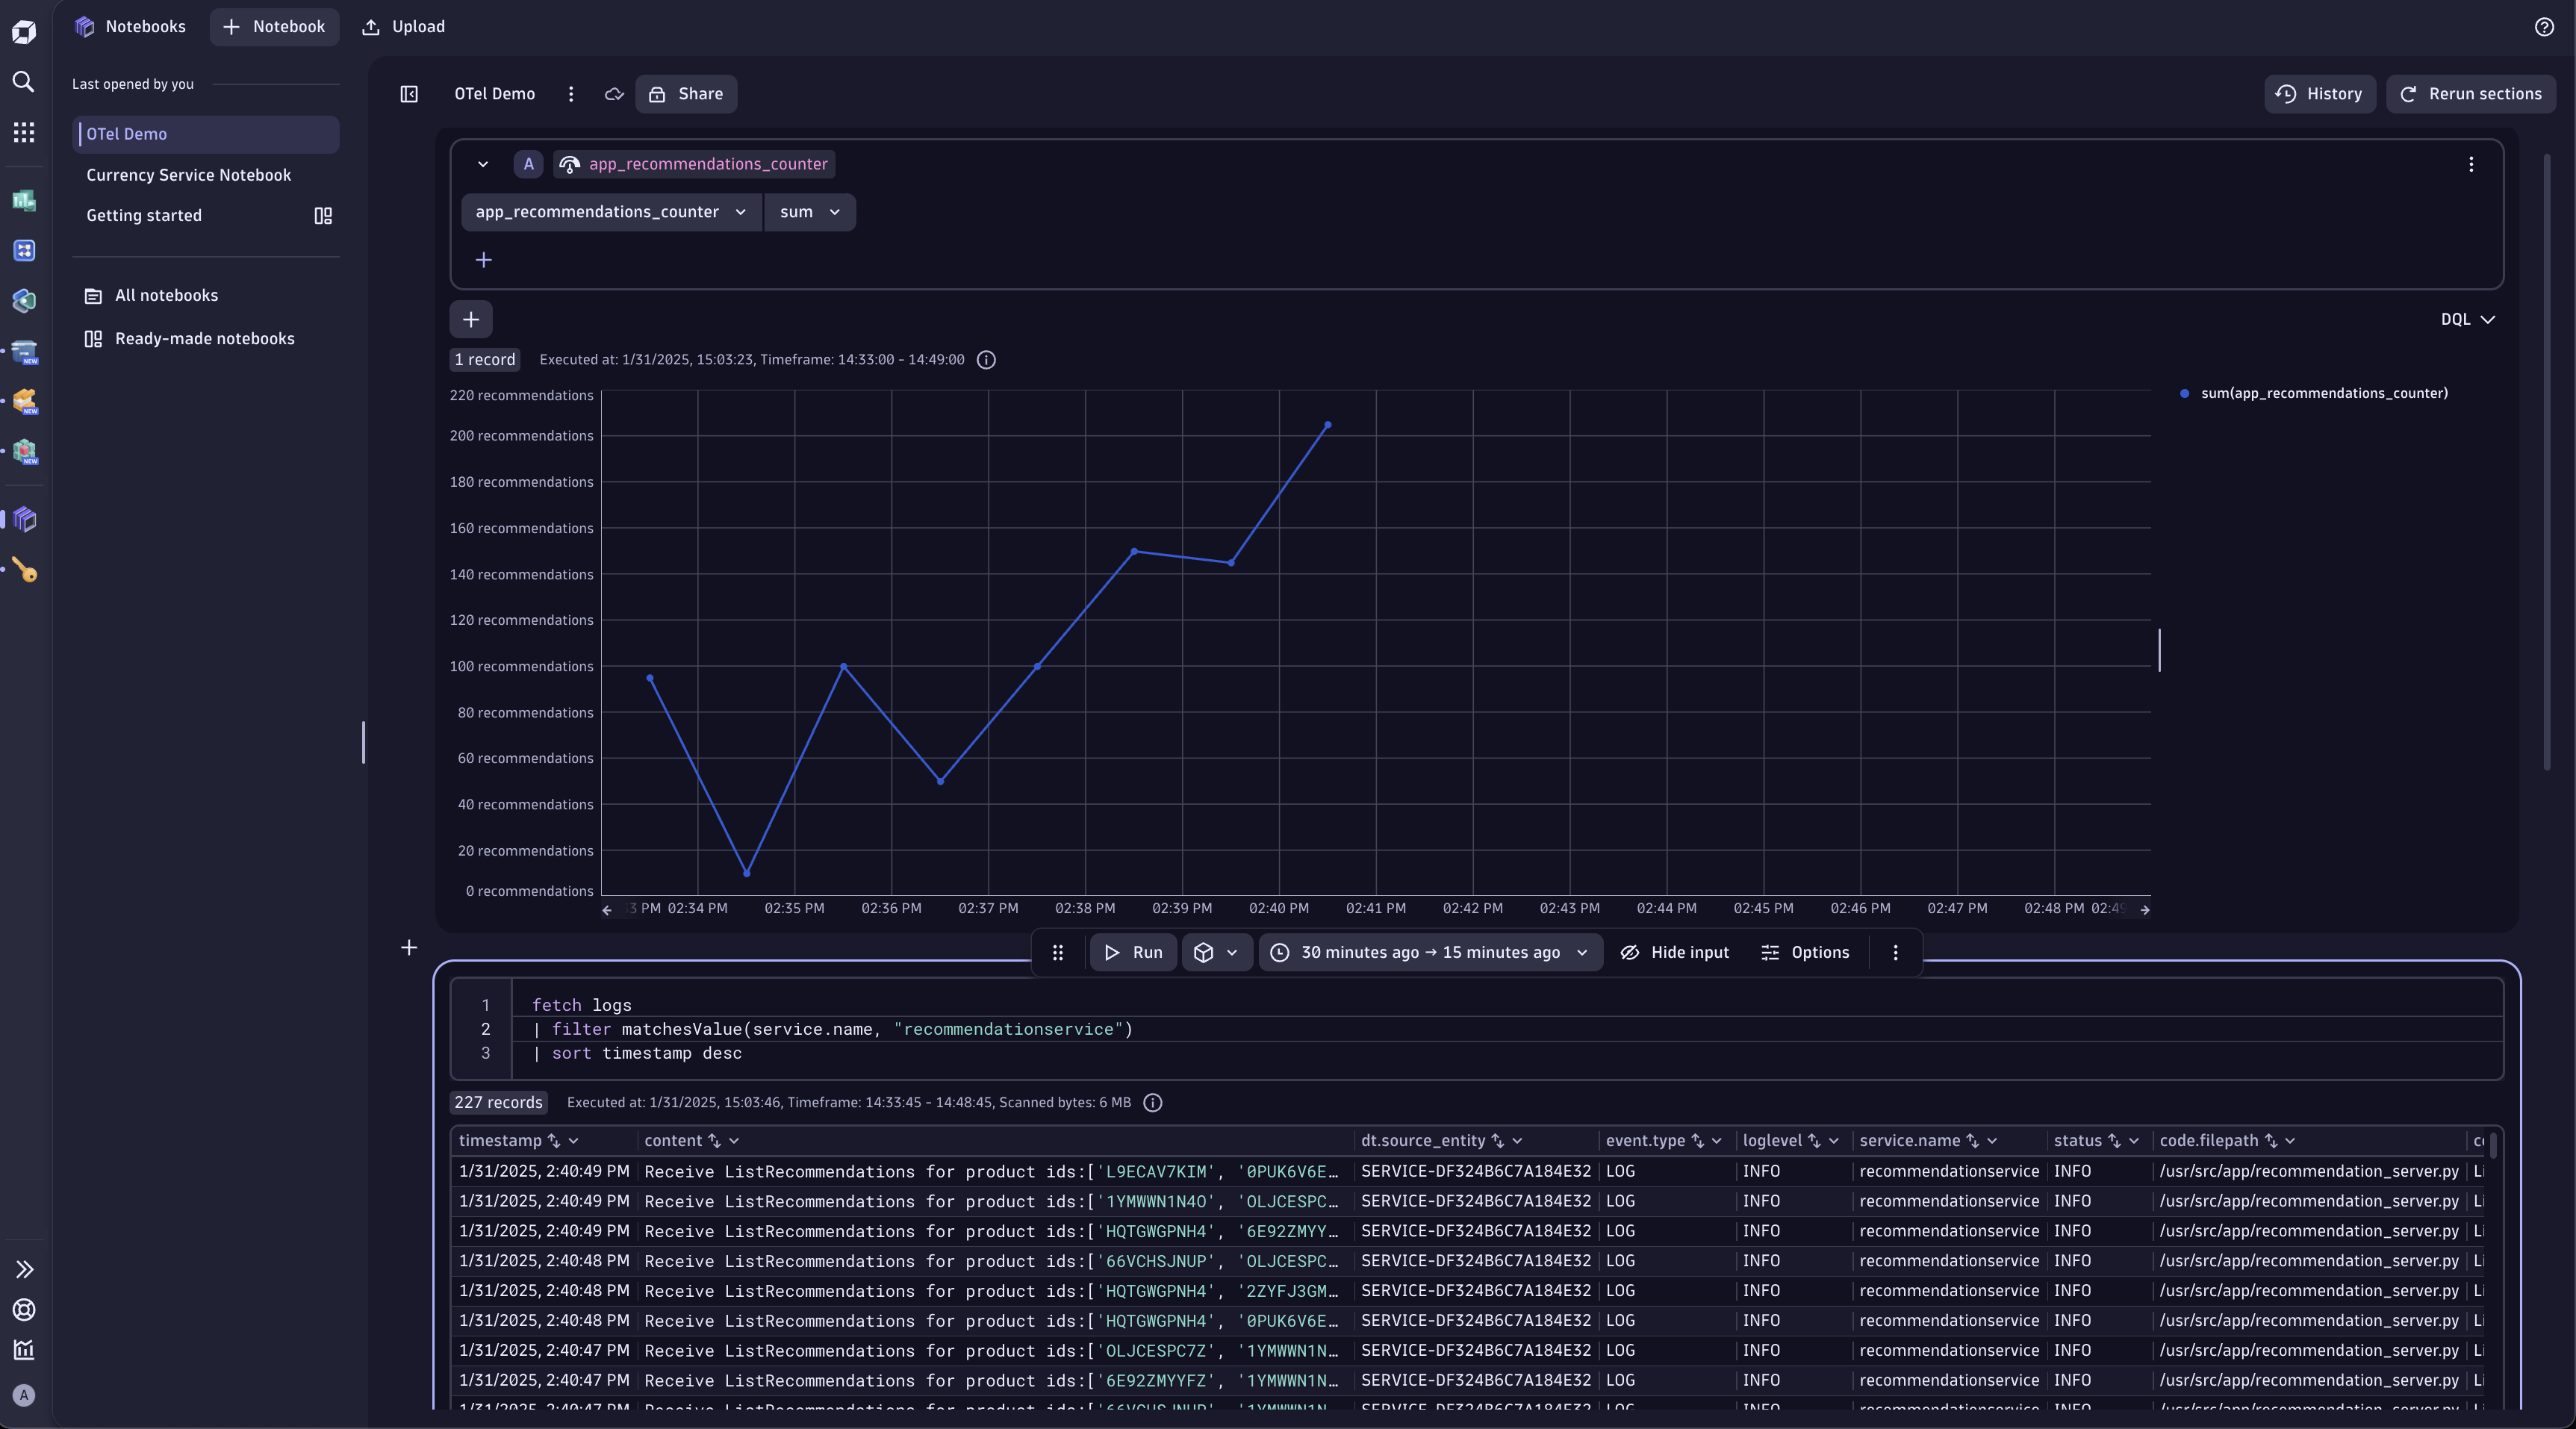
With Notebooks, you can Chart, analyze, set up alerts, and forecast any of your metrics.
What’s next?
If you’re interested in learning first-hand what Dynatrace and OpenTelemetry can do together, dive into the following resources:
- Check out the Dynatrace Playground with an existing Dynatrace account, or sign up directly for a free tour of the Dynatrace Playground. Once in the Playground, you can use Dynatrace to explore pre-populated OpenTelemetry data.
- Configure the OpenTelemetry Demo to send data to Dynatrace, or instrument your own application.
- Check out the first video of our new video series, “Dynatrace Can Do THAT with OpenTelemetry?”
Get started with a free trial and ingest your own OpenTelemetry data today


Looking for answers?
Start a new discussion or ask for help in our Q&A forum.
Go to forum