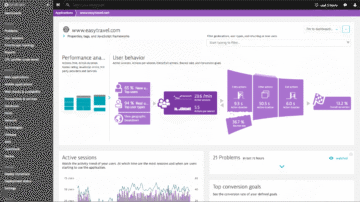
What is IoT monitoring?
Internet of Things (IoT) monitoring is the process of discovering, monitoring, and managing your connected devices. IoT monitoring analyzes data, provides insights, informs you of any issues affecting the business, and provides actionable answers for all your connected devices.
Massive complexity and scale
IoT ecosystems are complex, with many moving parts and huge amounts of data. Traditional or homegrown monitoring approaches cannot scale or provide insights in these environments.
Here’s why:
Complexity
69%of CIOs predict that IoT complexity will become a major performance management burden.
Severe impacts
74%application topology changes are already processed by Dynatrace per day.
User experience
69%of CIOs fear losing control over the user experience as the IoT delivery chain continues to become more convoluted.
Intelligent IoT monitoring from the edge to the core
Tame the complexity of IoT
Gain full-stack observability and control with end-to-end monitoring, including edge devices and hybrid IoT cloud solutions.
Use AI for reliable IoT performance
Leverage AI-driven big data analytics for automated fault detection, root-cause analysis, and auto-remediation.
Deliver unrivalled user experience
Ensure perfect experiences by seeing every customer journey as they interact with novel interfaces like smart speakers, mobile devices, and wearables.


The Dynatrace solution has great capabilities that we are using in an enterprise grade monitoring tool to support the IoT landscape.
Try it free

Additional resources
 ReportA Leader in the 2025 Gartner® Magic Quadrant™ for Observability Platforms
Positioned highest in Execution Free ReportThe state of observability in 2024
This report explores the challenges of multicloud environments, and how IT and security teams can overcome them with AI-driven analytics and automation- ReportDynatrace named a Leader in the 2025 Gartner® Magic Quadrant™ for Digital Experience Monitoring
We’re honored that Gartner has named us a Leader in the 2025 Magic Quadrant for Digital Experience Monitoring for the second year in a row, and positioned us furthest in Vision.
