ServiceNow IT Operations Management (ITOM) provides an overview on your business services as well as on the underlying infrastructure. Dynatrace on the other hand delivers real time performance, error and availability information on application level as well as on infrastructural level. Combining ServiceNow ITOM and Dynatrace OneAgent information highly improves the overall visibility in terms of accuracy and granularity. With this Dynatrace release we introduce a ServiceNow ITOM integration that directly pushes Dynatrace detected events into the ServiceNow event table.
ServiceNow IT Operations Management correlates events from multiple sources to filter and align detected events with the underlying business services and applications in your environment. As the ServiceNow ITOM module relies on the quality and accuracy of the details of individual events, connecting Dynatrace—the next generation full-stack monitoring platform—as an ITOM event source is a smart move. While Dynatrace detects all application, infrastructure, and cloud-based anomalies, IT operations teams can flexibly filter and route these incoming Dynatrace events within the ServiceNow ITOM dashboard. Dynatrace provides accurate event detection and delivery even within highly dynamic microservice environments, with no time-consuming configuration required.
To enable ServiceNow ITOM integration within Dynatrace
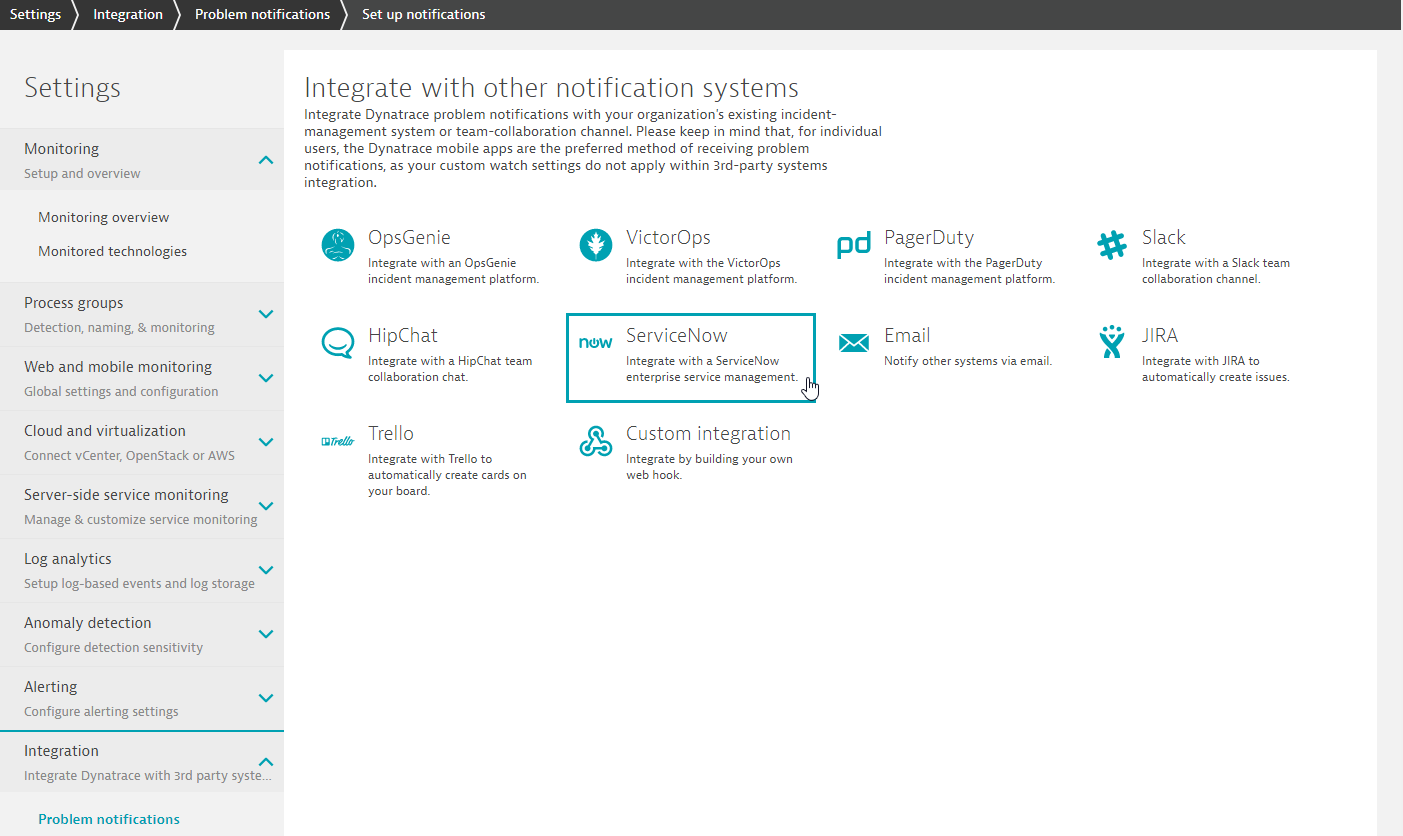
- Go to Settings > Integration > Problem notifications and
- Click the ServiceNow tile.

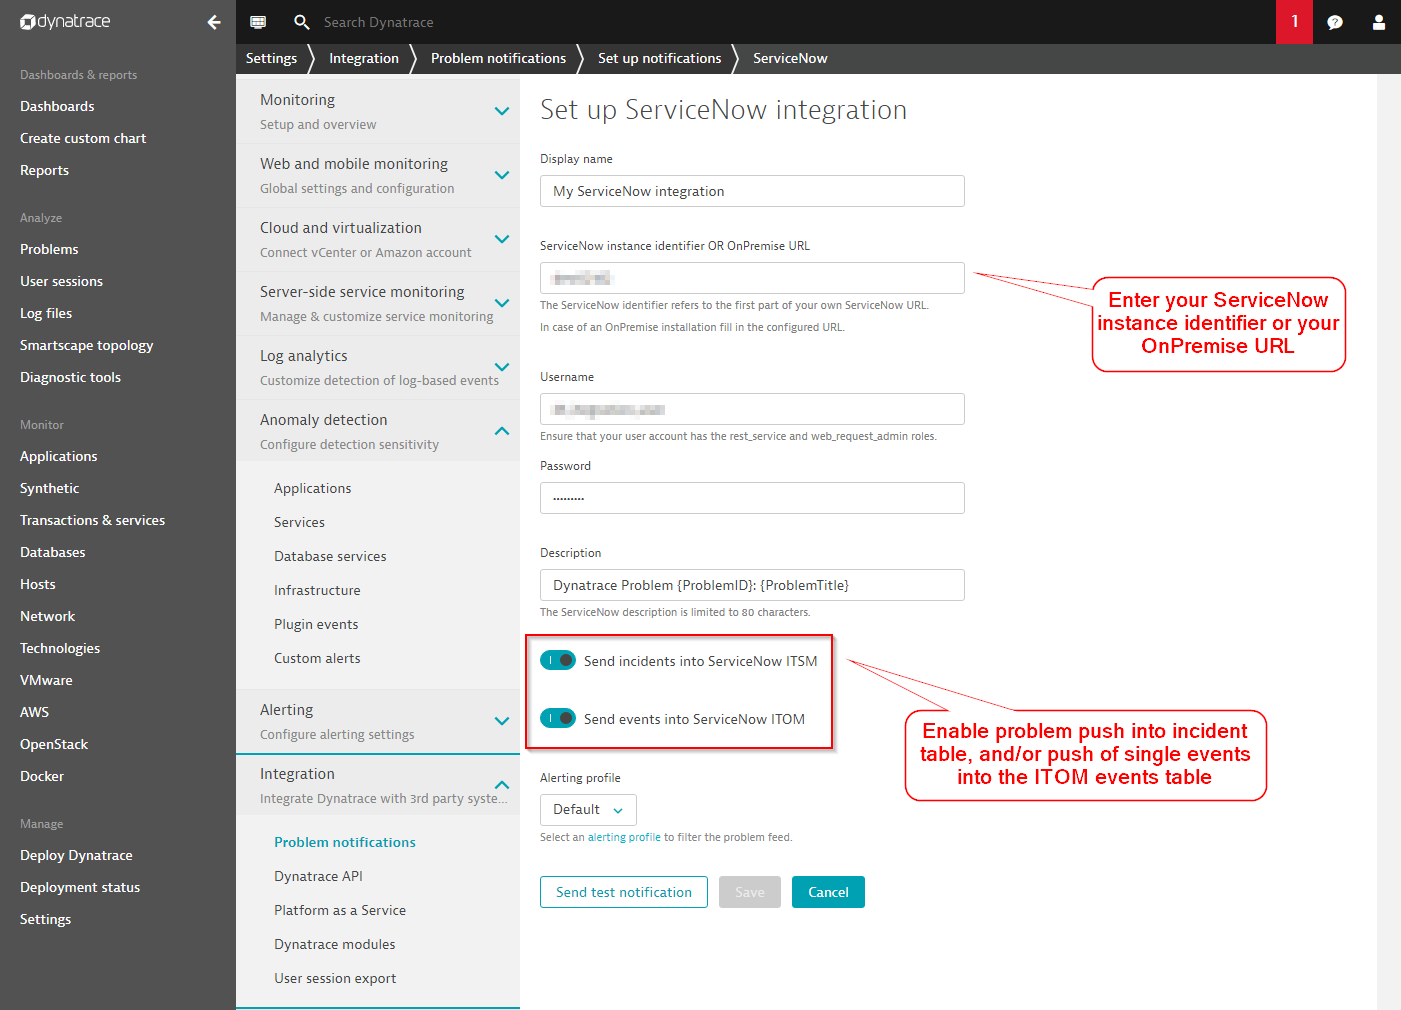
- On the Setup ServiceNow Integration page, set the Send events into ServiceNow ITOM switch to the On position. Once enabled, all detected infrastructure events that are correlated within a Dynatrace-detected problem are automatically pushed to the ITOM event API.
The ServiceNow to Dynatrace integration uses the ITOM Events WebService Bulk API to send detected events and automatically trigger ITOM-related CI mapping and alerting workflows. ServiceNow users can then define specific filtering and alerting rules to either alert send alerts related to Dynatrace-detected events or to attach those events to selected CMDB configuration items.
To avoid double reporting of individual incidents, the Setup ServiceNow Integration page also offers a toggle for enabling/disabling the sending of ServiceNow incidents. This switch should be disabled when the ServiceNow ITOM module is used for incident creation rather than Dynatrace.
>
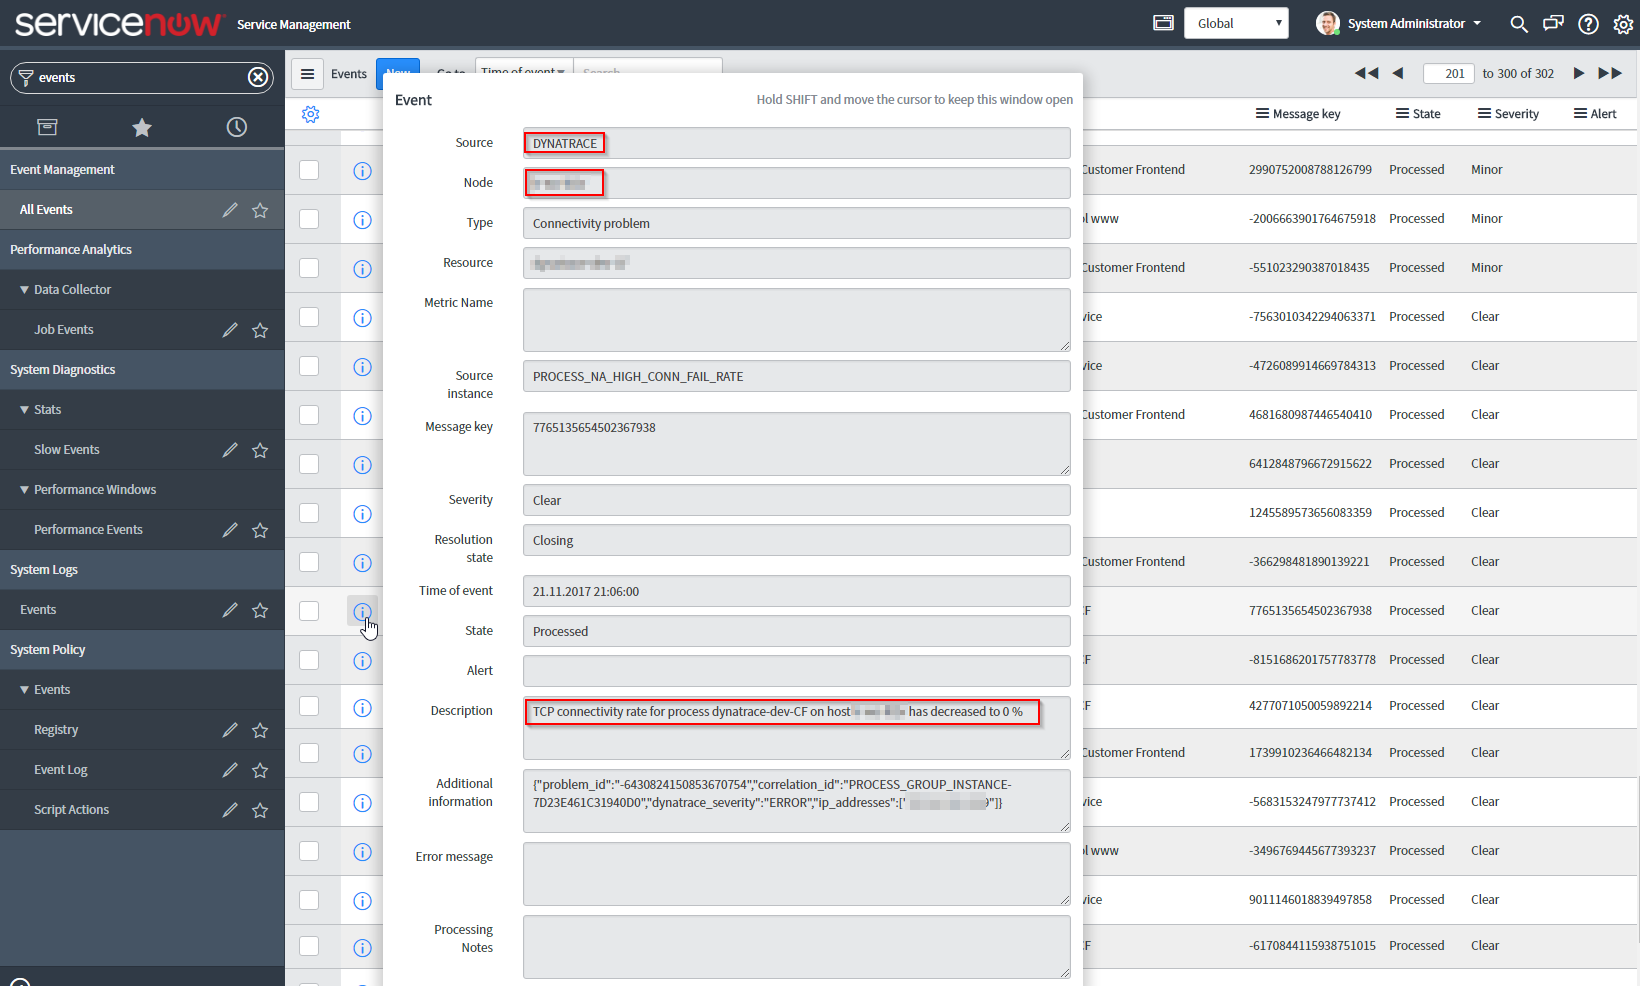
Once the ITOM integration is enabled, the ServiceNow event table will show events generated by the DYNATRACE source, as shown below:

As you can see, Dynatrace provides a human-readable event description, TCP connectivity rate for process Dynatrace-dev-CF on host lr-ws-l02v has decreased to 0%. The event contains additional information, such as the IP address of the host on which the event was detected, the severity of the event, and the unique Dynatrace ID of the affected entity, PROCESS_GROUP_INSTANCE_7D23E461C31940D0. With this ID, additional information about the affected entity can be pulled using the Dynatrace REST API.
The newly introduced direct Dynatrace to ServiceNow ITOM integration further simplifies the use of real-time monitoring data within your IT operations management dashboard.


Looking for answers?
Start a new discussion or ask for help in our Q&A forum.
Go to forum